The phosphate mineral arrojadite-(KFe) and its spectroscopic characterization
Ray L. Frost
a,⇑, Yunfei Xi
a, Ricardo Scholz
b, Laura Frota Campos Horta
baSchool of Chemistry, Physics and Mechanical Engineering, Science and Engineering Faculty, Queensland University of Technology, GPO Box 2434, Brisbane, Queensland 4001, Australia bGeology Department, School of Mines, Federal University of Ouro Preto, Campus Morro do Cruzeiro, Ouro Preto, MG 35,400-00, Brazil
h i g h l i g h t s
"We have undertaken a study of the arrojadite-(KFe) mineral.
"Electro n probe analysis shows the formula of the mineral is complex. "The complexity of the mineral
formula is reflected in the vibrational spectroscopy. "Vibrational spectroscopy enables
new information about this complex phosphate mineral arrojadite to be obtained.
g r a p h i c a l
a b s t r a c t
a r t i c l e
i n f o
Article history:
Received 22 October 2012
Received in revised form 6 February 2013 Accepted 12 February 2013
Available online 27 February 2013
Keywords: Arrojadite Phosphate Raman spectroscopy Infrared spectroscopy
a b s t r a c t
The arrojadite- (KFe) mineral has been analyzed using a combination of scanning electron microscopy and a combination of Raman and infrared spectroscopy. The origin of the mineral is Rapid Creek sedimentary phosphatic iron formation , northern Yukon. The formula of the mineral was determined as K2:06Na2Ca0:89Na3:23ðFe7:82Mg4:40Mn0:78ÞR13:00Al1:44ðPO4Þ10:85ðPO3OH0:23ÞðOHÞ2.
The complexity of the mineral formula is reflected in the spectroscopy. Raman bands at 975, 991 and 1005 cm 1with shoulder bands at 951 and 1024 cm 1are assigned to the PO 3
4 m1symmetric stretching
modes. The Raman bands at 1024, 1066, 1092, 1123, 1148 and 1187 cm 1are assigned to the PO 3 4 m3
antisymmetric stretching modes. A series of Raman bands observed at 540, 548, 557, 583, 604, 615 and 638 cm 1are attributed to the m
4out of plane bending modes of the PO 4and H2PO4units. The m2
PO4and H2PO4ben ding modes are observed at 403, 424, 449, 463, 479 and 513 cm 1. Hydroxyl and water
stretching bands are readily observed. Vibrational spectroscopy enables new information about the com- plex phos phate mineral arrojadite-(KFe) to be obtained.
Ó2013 Elsevier B.V. All rights reserved.
Introductio n
The arrojadite mineral group is a complex group of phosphates with general chemical formula given as: A2B2Ca1Na2+xM
13-R(PO4)11(PO3OH1x)W2, where the site A is occupied by large and
divalent cations (Ba, Sr, Pb) plus vacancy, or monovalent cations (K, Na). The B site is occupied by either small divalent cations (Fe, Mn, Mg) plus vacancy, or monovalent cations (Na). The M site is essentially occupied by Fe 2+or Mn 2+and possibilit y of substitu-
tion by Mg, Zn, Li. R are trivalent cations (Al, Fe 3+) and W are OH
and F[1]. The nomenclatu re of arrojadite group was established
by Chopin et al. [2].
The crystal structure of arrojadite was first described by Krutik et al. [3]and later refined by Merlino et al. [4], Moore et al. [5], Steele[6]and Cámara et al. [1]. The structure of a synthetic Fe 3+
arrojadit e was refined by Yakubovich et al. [7]. Arrojadite group minerals crystallizes in the monoclinic crystal system, Space GroupCc[1]. Unit cell parameters are variable between the mem- bers of the group, however refined data for arrojadit e-(KFe) are still not available and are restricted to the data published by Lindberg[8].
1386-1425/$ - see front matter Ó2013 Elsevier B.V. All rights reserved. http://dx.doi.org/10.1016/j.saa.2013.02.027
⇑Corresponding author. Tel.: +61 7 3138 2407; fax: +61 7 3138 1804. E-mail address: r.frost@qut.edu.au(R.L. Frost).
Contents lists available at SciVerse ScienceDi rect
Spectrochim ica Acta Part A: Molecular and
Biomolecu lar Spect rosco py
In recent years, the application of spectroscopi c techniques for the understand ing the structure of phosphate minerals is increas- ing, with special attention to Al phosphates [9–12].
Farmer [13] divided the vibrational spectra of phosphates according to the presence, or absence of water and hydroxyl units. In aqueous systems, Raman spectra of phosphat e oxyanion s show a symmetric stretching mode (
m
1) at 938 cm 1, the antisymmetricstretchin g mode (
m
3) at 1017 cm 1, the symmetric bending mode(
m
2) at 420 cm 1and them
4mode at 567 cm 1[14–17]. The value
for the
m
1symmetric stretching vibration of PO 4 units as deter-mined by infrared spectroscopy was given as 930 cm 1(augelite),
940 cm 1(wavellite), 970 cm 1(rockbridgeite), 995 cm 1
(dufré-nite) and 965 cm 1 (beraunite). The position of the symmetr ic
stretchin g vibration is dependent upon the crystal chemistry of the mineral and is a function of the cation and crystal structure . The fact that the symmetric stretching mode is observed in the infrared spectrum affirms a reduction in symmetr y of the PO 4units.
The value for the
m
2symmetric bending vibration of PO 4units asdetermined by infrared spectroscop y was given as 438 cm 1
(aug-elite), 452 cm 1 (wavellite), 440 and 415 cm 1 (rockbridgeite),
455, 435 and 415 cm 1(dufrénite) and 470 and 450 cm 1
(bera-unite). The observation of multiple bending modes provides an indication of symmetry reduction of the PO 4units. This symmetry
reduction is also observed through the
m
3antisymmetr ic stretchingvibration s. Augelite shows infrared bands at 1205, 1155, 1079 and 1015 cm 1 [18]; wavellite at 1145, 1102, 1062 and 1025 cm 1;
rockbridg eite at 1145, 1060 and 1030 cm 1; dufrénite at 1135,
1070 and 1032 cm 1; and beraunite at 1150, 1100, 1076 and
1035 cm 1.
In this work, spectroscopi c investigation of monomin eral arro- jadite-(KFe) sample from Rapid Creek, Yukon, Canada has been car- ried out. The analysis includes spectroscopic characterizati on of the structure with infrared and Raman spectroscop y. Chemical analysis was applied to support the mineral characterization.
Experim ental
Samples description and preparation
The arrojadite-(KFe) sample forms part of the collection of the Geology Department of the Federal University of Ouro Preto, Minas Gerais, Brazil, with sample code SAB065. The sample was gently crushed and the associate d minerals were removed under a stereo- microscop e Leica MZ4. The arrojadite-(KFe) sample was phase ana- lyzed by X-ray diffraction.
The Rapid Creek sedimentary phosphatic iron formation comprise s the upper and youngest portion of an Aptian–Albian flyschoid sequence which reaches a maximum thickness of 4 km
Fig. 1. Backscattered electron image (BSI) of arrojadite-(KFe) single crystal up to 2.0 mm in length.
Fig. 2. EDS spectra of arrojadite-(KFe).
Table 1
Chemical composit ion of arrojadite-(KFe) from the Rapid Creek, Yukon, Canada. H2O
calculated by stoichiomet ry.
Constituent wt.% Number of cations
P2O5 46.08 11.84
Fe 2O3 25.38 7.82
Na 2O 9.06 5.33
MgO 7.16 4.40
Al 2O3 4.03 1.44
CaO 2.75 0.89
MnO 2.24 0.78
K2O 2.20 2.06
H2O 1.10 2.23
Total 100.00 36.79
in the Blow Trough. The phosphate association is composed mainly of rare minerals such as satterlyite, arrojadite group minerals, aug- elite, lazulite and gormanite, which reflect an original calcium- deficient composition. The deposition of iron and magnesium phosphates as well as apatite is strongly indicated, and this condi- tion is unique for marine phosphorites [19].
Scanning electron microscopy (SEM)
Arrojadite-(KFe) crystals were coated with a 5 nm layer of evap- orated carbon. Secondary Electron and Backscatteri ng Electron images were obtained using a JEOL JSM-6360LV equipment. Qual- itative and semi-quantitat ive chemical analyses in the EDS mode were performed with a ThermoN ORAN spectromete r model Quest and was applied to support the mineral characterization.
Raman microprobe spectroscopy
Crystals of arrojadit e-(KFe) were placed on a polished metal surface on the stage of an Olympus BHSM microscop e, which is equipped with 10 , 20 , and 50 objectives. The microscope is part of a Renishaw 1000 Raman microscope system, which also in-
cludes a monochrom ator, a filter system and a CCD detector (1024 pixels). The Raman spectra were excited by a Spectra-Physics mod- el 127 He–Ne laser producing highly polarized light at 633 nm and collected at a nominal resolution of 2 cm 1 and a precision of
±1 cm 1in the range between 200 and 4000 cm 1. Repeated acqui-
sitions on the crystals using the highest magnification (50) were accumulate d to improve the signal to noise ratio of the spectra. Ra- man Spectra were calibrated using the 520.5 cm 1line of a silicon
wafer. The Raman spectrum of at least 10 crystals was collected to ensure the consisten cy of the spectra.
An image of the arrojadite-(KFe) crystals measured is shown in the supplementary information as Fig. S1. Clearly the crystals of arrojadit e-(KFe) are readily observed, making the Raman spectro- scopic measureme nts readily obtainable.
Infrared spectroscopy
Infrared spectra were obtained using a Nicolet Nexus 870 FTIR spectromete r with a smart endurance single bounce diamond ATR cell. Spectra over the 4000–525 cm 1 range were obtained
by the co-addition of 128 scans with a resolution of 4 cm 1and a
mirror velocity of 0.6329 cm/s. Spectra were co-added to improve the signal to noise ratio.
Spectral manipulati on such as baseline correction/ad justment and smoothing were performed using the Spectracalc software package GRAMS (Galactic Industries Corporation, NH, USA). Band component analysis was undertaken using the Jandel ‘Peakfit’ soft- ware package that enabled the type of fitting function to be se- lected and allows specific paramete rs to be fixed or varied accordingly. Band fitting was done using a Lorentzian- Gaussian cross-product function with the minimum number of component bands used for the fitting process. The Gaussian –Lorentzian ratio was maintained at values greater than 0.7 and fitting was under- taken until reproducible results were obtained with squared corre- lations of r2greater than 0.995.
Results and discussion
Chemical characteri zation
The back scattered electron image (BSI) of arrojadite-(KFe) sample studied in this work is shown in Fig. 1. The fragment
shows homogeneous composition. Qualitative and semi-quant ita- tive chemical compositi on shows a complex Fe, K, Na, Mg and Al phosphat e and with minor amounts of Ca and Mn. Fluorine was not observed and the mineral is considered as OH end member. The semi-quant itative chemical data were recalcula ted consider- ing 1.10% of H2O in the structure, as expected for the arroja-
dite-(KFe) end member. The M site was recalculated on the basis of 13 cations. According to the crystal structure, 100% of Fe was considered as Fe 2+. The EDS spectra of arrojadite-(KFe)
and its chemical analysis is shown in Fig. 2. The chemical formula was calculated on the basis of 50 O atoms (O, OH) and can be ex- pressed as:
K2:06Na2Ca0:89Na3:23ðFe7:82Mg4:40Mn0:78ÞR13:00Al1:44ðPO4Þ10:85ðPO3OH0:23Þ ðOHÞ2:
The results indicate an arrojadite-(KFe) mineral. The chemical analysis is given in Table 1.
Fig. 4. (a) Raman spectrum of arrojadite-(KFe) (upper spectrum) in the 800–1400 cm 1spectral range and (b) Infrared spectrum of arrojadite-(KFe) (lower spectrum) in the
500–1300 cm 1spectral range.
Spectroscopy
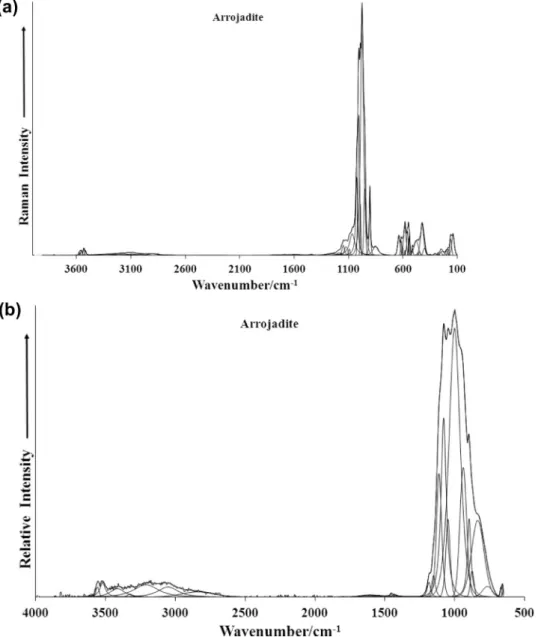
One most beneficial way of studying phosphate minerals is to undertake vibrational spectroscopy. In this way, the symmetry and distortion of the phosphate units in the mineral structure can be ascertained . Further, if there are different sometimes called non-equivalen t phosphate units, then vibrational spectroscop y can determine if the phosphate units are identical or different. The Ra- man spectrum of arrojadite-(KFe) over the 100 to 3600 cm 1
spec-tral region is displayed in Fig. 3a. This figure shows the position and relative intensity of the Raman bands. It is obvious that the less intense spectral region is over the 2600–4000 cm 1region. This re-
gion is where the water and OH stretching vibration s are likely to be observed. The overall spectrum may be subdivid ed into sections depending upon the type of vibration being studied. The infrared spectrum over the 500–4000 cm 1 spectral range is shown in
Fig. 3b.
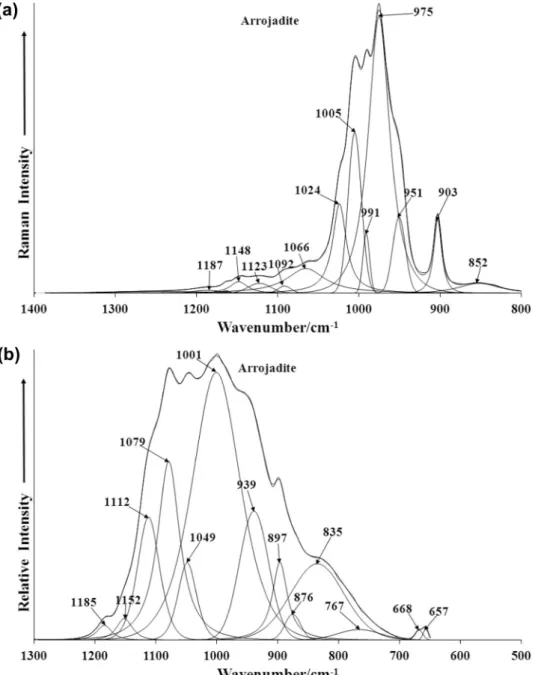
The Raman spectrum of arrojadite-(KFe) in the 800 to 1400 cm 1spectral range is reported in Fig. 4a. The Raman spec-
trum shows complexity with a number of overlapping bands. In- tense Raman bands are observed at 975, 991 and 1005 cm 1with
shoulder bands at 951 and 1024 cm 1. These bands are assigned
to the PO 3
4
m
1symmetr ic stretchin g modes. Multiple bands are ob-served depending upon to which cation the phosphat e is bonding. Raman bands are observed at 1024, 1066, 1092, 1123, 1148 and 1187 cm 1and are assigned to the PO 3
4
m
3antisymmetr ic stretch-ing modes. The Raman band at 975 cm 1 is attributed to the
stretchin g vibrations of HOPO 2
3 units. The broad Raman band at
852 cm 1 is ascribed to water librational modes. Galy [20]first
studied the polarized Raman spectra of the H2PO4 anion. Choi
et al. reported the polarizati on spectra of NaH 2PO4crystals. Casci-
ani and Condrate [21]published spectra on brushite and monetite together with synthetic anhydrous monocalci um phosphate (Ca(H2PO4)2), monocalcium dihydrogen phosphate hydrate (Ca(H
2-PO4)2H2O) and octacalcium phosphate (Ca8H2(PO4)65H2O). These
authors determined band assignment s for Ca(H2PO4) and reported
bands at 1002 and 1011 cm 1as POH and PO stretching vibration s,
respectivel y. The two Raman bands at 1086 and 1167 cm 1 are Fig. 5. (a) Raman spectrum of arrojadite-(KFe) (upper spectrum) in the 300–800 cm 1spectral range and (b) Raman spectrum of arrojadite-(KFe) (lower spectrum) in the
attributed to both the HOP and PO antisymmetric stretchin g vibra- tions. Casciani and Condrate [21]tabulated Raman bands at 1132 and 1155 cm 1and assigned these bands to P–O symmetric and
the P–O antisymmetric stretchin g vibration s. The infrared spec- trum displays greater complexity with multiple overlappi ng bands. The complexity of the spectrum makes it difficult to undertak e band assignments.
The infrared spectrum of arrojadite-(KFe) in the 500 to 1300 cm 1spectral region is displayed in Fig. 4b. The infrared spec-
trum displays greater complexity with multiple overlappi ng bands. The complexity of the spectrum makes it difficult to undertak e band assignment s. The infrared band at 1001 cm 1is assigned to
the PO 3
4
m
1symmetric stretchin g vibration. The infrared bands at1049, 1079, 1152 and 1185 are attributed to the PO 3
4
m
3antisym-metric stretching vibrational mode. The infrared band at 835 cm 1
is ascribed to water librational modes. This complexity of both the Raman and infrared spectra may be due to a mixture of different phosphate anions, namely PO 3
3 , HOPO 2
3 and H2O2PO. There is a
difference between taking a Raman spectrum and an infrared spec-
trum. The sample spot size of the Raman spectrometer is around 1 micron. In infrared spectroscopy the measure ment size is at best 30 microns. Thus in Raman spectroscopy it is possible to collect data for a pure mineral because that crystal was selected. It is more likely that the infrared spectrum is more likely to collect data for a mixture. This is why of course it is an advantage to run the Raman spectrum.
The Raman spectra of arrojadite-(KFe) in the 300 to 800 cm 1
and in the 100–300 cm 1are displayed in Fig. 5a and b. The first
spectral region is the region of the phosphate bending modes. This spectral region is where the PO 3
4 and HOPO 2
3 bending vibration s
are found. A series of bands are observed at 540, 548, 557, 583, 604, 615 and 638 cm 1. These bands are attributed to the
m
4out
of plane bending modes of the PO 4and H2PO4units. The Raman
spectrum of crystalline NaH 2PO4shows Raman bands at 526, 546
and 618 cm 1(this work). A series of bands are observed at 403,
424, 449, 463, 479 and 513 cm 1. These bands are attributed to
the
m
2 PO4 and H2PO4 bending modes. The Raman spectrum inthe far wavenumber region is shown in Fig. 5b. Quite intense bands
Fig. 6. (a) Raman spectrum of arrojadite-(KFe) (upper spectrum) in the 800–1400 cm 1spectral range and (b) infrared spectrum of arrojadite-(KFe) (lower spectrum) in the
500–1300 cm 1spectral range.
are found at 140, 162, 185, 202, 239, 251 and 275 cm 1. These
bands may be simply described as lattice vibrations.
The Raman spectrum of the OH stretchin g region of arrojadite- (KFe) is reported in Fig. 6a and b. The first figure shows the OH stretching bands and the second the water stretching bands. Ra- man bands are observed at 3515, 3560, 3553, 3564 and 3574 cm 1.
A comparison may be made with the infrared spectrum (Fig. 6b) where broad bands are observed at 2898, 3022, 3085, 3125, 3171 and 3268 cm 1, assigned to water stretching vibration al modes.
It is noted that much greater intensity of the water bands is ob- served in the infrared spectrum as compared with the Raman spec- trum. The reason for this is that water is a very poor Raman scatterer whereas water is a very strong infrared absorber . The Ra- man spectrum of arrojadite-(KFe) in the 1400 to 1800 cm 1and the
infrared spectrum in the 1300 to 1800 cm 1are shown in Fig. 7a
and b. This spectral region is where the water bending modes are observed. The Raman spectrum shows a reasonabl y strong band at 1631 cm 1 assigned to the water bending mode. A similar
intense band at 1632 cm 1is observed in the infrared spectrum.
Other infrared bands are found at 1426 and 1575 cm 1.
Conclusi ons
We have characterized the mineral arrojadite-(KFe) using vibra- tional spectroscopi c techniques with support of SEM/EDS chemical analysis. The chemical formula was calculated on the basis of 50 O atoms (O, OH) and can be expressed as:
K2:06Na2Ca0:89Na3:23ðFe7:82Mg4:40Mn0:78ÞR13:00Al1:44ðPO4Þ10:85
ðPO3OH0:23ÞðOHÞ2:
The results indicate an arrojadite-(KFe) mineral.
The mineral is characterized by an intense sharp Raman bands at 1009 cm 1with shoulders at 975, 991 and 1005 cm 1are as-
signed to stretching vibrations of PO 3
4 and HPO 2
4 units. Raman
band at 991 cm 1is assigned to the
m
1symmetric stretching mode Fig. 7. (a) Raman spectrum of arrojadite-(KFe) (upper spectrum) in the 1400–2000 cm 1spectral range and (b) infrared spectrum of arrojadite-(KFe) (lower spectrum) in the
of the POH units, whereas the Raman band at 1005 cm 1 is as-
signed to the
m
1PO34 symmetric stretching mode. Raman bands
observed at 540, 548, 557, 583, 604, 615 and 638 cm 1are attrib-
uted to the
m
4out of plane bending modes of the PO 4and H2PO4units.
The Raman bands at 3515, 3560, 3553, 3564 and 3574 cm 1are
assigned to water and hydroxyl stretching vibration. A comparis on may be made with the infrared spectrum where broad bands are observed at 2898, 3022, 3085, 3125, 3171 and 3268 cm 1, assigned
to water stretchin g vibrational modes. The observation of multiple bands gives credence to the non-equivalen ce of the water units in the arrojadite-(KFe) structure.
Acknowled gements
The financial and infra-structur e support of the Discipline of Nanotechnol ogy and Molecular Science, Science and Engineering Faculty of the Queensland University of Technolo gy, is gratefully acknowledged . The Australian Research Council (ARC) is thanked for funding the instrumenta tion. The authors would like to acknowledge the Center of Microsco py at the Universidad e Federal de Minas Gerais (http://www. microscopia.uf mg.br ) for providing the equipment and technical support for experiments involving electron microscop y. R. Scholz thanks to FAPEMIG – Fundação de Amparo à Pesquisa do Estado de Minas Gerais, (Grant No. CRA – APQ-03998-10 ). L.F.C. Horta thanks to PET/Geologi a/UFOP.
Appendix A. Supplemen tary material
Supplement ary data associated with this article can be found, in the online version, at http://dx.doi.o rg/10.1016/j.sa a.2013.02.027 .
References
[1] F. Camara, R. Oberti, C. Chopin, O. Medenbach, Am. Mineral. 91 (2006) 1249– 1259.
[2] C. Chopin, R. Oberti, F. Camara, Am. Mineral. 91 (2006) 1260–1270.
[3] V.M. Krutik, D.Y. Pushcharovskii, E.A. Pobedimskaya, N.V. Belov, Kristallografiya 24 (1979) 743–750.
[4] S. Merlino, M. Mellini, P.F. Zanazzi, Acta Crystallogr. Sect. B 37 (1981) 1733– 1736.
[5] P.B. Moore, T. Araki, S. Merlino, M. Mellini, P.F. Zanazzi, Am. Mineral. 66 (1981) 1034–1049.
[6] I.M. Steele, in: 18th General Meeting of the International Mineralogical Association, Edinburgh, UK, 2002, p. 117.
[7] O.V. Yakubovich, E.N. Matvienko, M.A. Simonov, O.K. Mel’nikov, Vest. Mosk. Univ. Seriya 4: Geologiya, 1986, pp. 36–47.
[8] M.L. Lindberg, Am. Mineral. 35 (1950) 59–76.
[9] L.N. Dias, M.V.B. Pinheiro, R.L. Moreira, K. Krambrock, K. Guedes, L.A.D.M. Filho, J. Karfunkel, J. Schnellrath, R. Scholz, Am. Mineral. 96 (2011) 42–52. [10] R.L. Frost, Y. Xi, J. Mol. Struct. 1010 (2012) 179–183.
[11] R.L. Frost, Y. Xi, S.J. Palmer, R. Pogson, Spectrochim. Acta. A 82 (2011) 461–466. [12] R.L. Frost, Y. Xi, S.J. Palmer, R.E. Pogson, Spectrochim. Acta. A 83 (2011) 106–
111.
[13] V.C. Farmer, Mineralogical Society Monograph 4: The Infrared Spectra of Minerals, The Mineralogical Society, London, 1974.
[14] R.L. Frost, T. Kloprogge, P.A. Williams, W. Martens, T.E. Johnson, P. Leverett, Spectrochim. Acta. A 58 (2002) 2861–2868.
[15] R.L. Frost, W. Martens, P.A. Williams, J.T. Kloprogge, Mineral. Mag. 66 (2002) 1063–1073.
[16] R.L. Frost, W.N. Martens, T. Kloprogge, P.A. Williams, Neues Jahr. Min. (2002) 481–496.
[17] R.L. Frost, P.A. Williams, W. Martens, J.T. Kloprogge, P. Leverett, J. Raman Spectrosc. 33 (2002) 260–263.
[18] R.L. Frost, M.L. Weier, J. Mol. Struct. 697 (2004) 207–211.
[19] F.G. Young, The mid-Cretaceous flysch and phosphatic ironstone sequence, northern Richardson Mountains, Yukon Territory, Report of Activities, Geological Survey of Canada, vol. 77-1C, 1977, pp. 67–74.
[20] A. Galy, J. Phys. Rad. 12 (1951) 827.
[21] F.S. Casciani, R.A. Condrate, Sr., The infrared and Raman spectra of several calcium hydrogen phosphates, in: Proceedings – International Congress on Phosphorus Compounds, second ed., 1980, pp. 175–190.