Printed in Brazil - ©2006 Sociedade Brasileira de Química 0103 - 5053 $6.00+0.00
A
r
ti
c
le
*e-mail: [email protected]
Raman and Infrared Spectroscopy Studies of Carbon Nitride Films Prepared on Si (100)
Substrates by Ion Beam Assisted Deposition
Wilmer Sucasaire,*,a Masao Matsuoka,a Karina C. Lopes,a Juan C. R. Mittani,a Luis H. Avanci,a Jose F. D. Chubaci,a Nemitala Added,a Vladimir Travab and Evaldo J. Coratb
a
Instituto de Física, Universidade de São Paulo, CP 66318, 05315-970 São Paulo-SP, Brazil
b
Instituto Nacional de Pesquisas Espaciais, 12227-010 São José dos Campos-SP, Brazil
Filmes de nitreto de carbono, preparados por deposição assistida por feixe de íons, foram estudados pela espectroscopia de Raman e infravermelho, em função de energia de íons (200, 400, e 600 eV) e razão de chegada de íon a átomo R(I/A) de 0,9 a 2,5. A razão de composição N/C no filme, determinada por análise de detecção de recuo elástico, foi encontrada proporcional a R(I/A); porém, a formação de filme é possível somente se R(I/A) for menor do que um valor crítico da eficiência de “sputtering” químico. Esse valor encontrado foi de 0,21. O valor máximo de N/C obtido foi de 0,9 (47% atômica de nitrogênio) para o filme depositado com 400 eV. Para entender o efeito de incorporação de nitrogênio na estrutura dos filmes, os parâmetros foram determinados pela análise dos espectros Raman e encontrados fortes dependências da quantidade de nitrogênio nos filmes; os comportamentos da posição e da largura do pico G, e da razão ID/IG são correlacionados com as mudanças estruturais nos filmes.
Carbon nitride films prepared by ion beam assisted deposition were studied by Raman and infrared spectroscopy, as a function of nitrogen ion energy (200, 400, and 600 eV) and the ion to atom arrival rate ratio R(I/A) ranging from 0.9 to 2.5. The composition ratio N/C in the film determined by elastic recoil detection analysis was found to be proportional to R(I/A); however, the film growth is possible only if R(I/A) is smaller than a critical value of chemical sputtering yield. This value was found to be 0.21. The maximum value of N/C obtained was 0.9 (47 at.% of nitrogen) for the film deposited with ion energy of 400 eV. In order to understand the effect of nitrogen incorporation on the structure of the films, the parameters were determined from the Raman spectra analysis of the films and found to show strong dependences of the nitrogen content in the films; the behaviors of the G peak position and width, and ID/IG ratio are correlated with the structure changes in the films.
Keywords: carbon nitride, Raman spectroscopy, infrared spectroscopy, ion beam deposition.
Introduction
Liu and Cohen’s theoretical work in 1989 indicated that β-C3N4 analogous to β-Si3N4 should be reasonably stable and that its hardness might be equal or superior to that of diamond.1 In the structure of this hypothetical
material, each sp3-hybridized carbon atom is nearly
tetrahedrally surrounded by four sp2-hybridized nitrogen
atoms and each nitrogen triply coordinated with three carbon atoms as the nearest neighbors occupies in a trigonal plane site.
Several techniques have been employed to deposit this material, such as reactive magnetron sputtering,2,3 RF
reactive2-5 and DC magnetron sputtering,2,3 and dual ion
beam deposition.6-10 The ion beam assisted deposition
(IBAD) technique is vacuum deposition of material onto a substrate combined with simultaneous ion irradiation.3,7 The
flux and the energy of incident ions can be changed independently of the flux of depositing atoms, thereby easily controlling the chemical composition of compound films. The materials prepared with these techniques were amorphous, indicating sometimes the presence of micro-crystallites of carbon nitride. According to Matsumoto et al.,11 the comparison of experimental X-ray and electron
the nitrogen concentration in carbon nitride films has not been found to exceed a value of N/C = 0.83 (~45 at.%);3 however, films prepared by the IBAD technique
showed high nitrogen incorporation (N/C = 1.4-1.7).12
The present study reports the preparation of carbon nitride films on a Si (100) substrate by electron-beam evaporation of carbon with simultaneous bombardment by nitrogen ions, as a function of two process parameters: the ion energy and the ion-to-atom arrival rate ratio, R(I/A). The R(I/A) is defined as the ratio of the flux of incident ions in the ion beam relative to the flux of the evaporated carbon atoms transported to the substrate. The purpose of this study is to relate the lattice dynamics and the chemical composition of the films, which were investigated by means of Raman and Fourier transform infrared (IR) spectroscopy, and by elastic recoil detection analysis (ERDA), respectively, to the two process parameters.
Experimental
The IBAD system consists fundamentally of a Kaufman-type ion source (Ion Tech Inc.), an electron-beam evaporator and a quartz crystal monitor in a vacuum chamber evacuated by a cryo-pump and a turbo-molecular pump assisted by a mechanical pump. The base pressure in the vacuum chamber was below 4.6 × 10⁻⁴ Pa. 99.999%
pure graphite was evaporated by the electron-beam evaporator and the carbon vapor was deposited on a chemically cleaned Si (100) substrate maintained at 350 °C. The incident angle of the flow of evaporated carbon atoms was 45° and the deposition rate of carbon measured by the quartz crystal monitor was kept at 0.045 nm s-1. During the deposition of the film, the substrate
surface was perpendicularly exposed to the nitrogen ion beam from the ion source. The ion energy was 200, 400 or 600 eV. The working pressure in the vacuum chamber was kept at 1.6 × 10⁻² Pa.
The R(I/A) was calculated using the deposition rate of carbon atoms and the ion beam current density passed through a Faraday cup placed at the position of the substrate. Since a mass analyzer was not available for the vacuum chamber, the charge state distribution of ions was assumed to be 11% N+ and 89% N
2
+using the published
data.13,14 A part of these ions is expected to undergo charge
transfer collisions with neutral nitrogen gas along the beam trajectory of 41 cm from the exit of the ion source to the substrate, thus becoming neutral particles retaining the initial energy. Consequently, it was necessary to correct the beam current, as measured with an amperimeter, with the following generic equation I = Io exp(–3.54 × 10¹⁶
pσl),15,16 where I
o is the initial current of ions at the exit of
the ion source, I the final current at the position of the
substrate after passing through the distance l (cm) of nitrogen gas at pressure p (Torr), and σ (cm2) the
charge-transfer cross section, which is given in Reference 15, dependent on ion species and energy. Variation of R(I/A) was achieved by varying the ion beam current of nitrogen. Film thickness was determined with a surface profilometer (Sloan, Dektak 3030) and with X-ray reflectivity (XRR) measurements using an X-ray diffractometer (Rigaku, Rint 2100). The composition ratio N/C of the film was determined by the ERDA technique with 58 MeV Cl7+ ions impinging at an angle of 30° relative
to the film surface. IR and Raman spectra were measured
ex situ in a dry nitrogen gas atmosphere and at room temperature using a spectrometer (BIO-RAD, FTS-40) and another (Renishaw, Raman 2000) operating with an Ar+
laser excitation line of 514.5 nm, respectively.
Results and Discussion
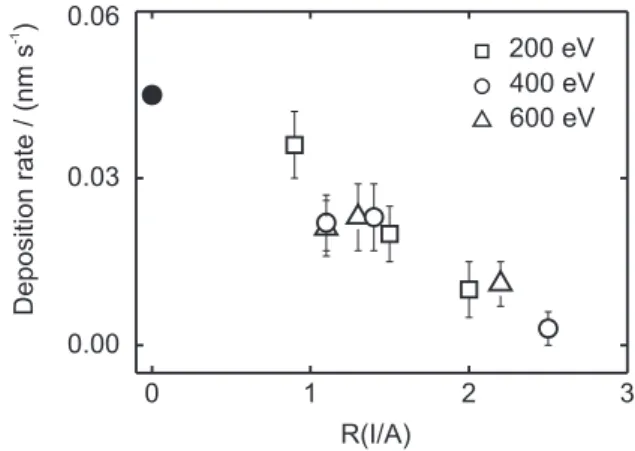
Figure 1 shows the deposition rate of the film obtained from the film thickness which was measured with the surface profilometer, divided by the deposition time for the film. This deposition rate decreases with increasing in R(I/A) for the three ion energies and a similar feature is observed for the results obtained using the XRR. Note in the figure that: (i) the experimental point at R(I/A) = 0 is for the film prepared without any ion irradiation and (ii) the thickness of the film prepared at 400 eV with R(I/A) = 2.5 was not detected in the surface profilometer nor XRR measurements. The Raman spectrum for this film observed, but its ERDA signal was too small to analyze.
Incident ions penetrate into the film and cause collision cascades of recoils by displacing bonded atoms of the film. These incident ions generally accumulate in a surface layer and can form volatile compounds with surface layer atoms. The formation of these compounds lower the
surface binding energy and they can be desorbed from the surface (chemical sputtering). Hammer and Baker6
observed with a quadrupole gas analyzer the production of volatile compounds, such as CN+, HCN+, C
2N2
+, during
the deposition process of carbon nitride films at 100 and 400 °C by the dual ion beam deposition technique with assisting nitrogen ion energies between 100-800 eV.6
Assuming that physical sputter is negligible owing to low ion energies, they estimated that the chemical sputtering yield Y(C/N), defined by the ratio of the number of sputtered carbon atoms to that of incident atomic nitrogen in the ion beam, is equal to 0.25 ± 0.05.6,8 The higher the
R(I/A), the stronger the formation rate of volatile CN compounds and, consequently, the film formation ceases. The data shown in Figure 1 are not yet adequate for investigation of the ion energy dependence of Y(C/N), and hence a mean critical value of R(I/A) at which the film formation begins to cease can be estimated to be equal to 0.21 in our case. The value estimated in this study for the Y(C/N) is in line with that obtained by Hammer and Gissler,8 implying that the contribution of physical
sputtering is small.
The composition ratio N/C in the film is depicted in Figure 2 as a function of R(I/A). From the figure N/C increase with the increase in R(I/A) for the three values of ion energy. The highest value of N/C = 0.9 (i.e. 47 at.% of nitrogen) was observed at R(I/A) = 1.4. It is observed from the figure that the films deposited with 400 eV always show the highest values of N/C in the films for a given value of R(I/A). A similar result was shown by Hammer and Baker6 without any their comment, that is,
the nitrogen concentration for the films deposited at 100 °C with 300 eV was twice higher than that for the films deposited at 100 °C with 800 eV for a given value of R(I/A).We suspect that chemical reactions between
physisorbed, chemisorbed, and backscattering species on the surface, which can lead to the formation of volatile compounds, should be dependent on ion energy. Note that the nitrogen concentration ranges for the films deposited with 200, 400, and 600 eV in this study are found to be 28-40, 17-37, and 37-47 at.%, respectively.
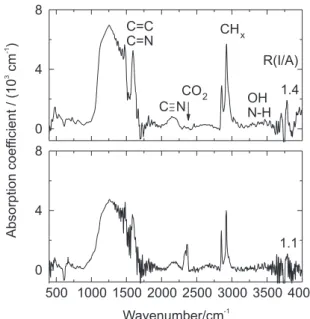
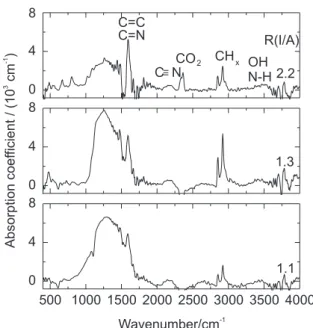
Figures 3 and 4 show the evolution of IR absorption spectra for the films prepared with 400 and 600 eV, respectively. There are five prominent features in the spectra: a broad band around 1000-1700 cm-1, two small
peaks at 2180 and 2360 cm-1, overlapping peaks around
2700-3000 cm-1, and small band at 3200-3600 cm-1. It is
known that all the features in the 1000-1700 cm-1 region
in carbon samples are due to skeletal C=C vibrations and this suggests that the 1000-1700 cm-1 band in this study is
attributed to C=C modes or mixed C=N modes.2,9
Regarding the 2180 cm-1 peak there is no doubt about the
origin of this peak to C≡N modes, which was confirmed
by 15N-14N isotopic substitution,9,17 and the 2360 cm-1
doublet peak is attributed to environmental CO2 gas.18 Two
principal peaks at 2850 cm-1 and 2920 cm-1 in the
overlapping peaks are due to sp3 CH
2 (asymmetric), and
sp3 CH and sp3 CH
2 (symmetric) vibrations, respectively,
and a very small peak observed at 2950 cm-1, to olefinic
sp2 CH
2 vibrations.
4,18,19 Alvarez et al.10 observed a peak at
3362 cm-1 in the 3200-3600 cm-1 region and attributed it
to stretching modes of N-H bonds in NH and NH2 configurations and to hydroxyl group OH which can be incorporated after exposing the films to air. The presence of the CHx band and the N-H and OH band means the contamination of hydrogen and oxygen in the films, no clear dependence on the ion energy and R(I/A) being
Figure 3. IR spectra of the films prepared with 400 eV.
observed. The origin of these elements should be residual gases in the vacuum chamber and/or atmospheric moisture due to the post-deposition exposure of the films to air. Unfortunately, it was impossible to detect hydrogen using our ERDA measurement setup and no oxygen signal was observed within the ERDA detection sensitivity.
The most obvious feature in our IR spectra is a peak at 1590 cm-1 which is well separated from the broad band
at lower wavenumbers. This sharp and intense peak, which has been exclusively observed in hydrogenated films,9
grows monotonously with increasing R(I/A), almost twice as the broad band, in contrast with spectra observed by Victoria et al.9 in hydrogenated films. However, 15N-14N
or H-D substitution showed that there are not significant shifts of wavenumber expected for the 1000-1700 cm-1
band if specific N-related or H-related modes were involved.2,9,17 The consensus is that the 1000-1700 cm-1
band is not predominantly due to nitrogen-containing modes. The increase of the 1590 cm-1 peak in intensity
with increasing R(I/A) can be attributed to the presence of the nitrogen causing other vibration modes to be IR active.2,9,17
Figure 5 shows normalized Raman spectra for the films deposited with 200 eV. Four characteristic features are observed in the spectra: a small band near 700 cm-1, a
square-topped band at 980 cm-1 due to Si-Si vibrations of
the underlying Si substrate, a broad and dominant band in the region of 900-2000 cm-1, and a weak one near 2220
cm-1 assigned to sp1-bonded C≡N configurations which
are expected for terminator groups. The assignment of the 700 cm-1 band is controversial. It is assigned sometimes
to sp3-carbon-related vibration,5 in-plane-rotation of
six-fold aromatic rings in graphite planes,19 or transverse optic
phonon induced by curvature of the graphitic planes in the nanoparticles (similar to carbon nano-onions).20 This
point will be discussed later.
The 900-2000 cm-1 band is decomposed into two peaks,
G and D peaks.2,7,19-21 The G peak located at 1500-1600
cm-1 originates from stretching vibrations (E
2g symmetry)
of any pair of sp2 sites in aromatic rings or olefinic chains.
The D peak near 1350 cm-1 arises from the breathing mode
(A1g symmetry) of sp2 sites in clusters of six-fold aromatic
rings.2,7,19-22 The D peak intensity is quite sensitive to the
cluster size and, as the cluster size increases, this intensity decreases with respect to that of the G peak. The spectra were analyzed by fitting a Breit-Wigner-Fano (BWF) function to the G peak and a Lorentzian to the D peak to estimate the peak parameters using a linear least-squares computer program, as showed in Figure 5. This fitting method has been widely used for quantitative analyses for the D and G peaks in the carbon structures. The BWF function is described by the following expression:7,19
(1)
with the maximum positioned given by
(2)
where I(k) is the intensity as a function of wavenumber k,
I0 is the peak intensity, k0, kmax and Γ are the mean peak position, the peak position at the maximum, and the full width at half maximum, respectively, and q is the BWF coupling coefficient. The position of the G peak is defined
Figure 5. Normalized Raman spectra of the films prepared with 200 eV.
by kmax and, in the limit q-1→ 0, the lorentzian function is
reproduced.
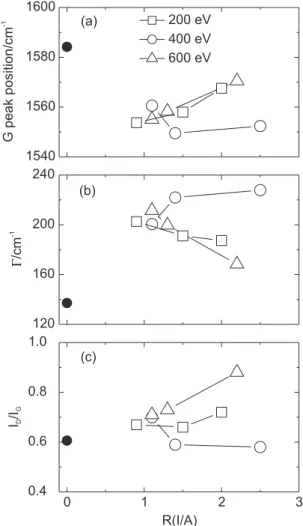
The peak parameters obtained such as the G peak position, the G peak width Γ, and the intensity ratio of
the D to G peak ID/IG are shown as function of R(I/A) in Figures 6(a)-6(c), respectively.
The films in this study were prepared from graphite evaporation. In order to explain our Raman spectra, we therefore use a phenomenological model relating the peak parameters to three stages of disordered carbon.2 The three
stages are as follows: (i) perfect graphite to nanocrystalline graphite; (ii) nanocrystalline graphite to sp2 amorphous
carbon (a-C); (iii) sp2 a-C to tetrahedral sp3 amorphous
carbon (ta-C, or diamond). Stage 1 corresponds to the progressive reduction in cluster size of ordered graphite layers, while keeping aromatic ring, and stage 2, to the disordering of graphite layers and loss of aromatic bonding, but keeping a purely sp2 network. In stage 3, the
sp3 content increases from zero to 100%, accompanying
the sp2 configuration change from mainly rings to short
chains.
On the other hand, nitrogen incorporation into a carbon network has the following effects on the aromatic clustering kinetics:7 (i) nitrogen incorporation changes the
bonding length compared with the pure carbon network; (ii) nitrogen enhances the ordering process in a highly disordered carbon network; (iii) nitrogen incorporation into the hexagonal aromatic ring induces corrugating or buckling the basal plane of the graphite with pentagonal rings (fullerene-like structure), promoting cross-linking between adjacent planes through sp3 carbon;23 (iv) nitrogen
acts as the terminating configuration and hinders the cluster growth.
According to the three-stage model, the film grown without any ion irradiation and all the films deposited with ion irradiation in the present study are considered, from the values of the G peak position and ID/IG ratio, to be at stage i and stage ii, respectively. On passing from stage i to ii, the disorder and aromaticity loss weakens the bonds through effect i above mentioned, causing the G peak to shift downward, and a larger variety of sp2 bond
length and angle distortions broadens the G peak.2,7,18,19,24
These explain the differences in vertical position between the film grown without irradiation and the others in Figures 6(a) and 6(b).
With increasing nitrogen incorporation into the films in stage ii, two completely different behaviors of the peak parameters can be seen in Figures 6(a)-6(c). The G peak for the films deposited with 200 and 600 eV shifts toward higher wavenumbers as R(I/A) increases, while that for the films grown with 400 eV moves down in energy and then slightly move up. Opposite behaviors on the variation of Γ can be identified. The I
D/IG ratio for the films
deposited with 200 and 600 eV has a tendency to increase and that for the films with 400 eV has a tendency to decrease.
The increase of the G peak position and the decrease of Γ observed for the films deposited with 200 and 600
eV as R(I/A) increases are attributed to the enhancement of the ordering process from amorphous carbon to nanocrystalline graphite (effect ii), i.e., the development of the clustering of the graphitic sp2 phase, followed by
an increase in the aromatic cluster size (i.e., an increase in ID/IG).18,24 This means that no consideration of effect iv
is necessary in this case. A similar behavior was observed by Abrasonis and Gago.7
In contrast the downshifts of the G peak position and ID/IG ratio, and the increase of Γ for the films deposited
with 400 eV with increasing R(I/A) may be related with higher nitrogen content in the films. It is known that further
nitrogen incorporation in the films enhances sp3
characteristic in the carbon bonds due to the nitrogen-induced formation of pentagonal rings (effect iii). Roy et al.20 attributed these two downshifts to this.
Effect iii is known to depend on the nitrogen content and deposition temperature. Hellgren et al.25 described
three distinct phases in which three different structures are formed according to the nitrogen content and deposition temperature: an amorphous phase is formed below 150 °C and, above 200 °C, graphite-like and fullerene-like phases are formed; the transition from the graphite-like to the fullerene-like phase is observed at transition concentration of nitrogen ranging from 5 to 15 at.%. Moreover, Santos and Alvarez26 revealed
theoretically that: the clusters are planar up to 17 at.% of nitrogen; above this concentration buckling develops in the clusters and some of the nitrogen atoms relax to positions at ~0.07 nm above and below the basic plane. This fact explains the decrease of the G peak position and the increase of Γ. Consequently, the dependence of the
peak parameters on R(I/A) can be reasonably explained, when the films grown with 200 and 600 eV (28-40 and 17-37 at.% of nitrogen, respectively) and those with 400 eV (37-47 at.%) are in the graphite-like and fullerene-like phases, respectively, in accordance of the phase diagram above mentioned with the transition concentration of ~40 at.%.
We consider here the possibility of the hydrogen contribution to the downshift of the G peak position. A higher sp3 content in hydrogenated sp2a-C is known to be
achieved mainly by hydrogen saturating C=C bonds as CHx groups, rather than by increasing the fraction of C–C bonds, as this a-C spreads from stage ii to iii. Thus, most sp3 sites are bonded to hydrogen, causing a downshift of
the G peak position and reducing the sp2 cluster size.
However, we discard this possibility because the 2700-3000 cm-1 peaks due to C-H stretching modes in carbon
sp2 and sp3 configurations appears in similar intensity for
the film deposited with 400 eV and R(I/A) = 1.4 and the films grown with 600 eV and R(I/A) = 1.3 (see Figure 3 and 4).
Finally, the assignment of the IR band in the range 1000-1700 cm-1 has been widely discussed, because of the
appearance similar between IR and Raman spectra. Some authors consider that nitrogen incorporation into the films causes the Raman G and D peaks to become IR active, due to the symmetry distortion of the sp2 ring modes giving
rise to a net dipole moment.17 On the contrary, some claim
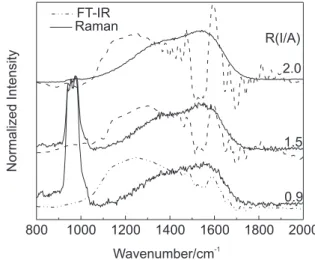
that the two spectra differ.2,9 Figure 7 compares the
normalized Raman and IR spectra observed for the films deposited with 200 eV, in which the D and G peaks and the
corresponding region of the IR spectra are fitted. We can conclude from the figure that the IR and Raman spectra are not equivalent because of the lack of coincidence between the two. On the other hand, the 700 cm-1 Raman
band appears unambiguously for the films grown with 200 and 600 eV as R(I/A) decreases (i.e. the intensity of the D peak increases), supporting its identification as the in-plane-rotation of six-fold aromatic rings in graphite planes.
Conclusions
The composition ratio N/C in the films was nearly proportional to R(I/A); however, the film growth is possible only if R(I/A) is smaller than a critical value of chemical sputtering yield. This mean value was estimated to be 0.21 which agreed very closely with the value early reported. The films deposited with 400 eV were found to show always the highest values of nitrogen content in the films for a given value of R(I/A) and the nitrogen content in our films reached a maximum of 47 at.%. This fact can imply that chemical sputtering may be dependent on ion energy.
The G peak position, G peak width, and ID/IG ratio determined from the analysis of the Raman spectra for the films showed two different behaviors dependent on the nitrogen content. This difference could be explained in the context of the structure phase of the films as follows. Below 40 at.% of the nitrogen content the films were in the graphitic phase and showed the development of the clustering of the graphitic sp2 phase as the nitrogen content
increases. On the other hand, increasing the nitrogen content e ≥ 40 at.% leads to the fullerene-like phase with
corrugated and buckled basal planes, promoting cross-linking between adjacent planes through sp3 carbon.
From the analysis of the IR spectra we believe few contribution of hydrogen to the behaviors of the peak
parameters. The 700 cm-1 Raman band was found to be
identified as the in-plane rotation of six-fold aromatic rings in graphite planes and comparison of the Raman and IR spectra allowed us to consider that the both are not equivalent.
Acknowledgments
The authors would like to acknowledge the helpful assistance of Dr. Manuel Espinoza, Instituto de Física, Universidade de São Paulo, and Dr. Nelson Ordenez, Escola Politécnica, Universidade São Paulo. We are grateful to Fundação de Amparo à Pesquisa do Estado de São Paulo (FAPESP) and Coordenação de Aperfeiçoamento de Pessoal de Nível Superior (CAPES) for the financial support and scholarship, respectively.
References
1. Liu, A. Y.; Cohen, M. L.; Phys. Rev. B: Condens. Matter Mater.
Phys. 1990, 41, 10727.
2. Ferrari, A. C.; Rodil, S. E.; Robertson, J.; Phys. Rev. B: Condens.
Matter Mater. Phys. 2003, 67, 155306.
3. Muhl, S.; Méndez, J. M.; Diamond Relat. Mater.1999, 8, 1809. 4. Dischler, B; Bubenzer, A; Koidl, P.; Solid State Commun.1983,
48, 105.
5. Kumar, S.; Tansley, T. L.; Thin Solid Films1995, 256, 44. 6. Hammer, P.; Baker, M. A.; Thin Solid Films1996, 290-291,
107.
7. Abrasonis, G.; Gago, R.; Phys. Rev. B: Condens. Matter Mater.
Phys. 2006, 73, 125427.
8. Hammer, P.; Gissler, W.; Diamond Relat. Mater.1996, 5, 1152. 9. Victoria, N. M.; Hammer, P.; dos Santos, M. C.; Alvarez, F.;
Phys. Rev. B: Condens. Matter Mater. Phys. 2000, 61, 1083.
10. Alvarez, F.; Victoria, N. M.; Hammer, P.; Freire, Jr. F. L.; dos Santos, M. C.; Appl. Phys. Lett. 1998, 73, 1065.
11. Matsumoto, S.; Xei, E. Q.; Izumi, F.; Diamond Relat. Mater.
1999, 8, 1175.
12. Chubaci, J. F. D.; Ogata, K.; Fujimoto, F.; Watanabe, S.; Biersack, J. P.; Nucl. Instrum. Methods Phys. Res., Sect B1996,
116, 452.
13. Vecthen, D. V.; Hubler, G. K.; Donovan, E. P.; Vacuum1986,
36, 841.
14. Smidt, F. A.; Int. Mater. Rev.1990, 35, 58.
15. Brown, S.C.; Basic Data of Plasma Physics, 1966, MIT Press: Cambrige, MA, 1967, p. 67.
16. Matsuoka, M.; Isotani, S.; Mittani, J. C. R.; Chubaci, J. F. C.; Ogata, K.; Kuratani, N.; J. Vac. Sci. Technol., A2005, 23, 137. 17. Kaufman, J. H.; Metin, S.; Saperstein, D. D.; Phys. Rev.1989,
39, 13053.
18. McCann, R.; Roy, S. S.; Papakonstantinou, P.; McLaughlin, J.
A.; J. Appl. Phys.2005, 97, Art. No. 073522.
19. Rodil, S. E.; Ferrari, A. C.; Robertson, J.; Milne, W. I.; J. Appl.
Phys.2001, 89, 5425.
20. Roy, D.; Chhowalla, M.; Hellgren, N.; Phys. Rev. B: Condens.
Matter Mater. Phys.2004, 70, Art. No. 035406.
21. Ferrari, A. C.; Robertson, J.; Phys. Rev. B: Condens. Matter
Mater. Phys. 2000, 61, 14095.
22. Tuintra, F.; Koenig, J. L.; J. Chem. Phys.1970, 53, 1126. 23. Sjöström, H.; Stafström, S.; Boman, M.; Sundgren, J. E.; Phys.
Rev. 1995, 75, 1336.
24. Kleinsorge, B.; Ferrari, A. C.; Robertson, J.; Milne, W. I.; J.
Appl. Phys.2000, 88, 1149.
25. Hellgren, N.; Johansson M. P.; Broitman, E.; Hultman, L.; Sundgren, J.; Phys. Rev.1999, 59, 5162.
26. Santos, M. C.; Alvarez, F.; Phys. Rev.1998, 58, 13918.
Received: March 15, 2006 Published on the web: October 5, 2006