THIS REPORT WAS PREPARED BY “STUDENT’S NAME”, A MASTERS IN FINANCE STUDENT OF THE NOVA SCHOOL OF BUSINESS AND ECONOMICS, EXCLUSIVELY FOR ACADEMIC PURPOSES.THIS REPORT WAS SUPERVISED BY ROSÁRIO ANDRÉ WHO REVIEWED THE
VALUATION METHODOLOGY AND THE FINANCIAL MODEL. (SEE DISCLOSURES AND DISCLAIMERS AT END OF DOCUMENT)
See more information at WWW.NOVASBE.PT Page 1/30
M
ASTERS IN
F
INANCE
E
QUITY
R
ESEARCH
Consumers’ affection for SUV didn’t cool down in 2015 and will extend to next two years whereas the whole vehicle market of China regressed to the slowing GDP growt h. Thanks to deep dedication to SUV segment (82% of total), the company achieved the sale target of 850k vehicles in 2015 with 21.5% revenue growth. But GWM’s SUV growth was below the industry average. Company’s net profit held on due to deterioration of margin rate. In Q1 2016, most of the models showed negative YoY growth apart from H1 and H6.
In 2015 the highest-end S UV H8 was eventually launched after several postponements but ended up with poor sale. The frequent price-off promotion propped up the double-digit growth but gross margin was hurt. The marketing strategy of “Blue-Red logo” would greatly enrich GWM’s product lines and enhance effectiveness of mark eting strategy. Also, the establishments of factory and sale branches oversea would bring to GWM more sources of income.
I hold bearish view on GWM’s future performance because:
(i)the price of upcoming SUV H7 is not friendly enough to become a hot sale model; (ii)the next generation of H6 might loss cost advantage given t he current price war; (iii)the fail of equity financing delays GWM’s entrance into NEV market.
Nevertheless, the current stock price of around 5.0x PER is the lowest among its peers and its history. I estimate a reasonable PER at 10.5x, justifying the “BUY” recommendation.
Company description
Located in Hebei province, the privately-owned company Great wall Motor is the 7th largest(2015 sale) automobile manufacturer in China
producing sedan, SUV, pickup and auto parts. It has been the No.1 in both SUV and pickup truck segment for consecutive 13 and 18 years respectively. In 2014, GWM established an auto financial company.
G
REATWALL
M
OTOR
(2333
HK)
C
OMPANY
R
EPORT
I
NDUSTRY
:
A
UTOMOBILE
5
M
AY2016
S
TUDENT
:
J
IASHENG
W
ANG
[email protected]
Outlook is not so dim
GWM is underpriced despite of no growth prospect
Recommendation: BUY
Price Target FY17: 11.29 HK$
Price (as of
4-May-2016) 5.88 HK$
52-week range (HK$) 4.96-18.57 Market Cap (HK$ m) 79,399 Outstanding Shares (m) 9,127
Source: Bloomberg and company f ile as of May 4, 2016
Source: Bloomberg (base date: Jan 2005)
(Values in
RMB millions) 2015 2016E 2017E 2018E Rev enues 76,033 80,943 89,560 94,568 Gross prof it 16,222 17,979 18,174 19,176 EBITDA 11,013 11,341 9,935 11,138 Net Prof it 8,060 7,767 6,377 7,220 EPS 0.88 0.85 0.70 0.79 EPS Growth 0.2% -4% -18% 13% P/E 8.6x 11 13 12 Pay out ratio 40% 40% 40% 40% DPS 0.35 0.34 0.28 0.31
GREATWALL MOTOR (2333 HK) COMPANY REPORT
PAGE 2/30
Table of Contents
VALUATION ... 4
DCF METHOD ... 4
MULTIPLES VALUATION ... 5
COMPANY OVERVIEW ... 6
VEHICLE BUSINESS MEETS PRICE CEILING... 6
FINANCIAL BUSINESS RAPIDLY GROWS... 7
DUAL-LISTING STRUCTURE ... 7
CHINA VEHICLE MARKET OVERVIEW ... 8
POLICY -PURCHASE TAX REDUCTION ... 8
POLICY -RESTRICTION TO V EHICLES PURCHASE IN BIG CITIES ... 9
Who are the next to be restricted? ... 11
LONG TERM FACTORS –MACRO PROFILE DIDN’T PREDICT WELL IN THE PAST BUT MIGHT DO BETTER IN FUTURE... 12
Motorization rate – rapidly growing but still at low level... 12
Population cliff at young age group hurts Chinese -brands.. 13
SHORT TERM FACTORS WITH UNCERTAIN EFFECTS... 14
Easing constraints on used cars mark et ... 14
The wave of vehicle replacement is coming ... 15
Car sharing service brings unc ertainty to vehicle mark et... 15
Credit purchase is prevailing among the youngsters... 15
SUMMARY OF CHINA’S GENERAL PC MARKET ... 16
SEGMENTS AND BRANDS OVERVIEW ... 17
A TRENDY FASHION OF SUV IN CHINA ... 17
SEDAN SEGMENT IS BEING CONQUERED BY JOINT-VENTURE ... 18
COMPETITORS AND PRODUCTS ANALYSIS ... 20
RAPID EXPANSION OF PRODUCTION CAPACITY... 20
UNBALANCED PRODUCT STRUCTURE OF GWM ... 22
Haval H6 k eeps competitiveness by cutting price ... 22
Haval H2 was unable to replicate the legend of H6 ... 24
Haval H1 will not bring us surprise... 25
Can Haval H7 become the hope of GWM?... 26
Pick up trucks segment would recover ... 26
NEV is the only hope to save GW M’s sedan segment ... 27
PROFITABILITY ANALYSIS ... 28
DETERIORATION OF PRICE AND GROSS MARGIN ... 28
GREATWALL MOTOR (2333 HK) COMPANY REPORT
PAGE 3/30
Executive summary
The policy of purchase tax reduction would stimulate low-emission vehicle
sale in 2016 although the effects are much milder than the same one in 2009. If this policy was not enacted, the year 2015 would have seen negative growth. But the segment of 1.6L vehicle which is the beneficiary of this policy has been saturated as this segment accounted for 70% of total vehicles sale in 2015.
The policy of restriction to vehicle purchase will be unfolded in more capital
cities. All tier-1 cities have carried out restriction to the number of vehicles in cities as traffic system is overloaded. Tier-1 cities used to have strong demonstrative effects for tier-2 capital cities. If the growth is not curbed, each tier-2 city will have an increment of 1 million vehicles in five years. So restriction is a highly likely event. Despite of rapid growth in the past, the motorization rate of China remains at
low level. Due to the one-child policy in the 1990s, the population of youngsters who are potential buyers to low-price vehicles reduces distinctly.
Excessive production capacity and overstock are weighing on all producers in China. But aggressive sale goals of Chinese-brands1 are still set to be double by
2020. Due to frustration with sedan segment, Chinese-brands crowd in SUV segment, making the average price of SUV slump for the past three years2.
The spring of pickup truck seems to come soon as the prohibition of pickup entering into cities is lifted. Actually, the pickup segment saw a slowing decline in 2015 and Q1 2016. Moreover, Chinese government starts to rule out small manufacturers, aiming to increase concentration. As the No.1 in pickup truck segment, GWM’s market share increased to 33% in Q1 2016.
The failure of equity financing was keeping GWM further from the peers in
NEV3 segment. Every manufacturer is ambitious for this area and is investing a lot
in production facilities and R&D. Compared to the public-owned opponents with abundant capital, GWM needs immediate external fund to fuel up NEV project. Outlook is tightly associated with the upcoming products. Apart from H1 and H6, other products of GWM saw negative YoY growth in Q1 2016. None of current product lines could mitigate GWM’s excessive reliance on H6. The mid-sized 7-seat SUV H7 launched in Apr 25, 2016 might have disappointed investors as the stock price fell by 12% on the same day. So the mere upside chance weighs on the next generation of H6 to be launched in the end of 2016.
1 Hereaf ter Chinese-brands mean the v ehicle brands as against the “Joint-v entures”
2 It is illustrated in Appendix “5.Dow nard price evolution of China’s PC in general” 3 NEV is short for New Energy Vehicle
The Q4 2015 right after this policy enforcement had YoY growth of 18% compared to that of 2.7% for last 3 quarters.
The past examples showed that the quota imposed by government would reduce 2/3 of new vehicle sale in Tier-1 cities.
By 2014, the motorization rate of China ranked at 91 out of 118 countries counted. The populations under 20-year-old are 25% less than the older age groups.
Stock of vehicles has been over the alert level for 15 months. Average price of SUV fell by 12% in 2015.
GWM’s market share of
pickup segment used to be less than 28%.
GWM announced to raise 1.2 billion yuan to fund for the NEV project in 2015 but then abandoned since stock price was much lower than intended issue price.
GREATWALL MOTOR (2333 HK) COMPANY REPORT
PAGE 4/30
Valuation
DCF method
I use DCF method to value two separate businesses of GWM, the vehicle business and the financial business. In the long-run, the total vehicle market would follow the slowing growth of China’s economy. Total annual sale are mainly constituted by vehicle replacement. Also, GWM’s market share does not see hope to increase. So I don’t expect perpetual growth of GWM.
I use 11.8% debt-free WACC for vehicle business in this model, based on the following assumptions: average US 10 year gov bond rate of 3.55% as proxy for risk-free rate; 10-year moving average return of MXWD(including emerging
economies) as proxy for expected market return calculated with SOP method1, say
10%; unlevered beta of 1.28 benchmarking against MXWD. MXWD is an appropriate proxy for the aggregate market considering the international shareholders structure of GWM’s H-Share. Regarding risk-free rate, using U.S. bond is sensible given two factors: nearly half of the investors are from the U.S., and; for the sake of consistency to the currency of MXWD index. Assumption of debt-free structure is also coherent to GWM’s history and management philosophy. Considering that the financial business of GWM is quite new and lack of comparable publicly-traded auto finance companies in China, I choose 12 traditional Chinese financial institutions listed in HK as peer group2. The WACC is 4.82% based on
such assumptions: D/E ratio of 2.3, levered beta of 0.99 and Rd of 3.5%.
With these assumptions, I obtain an equity value of RMB 61,792M as of year ended 2017, corresponding to HK$ 8.13 per share.
DCF Valuation Vehicle business Financial business
PV of FCFF ¥M 39,724 ¥M 3,727
PV of continuation value
discounted back to 2017 ¥M 34,815 ¥M 16,393
Net debt ¥M 0 ¥M 6,341
Equity value ¥M 74,539 ¥M 13,778
Total Equity value ¥M 88,318
#Outstanding shares(M) 9127
Estimated share price(RMB) ¥ 9.68
Exchange rate of HKD:RMB 85.676
Estimated share price(HK$) HK$ 11.29
1 SOP could better predict total market return. See in appendix “3.SOP method to estimate market return”. 2 See in appendix “4.Peering financial groups listed in HK”
GWM is listed both in mainland China and Hong Kong with totally different shareholders structure in two listing place. The shareholders structures will be discussed in next
section.
GREATWALL MOTOR (2333 HK) COMPANY REPORT
PAGE 5/30
Multiples valuation
GWM’s PER and PBR in the end of March 2016 hit the ever lowest for the last six years. It was rare to see price below 8.0x P/E, which indicates either price
underestimated or investors losing faith in GWM’s growth prospect.
When compared to peer group comprised of 7 Chinese-brand auto manufacturers listed in HK (Table 1), GWM is outstanding upon profitability as well as dividend yield although it underperforms the industry in terms of EPS growth and revenue growth. Actually, other opponents are not very comparable to GWM in terms of business risk. GWM, Wuling and BYD don’t have joint-ventures. But Wuling is mainly a minivan maker while BYD is the largest NEV and battery maker in China. The rest of opponents sourced income from joint-ventures several times more than their own business. But the PER of GWM is lower than both the peer group and its own track record. In my views, the stock price of GWM at least should not
underperform the Brilliance who had negative EPS and revenue growth as well as terrible profitability.
In the middle of 2015, GWM’s vehicle sale appeared negative YoY growth, accompanied with slumping PER. However, the positive performance for the first season of 2016 seemed not be able to recover investors’ faith. Considering dim growth prospect but strong profitability, I expect the range of PER from 10x to 11x, namely price around HK$11.
Figure 1 Evolution of PE and PB bands of GWM
Except for BYD and GWM, other producers have joint- ventures. The Revenue, Gross Margin and EBITDA in Table 1 reflect only their own business, excluding joint- venture performance. But the EPS includes the income from joint-ventures. So Brilliance could have strong ROE even though it has negative EBITDA.
GREATWALL MOTOR (2333 HK) COMPANY REPORT
PAGE 6/30 Table 1 Financials comparison to the peers listed in HK
Year ended 2015 Profitablility Earnings Dividend Price ratio
Revenue grow th(%)
Gross margin(%)
EBITDA
margin(%) EPS(HKD) EPS
grow th(%) ROE(%)
Gross DPS(HKD)
Dividend yield(%)
Dividend payout ratio(%)
PER PBR
Wuling 10.80% 11% 4% 0.05 42% 9% 0.00 1% 10% 11.7 1.0 Geely 38.60% 18% 14% 0.26 58% 12% 0.03 1% 10% 13.5 1.6 DongFeng 56.30% 13% 2% 1.34 -10% 15% 0.20 2% 15% 6.5 0.9 Brilliance -11.80% 4% -11% 0.70 -35% 19% 0.11 1% 16% 11.7 2.1 Qingling -5.10% 19% 12% 0.19 6% 6% 0.16 8% 84% 10.6 0.7 BYD 40.20% 15% 13% 1.12 522% 10% 0.05 0% 4% 31.9 2.7 GAC 31.50% 12% 5% 0.65 30% 11% 0.16 3% 25% 8.9 1.0 Average(ex. GWM) 22.93% 13% 6% 0.61 87% 12% 0.10 2% 23% 13.5 1.4
GWM 21.50% 22% 15% 1.08 0% 22% 0.43 5% 40% 8.6 1.8
GWM ranking 5 1 1 3 6 1 1 2 2 7 3
Source: Bloomberg and company report of GWM
Company overview
Vehicle business meets price ceiling
The GreatWall Motor commenced vehicle business in 1990s with pickup truck products. Then it engaged in SUV segment and sedan segment. GWM has secured the No.1 place in terms of sale in SUV and pickup segment for consecutive 13 and 18 years, respectively. GWM sold 750k units of PC1 and ranked 7th among all auto
groups in China in 2015 while the rest of top 8 were controlled by the state2.
In 2013, GWM split off the SUV business to establish a new professional SUV brand - Haval, while other vehicles still used GWM’s brand. In 2015, the SUV business contributed 82% sale to the group, of which 44% from the backbone product Haval H6. In the same year, GWM announced a “Blue-Red” marketing strategy for which each product line would have two derived versions branded with blue and red logo respectively to cater for different consumer groups. Red logo version is designed for home use while the fashionable blue logo version is for younger people. The sale network was reorganized in a corresponding way that those two versions are sold in separate network. By this way, GWM is able to improve the effectiveness of
marketing strategy, further differentiate potential customer groups, and better balance the resources allocated to different dealers.
Due to strong presence in SUV segment together with fine management, GWM’s gross margin was at the top of peer group but dropped for recent two years (Table 1). Among the comparable Chinese-brands peers, GWM’s products are identified as “premium” but its intention to migrate to high-end segment ended up with failure because the brand value of Chinese-brands are not adequate to justify premium price yet.
1PC is short for ‘Passenger Car’, equivalent to ‘Passenger Vehicle’ in this report. 2“6.Sale of top 10 auto groups in China in 2015 “ in appendix
The founder, Wei Jianjun,
holds 56% of GWM’s share
(A+H share). The rest of top 8 groups are controlled by the state. Namely, the primary shareholders are local government.
GREATWALL MOTOR (2333 HK) COMPANY REPORT
PAGE 7/30
Financial business rapidly grows
In 2014, GWM founded an auto financial subsidiary in Tianjin, providing auto financing services to GWM’s dealers and other customers. It made loss at first year but earned a 17% net profit margin in second year. Revenue of financial business increased by almost 9 times. According to Deloitte’s report in 2014, 54% of the automobile consumption credit is provided by banks while 24% by automobile financial companies. The penetration rate of automobile credit in 2015 was around 27%. Yet this 27% was shared by lots of competitors such as traditional banks, financial companies and Internet P2P. But currently traditional banks prevailed over others with 54% market share and auto finance company with 26%. The trend of credit consumption among the youngsters is swelling and as such I anticipate 50% penetration rate by 2023, as much as the neighbour country, Japan.
Dual-listing structure
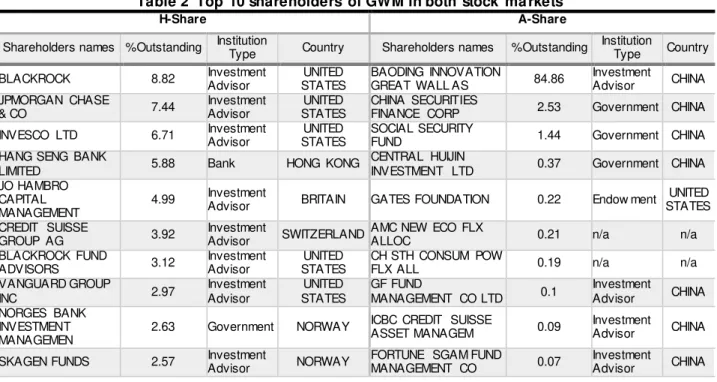
1GWM’s stock is listed in both Hong Kong (H-Share) and mainland China (A-Share) with proportion of 1:2. But the shareholder structures are completely different in these two exchange centres due to capital regulation in mainland China. Table 2 shows that 84.86% A-Share of GWM is held by Wei Jianjun, the founder of GWM and the owner of Baoding Innovation. Then followed by Chinese governments. By contrast, the H-Share of GWM is evenly held by international investors, of whom 47% are from the U.S. and 95% are institutional investors. As such, I am convinced that the specific risk of GWM is offset by their diversified investment portfolios.
Table 2 Top 10 shareholders of GWM in both stock ma rkets
H-Share A-Share
Shareholders names %Outstanding Institution
Type Country Shareholders names %Outstanding
Institution
Type Country BLACKROCK 8.82 Investment
Advisor
UNITED STATES
BAODING INNOVATION
GREAT WALL AS 84.86
Investment
Advisor CHINA JPMORGAN CHASE
& CO 7.44
Investment Advisor
UNITED STATES
CHINA SECURITIES
FINANCE CORP 2.53 Government CHINA INVESCO LTD 6.71 Investment
Advisor
UNITED STATES
SOCIAL SECURITY
FUND 1.44 Government CHINA
HANG SENG BANK
LIMITED 5.88 Bank HONG KONG
CENTRAL HUIJIN
INVESTMENT LTD 0.37 Government CHINA JO HAMBRO
CAPITAL MANAGEMENT
4.99 Investment
Advisor BRITAIN GATES FOUNDATION 0.22 Endow ment
UNITED STATES CREDIT SUISSE
GROUP AG 3.92
Investment
Advisor SWITZERLAND
AMC NEW ECO FLX
ALLOC 0.21 n/a n/a
BLACKROCK FUND
ADVISORS 3.12
Investment Advisor
UNITED STATES
CH STH CONSUM POW
FLX ALL 0.19 n/a n/a
VANGUARD GROUP
INC 2.97
Investment Advisor
UNITED STATES
GF FUND
MANAGEMENT CO LTD 0.1
Investment
Advisor CHINA NORGES BANK
INVESTMENT MANAGEMEN
2.63 Government NORWAY ICBC CREDIT SUISSE ASSET MANAGEM 0.09 Investment Advisor CHINA
SKAGEN FUNDS 2.57 Investment
Advisor NORWAY
FORTUNE SGAM FUND
MANAGEMENT CO 0.07
Investment
Advisor CHINA
1 See in appendix “8.Price differences of the dual-listed stocks”
GREATWALL MOTOR (2333 HK) COMPANY REPORT
PAGE 8/30 Source: Bloomberg
China vehicle market overview
This section will review some factors that will significantly affect China’s total passenger vehicle sale. Then the following section will be specific to two PC segments (Sedan and SUV) and two groups of brands. The final step would narrow down to GWM’s sale analysis.
Policy - Purchase tax reduction
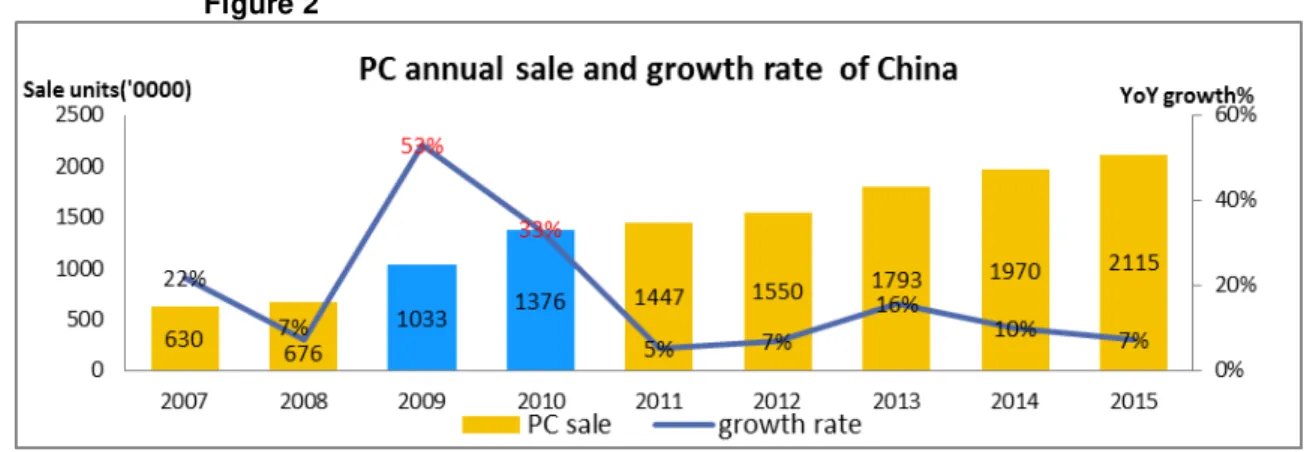
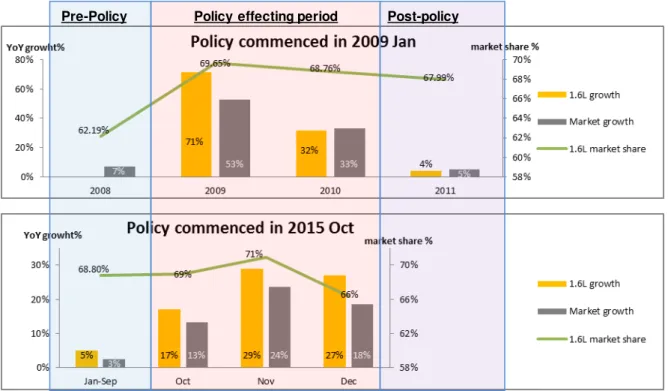
From Oct 1, 2015 till year ended 2016, the purchase tax of passenger cars of below 1.6L (includes 1.6L) reduced by 5%, which is equivalent to 5% discount on prices of eligible vehicles. By coincidence, a same policy was enforced in 2009 and 2010 just after the global financial crisis. Figure 2 compares the effects of both policies. In 2009, the below-1.6L cars grew by 71%, much faster than total PC market growth of 53%. More accurately, the PC market was mainly driven by the below-1.6L cars as its market share immediately rose from 62% to almost 70%. By contrast, the pre- and post-policy period only saw less than 7% annual growth, which distinctly displayed the strong driving effects of this policy. Perhaps this amazing record was partly owed to other policies in the same year. The fuel tax policy was enforced with which the road maintenance fee, road passage fee and transportation fee were replaced. Low emission cars gained more from the fees reduction than loss from fuel price increase.
In 2015, the same policy commenced at Q4, making a big difference in the end of the year. For the first 3 quarters, the below-1.6L growth was only 5% on YoY basis. But in Q4 it soon soared to 17%, driving the total PC market to grow by 13%
compared to 3% for the first 3 quarters. But the below-1.6L cars growth and total PC market growth slowed down in the Q1 2016, with 7.3% and 6.8 YoY growth
respectively. Figure 2
The policy made mythical growth record of China vehicle market during the global financial crisis period.
GREATWALL MOTOR (2333 HK) COMPANY REPORT
PAGE 9/30
Source: MIIT and CAAM
How will this tax policy affect PC market in 2016? We have to admit that the same policy may be less powerful in 2016 given two facts: VIU in China in 2016 has enhanced greatly from 2009, and; the age of rapid GDP growth has gone. In addition, the below-1.6L segment seems a little saturated as it took 71% of total PC sale in Q1 2016. By the way, according to 2009’s experience, this policy will overdraw the sale in 2017.
Policy - Restriction to vehicles purchase in big cities
By Dec 2014, Shenzhen became the 6th cities in China imposing restriction to
vehicle purchase as a result of traffic overload. The incremental number of vehicles is limited to a quota set by local government. But the current car owners are allowed to replace their cars with ones of equal or lower displacement. NEVs are less restricted. Table 3 lists the cities with vehicle restriction policy already.
Table 3 Cities already with vehicle restriction policy City
Enforcem ent date Annual Sale before
restriction(units) Quota(Units)
Shanghai 1994 N/A 100,000
Beijing 2010 Dec 917,045 240,000
Guangzhou 2012 Jul 330,000 120,000
Tianjin 2013 Dec 300,000 50,000
Hangzhou 2014 Dec 264,000 80,000
Shenzhen 2014 Dec 550,000 100,000
Source: Media
Pre-Policy Policy effecting period Post-policy
The remarkably stimulating effect of tax reduction in 2009 will not recur in 2016
GREATWALL MOTOR (2333 HK) COMPANY REPORT
PAGE 10/30 The enforcement of vehicle restriction policy in those cities shuffled the whole industry. According to a survey, annual vehicle sale in Beijing was cut by 56% immediately after policy enforcement1 because nobody was allowed to buy a
second car and many potential primary purchasers needed to wait for the quota. In Feb 2016, 665 people competed for one traditional car quota in Beijing because the quota has decreased to 90,000 units in 20162.
New cars sale in Beijing in 2014 was 541.5k units while the quota was 150k units3,
which implied 72% of new car sale was driven by replacement. The VIU of Beijing in 2013 was 5.2 million, which means 7.5% 4of vehicles are replaced in 2014. The
primary purchaser and replacement purchaser have distinct preference as follows: Table 4 Preference comparison of primary and replacement vehicle purchaser
% of choice Placement: 2.0L-3.0L Budget: above RMB 150k Type: SUV
Prim ary purchaser 11.4% 30% 17%
Replacem ent purchaser 42.9% 65% 29%
Source: State Information Centre
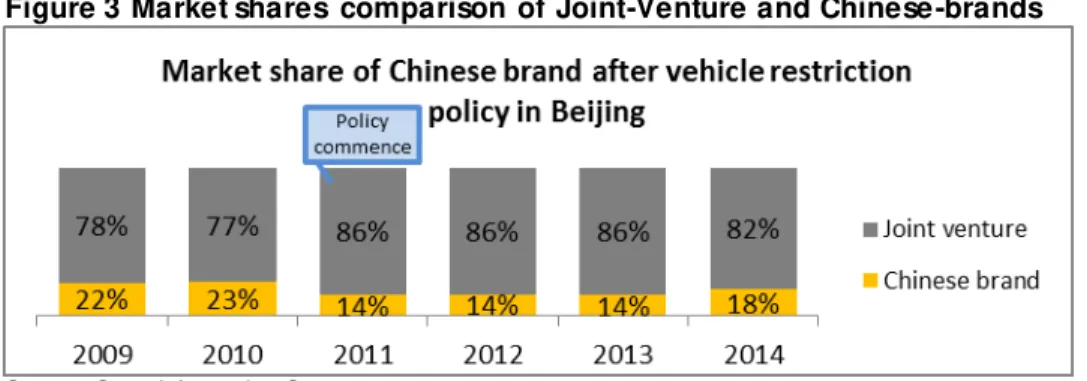
Judged on the information above, I am convinced that Chinese-brands are not potential choice for majority of replacement purchasers as they are usually low-placement (below 2.0L) and low-price(less than RMB150k). The report of State Information Centre (Figure3) certified this point as the market share of Chinese-brands in Beijing in 2011 dropped to 14% from 23%. Many dealers of Chinese – brands closed stores and exited, except for Changan and GWM5. Also, a survey on
Guangzhou draw similar conclusion that consumers would increase purchase budget by 20k to 50k yuan after the restriction policy enforcement because the cars replaced in future cannot exceed the current car’s displacement. Moreover, 11 stores closed in Guangzhou in the following year, of which 8 are Chinese-brands6.
Figure 3 Market shares comparison of Joint-Venture and Chinese-brands
Source: State Information Centre
1 http://auto.hexun.com/2012-01-20/137455404.html 2
The quota for traditional car is 90,000 and 54,000 for NEVs. Source: www.bjhjyd.gov.cn
3 Source: GOV announcement : http://zhengwu.beijing.gov.cn/tjxx/tjfx/t1378041.htm 4
7.5% = (541.5k- 150k) / 5200 k = amount of replacement in 2014 / VIU in 2013
5 Source: http://www.cada.cn/Trends/info_92_1910.html ; http://toutiao.com/a3612645637/ 6 Source: http://gzdaily.dayoo.com/html/2013-07/13/content_2317381.htm
GREATWALL MOTOR (2333 HK) COMPANY REPORT
PAGE 11/30 Brand loyalty also plays an important role in replacement decision process. Two Chinese-brands do well in this aspect, which are GWM and Changan. They ranked No.6 and No.7, followed by Toyota, regarding the ability to retain customers. But they cannot attract customers from other brands in vehicle replacement process. To sum up, the vehicle purchase restriction policy might cut local vehicle sale by half and the market shares of most Chinese-brands drop more although they were already quite low in those big cities before the policy. The effect of this policy on consumer choice is similar to the choice of replacement purchase, which is upgrading the budget. Despite of this fact, some Chinese-brands are survivals of this disaster as they have loyal customers and excellent products such as GWM and Changan.
Who are the next to be restricted?
What are the criteria underlying vehicle number restriction policy? I would say no absolute criteria are applicable to all cities because the conditions of different cities vary greatly. The classification of city territory has more political sense than practical sense such as Chongqing, which includes immense area of suburb. This makes it not comparable to Beijing in terms of road length when looking into the reasons for vehicle restriction. Since the reality is so complex, I estimate the possibilities of enforcement of vehicle restriction policy with a congestion index made of big data by a large map company. The ranks of congestion level are shown in order in Table 5.
Table 5 Profile of most congested cities
Congestion index rankings
Vehicle in
use(‘0000) road (km ) Length of Population(‘0000)
#Vehicles per 1000 residents
#Vehicles per km of road
Rushing hour delay index12
1.Beijing 532 21892 2152 247 24 2.056
2.Ji’nan 138 12846 707 195 11 2.039
3.Harbin 120 22534 987 122 5 1.989
4.Hangzhou 252 16024 889 283 16 1.984
5.Dalian 115 12454 594 194 9 1.907
6.Guangzhou 223 9219 1308 170 24 1.885
7.Shanghai 255 12945 2426 105 20 1.867
8.Shenzhen 311 1647 1078 288 189 1.863
9.Qingdao 132 16301 905 146 8 1.851
10.Chongqing 441 127392 2991 147 3 1.845
11.Kunm ing 153 17602 663 231 9 1.805
12.Wuhan 164 14520 1034 159 11 1.804
13.Zhengzhou 218 12209 938 232 18 1.803
14.Nanning 89 12800 730 122 7 1.785
15.Chengdu 336 22789 1443 233 15 1.767
16.Changsha 144 15830 731 197 9 1.765
17.Xi’an 180 13251 863 209 14 1.764
18.Hefei 98 17012 770 127 6 1.738
19.Fuzhou 223 12456 743 300 18 1.732
20.Tianjin 283 16549 1547 183 17 1.72
GREATWALL MOTOR (2333 HK) COMPANY REPORT
PAGE 12/30 Note: T he source of data is seen as “10.Data source of congested cities profile “in appendix
The compilation of this congestion index considers the average speed of traffic flows at rushing hours and ordinary hours in the downtowns of 45 big cities in China. The cities are ranked by delay index1. Beijing and Ji’nan spend traveling time on
road at rushing hours as double as at ordinary hours. But Ji’nan and Harbin are tier -3 cities with much lower Vehicles per 1000 residents and Vehicles per km of road than Beijing. When comparing the cities (Shenzhen, Guangzhou, Shanghai and Beijing) already with vehicle restriction policy, they are not common in t erms of these two dimensions of data, either. So the congestion index might be a simpler and more effective way to measure the possibilities of vehicle policy. Actually, the administrators of the cities above have clarified their attitude on vehicle restriction policy to the public because the citizens heard rumours about vehicle restriction. Ironically, the mayor of Shenzhen also made promise to the citizens but eventually it became the 6th cities in China imposing vehicle restriction policy.
In my views, Kunming, Zhengzhou, Chengdu, Xi’an and Fuzhou are more likely to be the next imposing vehicle restriction policy based on over 2 million Vehicles per 1000 residents and large amount of vehicles per km of road. The amount of new registered vehicles in those cities in 2014 was 228k, 370k, 506k, 292k, NA, respectively. If each of them grows at this speed, the vehicles owned per 1000 residents will exceed 300 in less than 5 year, which are much higher than any of the cities with vehicle restriction policy currently. I am convinced that the cities which are not municipality cannot sustain for such amount of vehicle in the city. So I anticipate that these cities will impose vehicle restriction one by one in next five years. If the amount of new registered vehicle is cut by half, then 150k units sale are lost annually on average.
Long term factors
–
Macro profile didn’t predict well in
the past but might do better in future
Motorization rate
2–
rapidly growing but still at low level
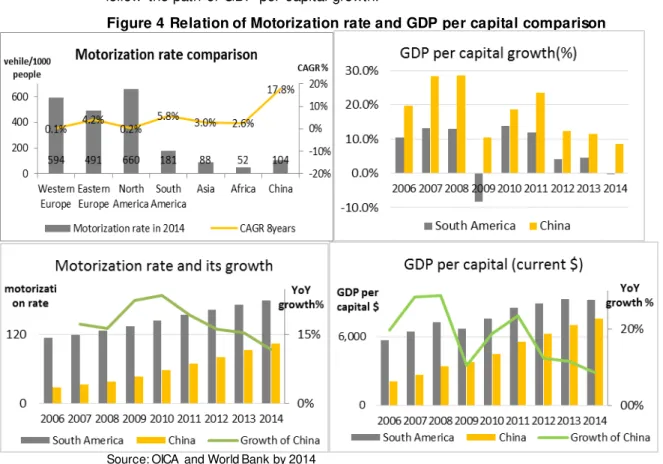
China’s motorization rate is among the lowest in the world (104 vehicles owned per 1000 residents in 2014), ironically contrasted to the title of second largest economy. Upon such level, the growth path of motorization rate of South America (Figure 4) might shed light on China’s vehicle market in next 8 years as the current
motorization rate of China is close to that of South America 10 years ago. Also, the GDP per capital of China as of 2014 was similar to that of South America 6 years ago. China’s current slowing GDP growth rate also finds similarity to South America
1 Delay index = Traveling time at rushing hours / Traveling time at ordinary hours 2 Number of vehicles ow ned per 1000 residents
China’s vehicle market is
too far from saturation which is evidenced by the cases of developed
GREATWALL MOTOR (2333 HK) COMPANY REPORT
PAGE 13/30 10 years ago. From 2011 to 2014, China’s motorization growth seemed to closely follow the path of GDP per capital growth.
Figure 4 Relation of Motorization rate and GDP per capital comparison
Source: OICA and World Bank by 2014
Population cliff at young age group hurts
Chinese-brands
The population of China has been stagnant for a long time thanks to the one-child policy. Although the latest policy allows some qualified people to have second child, the effect on demographic structure will only show up decade later. As such, new demand for vehicle would resort to the current change of demographic structure.
Figure 5 Proportions of different age groups
Source: Bureau of Statistics of China
When looking at the demographic structure (Figure 5) we would find a surprising contraction at the age of 20 by 25% compared to the older age groups. In the next 5 years the current 20-year-olds will make their primary purchase, which are mainly
The population of under-20 age group dramatically contracts. This group is more likely to buy low-price vehicle given their low purchase power.
GREATWALL MOTOR (2333 HK) COMPANY REPORT
PAGE 14/30 lower-price ones given their low purchase power. So Chinese-brand producers should be alert to this population cliff as they mainly sell low-price products to the youngsters.
Hence I expect a reducing demand for lower-price vehicle in next five years in terms of this population cliff merely.
Short term factors with uncertain effects
Besides the macro factors mentioned above, I also observe something shaping China’s auto market yet the impacts are not clear.
Easing constraints on used cars market
Used cars market was suppressed as 95% of local governments prohibited used cars immigrating into their cities because the used cars cannot meet the emission requirements of local cities. However, the stricter phase-V emission standard is only carried out in some big cities in 2016 but they kept out the used cars by this reason a few years ago. The Central Government in Feb 2016 mandated that local
governments should lift the prohibition on eligible used cars. This act will cause the cumulative stock of used cars to be released soon, making shock to new car sale. The transaction volume of used cars in 2015 was 9.4 million, that is 44% of new vehicle sale (Figure 6), much lower than 300% in the U.S. market. So I think the used cars transaction will continue the rapid growth in future.
Big cities like Beijing and Shanghai are largest sources of used cars while tier 3-4 cities are largest inflow destination. On one hand, the liquid used cars market would back the scrapped value of used cars, which ultimately encourages more frequent cars replacement in big cities. On the other hand, the main battle fields (tier 3-4 cities) of Chinese-brands will be eroded by the low-price used cars. According to CADA, the transaction volume of used cars ranging from 0 to 80k yuan, which is exactly the most concentrated price range of Chinese brands, accounts for 68% of total transactions in March 20161.
Figure 6 Used Transaction Volume and proportion to new car sale
Source: CADA
1 http://www.cada.cn/Data/info_86_5354.html Some bigger cities, like
GREATWALL MOTOR (2333 HK) COMPANY REPORT
PAGE 15/30
The wave of vehicle replacement is coming
Used cars market closely relates to the wave of vehicle replacement. According to WAYS report, replacement cycle of vehicles in China is 6-7 year on average. Back to 2009 and 2010 (Figure 2) when the unprecedented sale records of 103.3 and 137.6 million PC were created along with the fever for SUV, a large wave of replacement is going to occur in 2016 and 2017. Since the YoY growths for these two years were 53% and 33% respectively, the replacement demand for the
upcoming two years would also increase greatly. Thus more SUVs will appear in the used cars market, especially in the tier-2 to 4 cities market given the effect of easing of used cars circulation mentioned in last paragraph. Since the tier-2 to 4 cities are main battle field of Chinese-brands1, Chinese-brands’ SUV might be hit by this
wave.
By the way, several consumer surveys unanimously concluded that over 50% of vehicle owners would choose SUV as replacement choice. Chinese consumers tend to upgrade their budget for replacement choice so Joint-Venture SUV might hold high speed growth in next two years.
Car sharing service brings uncertainty to vehicle market
Represented by Uber and Lyft in the U.S., and DIDI in China, car sharing service is explosively growing. On one hand, it will weaken people’s desire for owning private vehicles. BCG estimated a loss of 550,000 new cars sale in the globe incurred by car sharing service by 2021. In China, the daily orders for car sharing service reached 630,000 in Dec 2015. Another survey by Magid Advisors said 22% of interviewees in the U.S. delayed new car purchase due to Uber’s service. On the other hand, low-price vehicle sale might benefit as some people are intending to buy economic cars to become full-time Uber drivers. In view of vehicle purchase
restriction policy together with the increasing usage cost of vehicles, car sharing service will certainly become a compromising solution for residents in big cities so the desire for owning vehicle will be partly marginalized. Paradoxically, this trend will currently impact neither the tier-1 cities nor the tier 2-3 cities as the immature car sharing service are not able to completely replace the desire of owing a car. So currently this trend will not significantly impact China’s vehicle sale, in my views.
Credit purchase is prevailing among the youngsters
The younger generation growing up in the age of Internet shows distinct perception of consumption from their parents who are inclined to cash purchase.
1 The reason could be seen in the discussion on the previous section Vehicle Purchase Restriction Policy. Compared to
Chinese-brands product in same class, Joint-Ventures brands are more expensive because the brand value of Chinese-brands is not built up yet.
GREATWALL MOTOR (2333 HK) COMPANY REPORT
PAGE 16/30 Affordability is the main setback for the 25-years-olds to purchase vehicle. Credit purchase would solve affordability problem for youngsters, probably making the average age of primary purchaser younger. As shown in Figure 5 in the previous section, the 20-24 year-old group accounts for 8% of the 1.4 billion populations, say 112 million. If the population of the 20-24 age group is evenly distributed, then each age level represents 22.4 million populations. If the credit purchase trend is able to drag down the average age of purchasers by 1 year, then the extra 22.4 million young people will be added to the list of potential buyers of the vehicle dealers. But credit purchase trend could not penetrate into young consumer group immediately. If it needs to take 4 years to drag down the average age of purchasers by 1 year, then the incremental sale contributed by credit purchase penetration is around 5.6 million (= 22.4milion / 4years) annually.
The penetration rate of vehicle credit purchase in developed countries are 50% for Japan, 65% for Germany and 84% for the U.S. respectively, while only 27% for China in 2015(Deloitte’s report). The CAGR of total asset of auto finance companies in China over 2007-2014 was 42%. With such rapid growth momentum, I expect the penetration rate would approach to the Asian neighbour, Japan, say 50%.
Summary of China’s general PC market
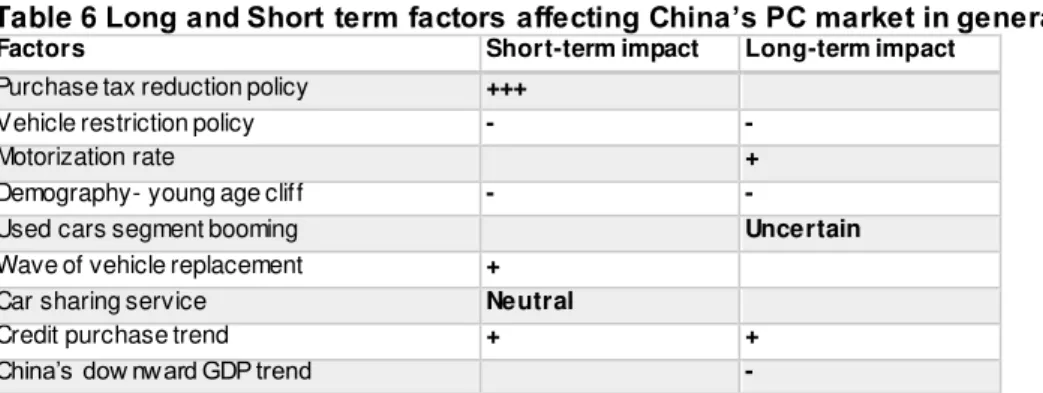
To sum up the factors impacting China’s total PC market, I list the effect of each factor in Table 6.
Table 6 Long and Short term factors affecting China’s PC market in general Factors Short-term impact Long-term impact Purchase tax reduction policy +++
Vehicle restriction policy - -
Motorization rate +
Demography- young age cliff - -
Used cars segment booming Uncertain
Wave of vehicle replacement + Car sharing service Neutral
Credit purchase trend + +
China’s dow nward GDP trend -
In general, I give higher expectation on the recent future than in long-run.
In the short-run, the downside risk comes from vehicle restriction policy which might bring 150k units loss annually. The upside risks are primarily the stimulating effect of purchase tax reduction and then the wave of vehicle replacement incurred by the crazy boom in 2009 and 2010. I anticipate that the effect of vehicle replacement would appear in slack season, say Q2 and Q3 because the replacement purchasers
Japan is a highly-developed society with more commons in culture with China than other western countries. Credit purchase behaviour is highly dependent on
cultural aspect. So Japan’s
penetration rate could give
GREATWALL MOTOR (2333 HK) COMPANY REPORT
PAGE 17/30 are more rational and not restricted to the vehicle quota1. Thus they could wait till
the slack season for lower prices2. So I expect higher growth rate than last year.
In the long-run, the motorization growth rate would follow the slowing GDP growth rate somehow as was shown for recent four years. Also, South America’s
motorization rate growth path (CAGR of 5.8%) gives hints on China’s but I would adjust China’s figure higher to offset the impact of global financial crisis on South America. The prosperity of auto finance industry will also give incentive to the young purchasers, more or less offsetting the negative impact of population cliff. Regarding the downside risk, vehicle restriction policy might not significant as it accounts for less than 1% of sale upon my assumptions.
Segments and brands overview
In this section, I only analyse two types of PCs , the SUV and sedan, as they are the main products of GWM. In terms of price range and consumers’ perception, vehicles could be classified in another way – Chinese-brand and Joint-Ventures brand. Foreign manufacturers are not allowed to produce in China unless they establish joint ventures with Chinese local auto group with share no more than 50%.
A trendy fashion of SUV in China
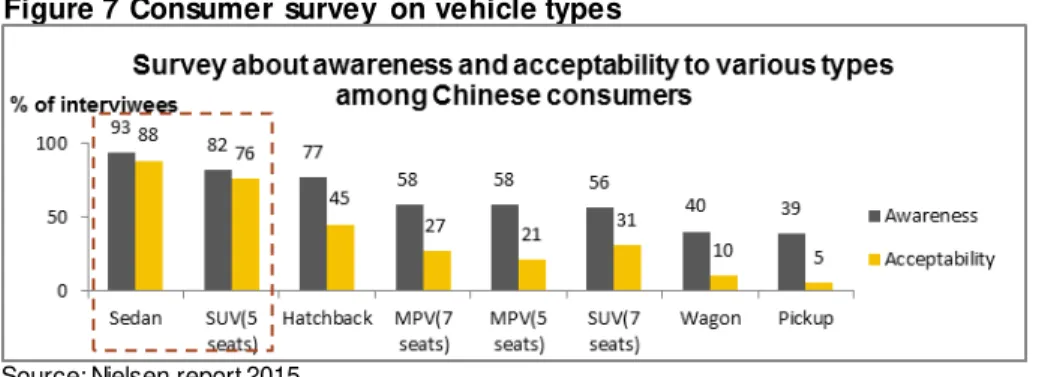
Different countries have different preference for vehicle types, e.g. wagon and hatchback for European, pickup for the American and Thailand, and minivan for Japan. Complex reasons underlie the variation of preference. In light of Nielsen’s consumer report in 2015(Figure 7), sedan remains the most aware and acceptable type of vehicle among Chinese consumers, then followed by SUV.
Figure 7 Consumer survey on vehicle types
Source: Nielsen report 2015
Notwithstanding, the golden period of sedan has gone. Sedan segment growth was below the market average since 2011 and was then negative in 2015 (Figure 9). By contrast, the market share of SUV soared from 13% to 31% for the past five years
1
Usually the primary purchasers buy the car after they get the quota from the lottery and auction process. But replacement pur chasers could buy the cars w henever they want.
2 The peak seasons are Q1 and Q4, more accurately, from October to January, just before the Spring Festival in Feburary. SUV segment has kept
GREATWALL MOTOR (2333 HK) COMPANY REPORT
PAGE 18/30 (Figure 8) with YoY growth of 52% in 2015. Particularly, Chinese brands benefit most from SUV segment where they had 79% (Industry is 52%) of sale growth last year and occupied 54% of SUV market against the Joint-Ventures. Due to loss in sedan segment, Chinese-brands almost bet on SUV segment. In 2016, 128 new models are to be released by Chinese brands, of which 51% are SUV1. When
looking at the light truck taking 57% market share in the U.S. and 59% of minicar in Japan, it makes sense to predict that SUV would take over 50% of total passenger vehicles sale in China ultimately (31% in 2015). This could be partly explained by cultural preference.
Figure 8 Proportions of various vehicle types in China
Sedan segment is being conquered by Joint-Venture
Joint-Ventures overinvested in production capacity in the past. The unexpected decay of sedan segment caused overstock pressure. Thereby Joint-Ventures brands reduced sedan prices, giving rise to domino effect on Chinese-brands. Take Honda as an example, the MSRP2 of Accord has reduced by 20% since 2007.
Along with disposable income increase, consumers upgraded their requirement for vehicles so they discarded the Chinese-brands that are considered low quality as well as low price. As a result, the market share of Chinese-brands in sedan segment dramatically slumped to 21% in 2015 (Figure 9).
Price war is sprawling over traditional sedan segment. Upon a wide range of observations, RMB 150k is a critical price ceiling to Chinese-brands vehicles because several bloody cases of Chinese-brands have shown that any attempt to break this boundary to compete with joint venture would end up with fail. That’s the reason why all of Chinese-brands are concentrating in the price range of RMB 60k to 150k. When analysing the sale list of top 40 models in 2015, we could find 13 Chinese brands, among which 12 have MSRP (lowest limit) lower than RMB 100k. The best-selling models of joint ventures spanned evenly across price ranges.
1 Source: http://auto.new s18a.com/news/storys_85514.html 2 MSRP is short for Manufacturer Suggested Retail Price While losing the sedan
market, Chinese-brands are gaining market shares in SUV and NEV segments.
In the past, Chery, Geely established separate brands to position at high-end segment but those brands
don’t exist now. GWM also
GREATWALL MOTOR (2333 HK) COMPANY REPORT
PAGE 19/30 Figure 9 Joint-Ventures v.s. Chinese-brands in sedan and SUV segments
26% 30% 31% 29% 28% 28%
22% 21%
-20% 0% 20% 40% 60%
2008 2009 2010 2011 2012 2013 2014 2015
Sedan market(by brands)
Source: CPCA, MIIT and Gasgoo
Where will the Chinese-brand lead to?
The issues affecting the SUV segment and the Chinese-brands discussed in the previous chapters are recapped in Table 7.
Table 7 Factors affecting vehicle types and brands in China
Factors SUV Sedan
Chinese JV Chinese JV Cultural and aesthetic preference ++ ++ - -
Price pressure from JV ---
New energy vehicle policy + - +++ - Vehicle restriction policy -- ++ --- - Lifting prohibition of used cars circulation -- - Wave of vehicle replacement + ++ -- -
Despite of frustration with traditional sedan segment, Chinese-brands’ general market share rose from 38% in 2014 to 41% in 2015, attributable to the several points. The first is consumers’ fever for SUV which made Chinese-brands hold 8 seats of top -10-selling SUV in Feb 2016. Then is followed by the trendy NEV supported greatly by government. The Chinese-brand regained market in tier-1 cities owing to NEVs (Figure 3). NEV sale is targeted at 2 million by 2020 by government, of which NEV sedan accounts for over half. The third good news comes from the supply side revolution mentioned in the 13th five year plan of
government in order to reduce waste of production capacity of the industry. The government planned to phase out small auto producers in order to make the big ones bigger. Last but not the least, Chinese-brands are hopefully reinforcing their position in tier 4-5 cities where 51% of vehicles are sold in 2015, increased by 3% from 2014, reported by Rolandberger. The vehicle sale within price range of RMB 80k to 120k accounted 49% of total vehicle sale in 2015 in contrast to 32% in 2014. The lower-tier cities are the fastest growing points in future.
But more downside risks are counteracting the bullish news to Chinese-brands. The first is policy of vehicle restriction, which could rule out 50% of market share of Chinese brands in the cases of Beijing and Tianjin. The second is the upcoming wave of vehicle replacement in tier 2-4 cities in which most consumers are inclined to upgrade their choices for Joint-Venture brands. Thirdly, the cumulative stock of used cars to be released in lower-tier cities in near future might do harm to
Chinese-The government only subsidise Chinese-brands’
NEV, and the subsidies take almost half of the NEV price, making it available for consumers. In 2015, 331k NEVs were sold in China. Chinese-brands are expected to hold 70% of NEV market by 2020.
GREATWALL MOTOR (2333 HK) COMPANY REPORT
PAGE 20/30 brand SUVs. In addition, given that Joint-Ventures have conquered the sedan segment with downward pricing strategy, I am concerned that the same approach will be applied to SUV segment in next few years.
To sum up, SUV will keep hot in next 3 years and might be able to grow to 50% of general PC market share. But Chinese-brands’ share in SUV segment will grow at first few years and then eroded by Joint-Ventures. Undoubtedly, Chinese-brands will carry on losing sedan market but the contracting momentum will be slower owing to the bullish NEV segment.
Competitors and products analysis
The 180 auto manufacturers in China could be divided in to two groups , Chinese-brands and Joint-Ventures, in line with consumer perception. No Chinese-brand is able to directly compete with Joint-Ventures yet. So GWM’s rivals are mainly Chinese-brands. Actually we could subdivide the Chinese-brands group into two – the ones with independent R&D capability and the ones only relying on imitation. Those who are able to price their cars above RMB 100k are main rivals to GWM such as Geely, Changan and GAC. All of them are going to launch complete product lines to compete with GWM in each SUV segments.
Rapid expansion of production capacity
Due to the downside of China’s economy growth, vehicle dealers in China are facing great pressure of stock. Suppose that the stock of PC, computed by production minus sale, started to accumulate since 2007, the cumulative stock increased to 600,000 units in 2015. Seeing the pressure of overstock, producers slowed down production in 2015, making a sale/production ratio of 100.3%. But the inventory level (Figure 10) still exceeded the alert level of 50% for a long time.
Figure 10 Vehicle stock in dealerships
Source: CADA (China Automobile Dealers Association)
Overstock pressure will lead to inadequate utilisation of production capacity.
According to the State Information Centre, the total production capacity in 2015 is at least 32.5 million units while the actual production volume was 21.08 million which means utilisation rate of production capacity is less than 65%. Usually the sale
GREATWALL MOTOR (2333 HK) COMPANY REPORT
PAGE 21/30 target has to ensure breakeven profit. So the inability to complete sale target might incur concern on profitability. Table 8 arranged by Gasgoo displays the completion rate of sale target of the main manufacturers. Only 9 of them complete their sale target, indicating that the rest of them might have overestimated market growth and thereby might have overinvested in production facilities.
Table 8 Sale target completion of main automobile manufacturers Rank Manufacturer Target
sale(‘0000units) 2015
Actual sale(‘0000units)
2015
Target completion rate(%)
1 Changan 75 93.8 125.1%
2 Geely 45 54.3 120.7%
3 GAC Motor 16 19 118.8%
4 JAC 30 34.6 115.3%
5 Honda-GAC 52 58 111.5%
6 Kia-Dongfeng 60 61.6 102.7%
7 Wuling-GM&SAIC 200 204 102.0%
8 Greatw all Motor 85 85.3 100.4%
9 Nissan-Dongfeng 100 100 100.0%
10 Toyota-FAW 61 60.7 99.5%
11 VW-SAIC 190 180.6 95.1%
12 Hyundai-BAIC 116 106.3 91.6%
13 GM-SAIC 190 172.5 90.8%
14 VW-FAW 185 165 89.2%
15 Citroen 80 70.5 88.1%
16 Ford-Changan 100 86.9 86.9%
17 Honda-Dongfeng 50 40.6 81.2%
18 Suzuki-Changan 21 12 57.1%
Source: Gasgoo
In this table, GWM’s main rivals1 have overused the capacity because demand over
supply. So they all have ambitious expansion plan in future. The current sale and production capacity of GWM are 850k and 950k, respectively, so the utilisation rate is 90%. The factory of GWM in Tianjin producing the star products -H6 and H2- has been utilised by 117% while the new factory in Xushui producing premium cars is utilised by 65.8% only. The second and third Xushui factory will be put into use in 2016 and 2017 consecutively, adding to production capacity by 200k units. Table 6 below shows the current and planned sale of some important Chinese-brand groups. In 2015, GAC, Geely and Changan were obviously limited by production capacity. But all of them have been expanding production capacity aggressively by constructing new factories. With more production capacity of the main rivals unleashing gradually in future, GWM’s market share will be eroded.
Table 9 Planned sale by 2020 v.s. sale by 2015 (0000 units) Planned Sale
(2020)
Market share(2020)
Current Sale(2015)
Market share (2015)
GAC Motor 100 8% 21 3%
Geely 100 8% 51 8%
BAIC 150 12% 66 10%
BYD 100 8% 32 5%
Dongfeng 100 8% 78 12%
Changan 150 12% 101 16%
Greatw all 115 9% 85 14%
SAIC 100 8% 17 3%
FAW 200 16% 38 6%
Chery 150 12% 48 8%
1 Hereafter the main rivals mean Changan, Geely and GAC. The data is collected from
the manufacturers’ 13th
five-year-plan announcement. Based on this planned sale,
GWM’s market share will
GREATWALL MOTOR (2333 HK) COMPANY REPORT
PAGE 22/30
JAC N/A N/A 35 6%
Brilliance N/A N/A 57 9%
Total 1265 100% 629 100%
Source: company announcement (not included new energy sale in 2020)
Unbalanced product structure of GWM
GWM commenced its business by producing pickup truck and then expanded t o SUV segment in early 2000s. Although the involvement in sedan segment in 2008 brought couples of years’ growth to GWM, this segment is shrinking recently. GWM is deemed as a leader in SUV segment among Chinese peers. So the management of GWM adopted a “Focus on SUV” strategy by concentrating the group’s resources to SUV segment to elevate competitiveness. Now GWM has the most complete product lines for each SUV segment compared to its rivals1. In 2015, SUV
contributed 82% to total sale volume of GWM (Figure 11). This strategy proves to be able to elevate resources utilisation rate and hence profit margin.
However, the company is excessively relying on two models. The pie charts (Figure 12) show that two SUV models, H6 and H2, were gaining importance to the group for recent two years and they took 85% of total sale in Feb 2016.
Figure 11 Proportional sale of various vehicle types of GWM
Figure 12 Proportions of various models to total sale
Source: Company annual reports and announcements
Haval H6
2keeps competitiveness by cutting price
Since its launch in 2011, H6 has secured the sale championship in SUV segment for consecutive 36 months with peak monthly sale of 46,057 units in Mar 2016.
1 See in appendix “7.GWM Product Lines Display”
GREATWALL MOTOR (2333 HK) COMPANY REPORT
PAGE 23/30 Majority of potential Chinese-brands customers are primary vehicle purchasers so they attach much value to the opinions of acquaintance. The long-lasting
championship title enables Haval H6 to capture this group of customers while no advertisement is needed. This was the success factor of H6 in the past.
But recently, the SUV segment had a lot of participants. The H6, CS75 and GS4 together accounted for 22.5% sale of all Chinese-brand SUVs in Feb 2016. As seen in Figure13, their movements are highly parallel, which means they are affected by common market shocks. Alternatively, they are comparable products for consumers. The earliest rival against H6 was Changan CS75, a product with spacious room and comparable power. Its outstanding design1soon caught consumers’ eyes. But
CS75’s production capacity was always short of demand.
The stronger rival, GAC GS4, came later but soon climbed up to top 2 SUV ranking list among all competitors in Apr 2016. GS4 is slightly smaller than H6 but has the best powertrain system among Chinese-brands balancing sufficient power and fuel efficiency. But the weakness GAC lies in its sale network, which is not paralleled to that of GWM and Changan in lower-tier cities. Also, like Changan CS75, the production capacity of GAC limits GS4’s growth.
Geely Boyue might be a nightmare to all Chinese-brands because it is spoken highly by all media as it represents the highest level of Chinese-brand SUV. As reported by Gasgoo, the orders for Boyue have exceeded 28k units before the price was announced. Geely spent 4 years and lots of resources on this product and thus made success in every aspect such as marketing, brand value, product quality. More importantly, it has a very competitive price. But again, production capacity and distribution network are the limitations to Geely. Geely is busy with integrating its distribution network and its brands, which might impede the sale in short -run.
Table 10 Haval H6 V.S. its rivals
Haval H6 Changan CS75 GAC GS4 Geely Boyue MSRP(0000 yuan) 8.88 -16.28 9.28 – 15.78 9.98 – 15.38 9.88-15.78 Dimension(mm) 4649*1852*1710 4650*1850*1695 4510*1852*1677 4519*1831*1694 Displacement(L) 1.3T/1.5T/2.0TDI 2.0L/1.8T 1.3T/1.5T 1.8T/2.0L
Pow er(kw) 110 116/130 101/112 135/104
Transmission 6AT/6MT 6MT/Tiptronic 5MT/7DCT 6AT/6MT Launch time 2011/2013(midter
m version)
Mar2014 May 2015 Apr 2016
Source: yiche.com
Feeling pressure from the strong rivals, GWM keeps competitiveness of H6 by two ways. The first is keeping novelty. GWM released a modified version of H6 in 2013 and then a whole new version H6 Coupe in 2015. The second is price reduction. Haval H6 did not reduce price in the past but did so frequently in recent year. The recent one in Apr 2016 is the strongest, with ca 12% discount on price. These
1CS75 w as designed by the team in Changan’s R&D centre in Europe. GWM excessively relies on
a single product-Haval H6, which is also one of the two products with positive growth in Q1 2016.
Annual production capacity of CS75 will reach 200k units in near future, announced by Changan.
Total production capacity of GAC could climb up to 350k units in the end of 2016. For Q1 2016, GS4 accounted for
over 90% of GAC’s group
sale. So the production capacity of GS4 is around 250k units in 2016.
Total production capacity of Boyue could reach 240k units but it could be only delivered to customers two months later. So the sale should be no more than 200k units.
GWM established it
GREATWALL MOTOR (2333 HK) COMPANY REPORT
PAGE 24/30 measures bear fruitful results as H6 contributed 56% to total sale of GWM and kept 50% YoY growth In Feb 2016. But price reduction will do great harm to company’s gross margin rate. In general, I believe Haval H6 will continue to lead the market with its strengths: mature distribution network and high performance-to-price ratio.
Figure 13 H6 and competitors sale evolutions
Source: leftlane.com
Haval H2 was unable to replicate the legend of H6
Unlike its brother H6, H2 is classified as small SUV in terms of dimensions. Due to the big success of H6, GWM transplanted the front face of H6 to H2 in order to ensure acceptability of H2’s exterior. GWM defines H2 as “Boutique SUV” with a higher price range than its Chinese-brand rivals of same class.
Table 11 Haval H2 V.S. its rivals
Haval H2 Changan CS35 JAC S3 Geely Emgrand GS MSRP(0000 yuan) 8.88–12.88 7.89-9.69 6.58-8.88 7.78-10.88 Dimension(mm) 4335*1814*1695 4160*1810*1670 4325*1765*1625 4440*1833*1560 Displacement(L) 1.5T 1.6L/1.5T 1.5L 1.8L/1.3T
Pow er(kw) 110 92/115 83 98 / 95
Transmission 6AT/6MT 5MT/Tiptronic 6MT/CVT 6MT/ 6DCT Launch time 2014 Jul 2012 Oct 2014 Aug 2016 May Source: yiche.com
Figure 14 H2 and competitors sale evolutions
Source: leftlane.com
Those three products in Figure 14 are top sale models of in the class of small SUV. The price and dimensions of H2 made its sale record embarrassed because the potential customers could have chosen the compact-class SUV such as Haval H6 and GAC GS4, or smaller-class SUV such as Changan CS35 and JAC S3. With
Midterm version launch
H6 Coupe launch
Official discount of 6000
Purchase tax cut half
The No.2 product of GWM family underperformed the
group’s expectation.
Perhaps the upcoming blue-logo version will make a difference.
The No.2 product of GWM family underperformed the
group’s expectation.
GREATWALL MOTOR (2333 HK) COMPANY REPORT
PAGE 25/30 richer configuration, better quality and larger dimensions, H2 actually targets at a niche segment differentiating itself from both other cheaper Chinese-brands and the expensive Joint-Ventures. So H2’s sale movement was not paralleled with its rivals shown in Figure 14.
But the upcoming Geely Emgrand GS might mainly aim at Haval H2 as it has l arger dimensions, nicer design and lower price. Emgrand GS also identified itself as “Boutique SUV”, aiming at the young consumers group exactly the same as H2. But annual production capacity of Emgrand GS is limited at 100k units while H2 has sufficient production capacity as GWM assigned part of production of H2 to the Xushui factory.
Again, GWM used the same measures to maintain H2’s competitiveness. The MSRP of H2 is reduced by 10k yuan in May 2016, ca 10% reduction. Moreover, a “Blue-logo” version of H2 is going to release to the market in 2016 to increase the novelty of product. Given the -6.4% YoY growth of H2 for Q1 2016, I conservatively anticipate that H2 could hold the same sale as last year.
Haval H1 will not bring us surprise
As the smallest-sized SUV, H1 ranks the 3rd in GWM family with 9% contribution to total sale of GWM. The price range of H1 (see in Table 12) puts it in the fiercest field where lots of inferior Chinese-brands concentrate in price range of RMB 50k to 100k. For the consumers in this price range, price is superior. Baojun is a typical example of price killer. This manufacturer used to produce low-priced minivans and then derived a compact SUV priced from RMB 70k to 90k with large dimensions paralleled to Haval H6. The sale of soon climbed up to the 3rd of all SUV in China, over 22k units per month. The gross margin rate of this manufacturer in 2015 was 11% in contrast to 22% of GWM (Table 1).
Compared to the rivals, Haval H1 doesn’t have advantage in price and powertrain and has a very small dimension. So H1 differentiates at the design targeting at young people who adore fashionable things. But a new rival, CS15 of Changan, seems to do better in this respect as it allows people to customise the colour of exterior and interior, addressing the very characteristics of young consumers. Since the competitors are so much in this range that none can affect this segment, I think H1 is not exposed to significant upside or downside risks. So I maintain the forecast sale volume to current level.
Table 12 Haval H1 V.S. its rivals
Haval H1 Changan CS15 JAC S2 BAIC X25 MSRP(0000 yuan) 5.49-8.29 5.79-7.39 5.88-7.68 5.58-7.58 Dimension(mm) 3995*1728*1617 4100*1740*1635 4135*1750*1550 4110*1750*1545 Displacement(L) 1.5L 1.5L 1.5L 1.5L/1.3T
Pow er(kw) 78 78 83 85
Transmission 5MT/6AMT 5MT 5MT/CVT 5MT/ 4AT