“
Bicycles May Use Full Lane
”
Signage
Communicates U.S. Roadway Rules and
Increases Perception of Safety
George Hess*☯, M. Nils Peterson☯
Department of Forestry & Environmental Resources, NC State University, Raleigh, North Carolina, United States of America
☯These authors contributed equally to this work. *[email protected]
Abstract
Many global challenges, including obesity, health care costs, and climate change, could be addressed in part by increasing the use of bicycles for transportation. Concern about the safety of bicycling on roadways is frequently cited as a deterrent to increasing bicycle use in the USA. The use of effective signage along roadways might help alleviate these concerns by increasing knowledge about the rights and duties of bicyclists and motorists, ideally reducing crashes. We administered a web-based survey, using Twitter for recruitment, to examine how well three US traffic control devices communicated the message that bicy-clists are permitted in the center of the travel lane and do not have to“get out of the way”to allow motorists to pass without changing lanes:“Bicycles May Use Full Lane”and“Share the Road”signage, and Shared Lane Markings on the pavement. Each was compared to an unsigned roadway. We also asked respondents whether it was safe for a bicyclist to occupy the center of the travel lane.“Bicycles May Use Full Lane”signage was the most consis-tently comprehended device for communicating the message that bicyclists may occupy the travel lane and also increased perceptions of safety.“Share the Road”signage did not increase comprehension or perceptions of safety. Shared Lane Markings fell somewhere between.“Bicycles May Use Full Lane”signage showed notable increases in comprehen-sion among novice bicyclists and private motor vehicle commuters, critical target audiences for efforts to promote bicycling in the USA. Although limited in scope, our survey results are indicative and suggest that Departments of Transportation consider replacing“Share the Road”with“Bicycles May Use Full Lane”signage, possibly combined with Shared Lane Markings, if the intent is to increase awareness of roadway rights and responsibilities. Fur-ther evaluation through virtual reality simulations and on-road experiments is merited.
OPEN ACCESS
Citation:Hess G, Peterson MN (2015)“Bicycles May Use Full Lane”Signage Communicates U.S. Roadway Rules and Increases Perception of Safety. PLoS ONE 10(8): e0136973. doi:10.1371/journal. pone.0136973
Editor:Jake Olivier, University of New South Wales, AUSTRALIA
Received:January 28, 2015
Accepted:August 11, 2015
Published:August 28, 2015
Copyright:© 2015 Hess, Peterson. This is an open access article distributed under the terms of the
Creative Commons Attribution License, which permits unrestricted use, distribution, and reproduction in any medium, provided the original author and source are credited.
Data Availability Statement:All relevant data are withing the paper and its Supporting Information files.
Funding:No external funding supported this work.
Competing Interests:The authors have declared
Introduction
Many of the greatest challenges facing humanity globally can be addressed, in part, by bicycling.
This statement may seem like exaggeration, but under scrutiny may be an understatement [1]. For instance, obesity is tied to car dependency in the United States and linked to the first lifespan decline in 200 years for people living there [2–3]. Cyclists are healthier and spend less time and money on medical care than other commuters [4]. Bicycling can promote mobility, particularly for the poor and elderly who often live in landscapes with amenities too dispersed for pedestrian access and cannot afford personal motor vehicle travel [5]. Replacing a car with a bicycle is, by a large margin, the single most important change a person can make to reduce their contributions to climate change [5–6]. Finally, because average Americans spend 15.6% of their income on motor vehicle driving, riding bicycles could have a large, positive effect on economic welfare and overall quality of life [5,7].
Why hasn’t this incredibly simple solution to so many problems been more broadly adopted, particularly in the United States? The reasons are complex and intertwined, including lack of access or desire to bicycle, roadways designed primarily for motor vehicle traffic, unpleasant weather, route, and light conditions, the need to carry bulky or heavy loads, and safety concerns [1,8–9]. In this article, we focus on safety concerns.
Most US cities have horrible bicycle safety records, with mortality rates about double those in other developed nations and injury rates between eight and 30 times higher [10]. Perceptions of unsafe conditions for bicycling are cited as an important deterrent to initiating or increasing bicycle use in many studies [8–9,11–12]. In a survey of Texas bicyclists, for example, Sener and others found that 69% felt bicycling was somewhat or very dangerous from the perspective of potential traffic crashes [13]. In particular, motorists driving too close (40%) or too fast (32%) were the most frequently reported dangers among the 11% of bicyclists who felt threatened by motorists [8,12].
Research consistently demonstrates that some infrastructure promotes safety, including traffic calming features, using separate bicycle paths, or placing barriers between motor vehicle and bicycle traffic [14]. Bicyclists in the US will invariably have to share roadway travel lanes with motor vehicles, however, because most roadways do not have bicycle-specific infrastruc-ture. In fact, Royal and Muller-Steiger reported that 61% of US bicycle trips were made on paved roads (including their shoulders) without such infrastructure [8]. The lanes on most US roadways are too narrow for motorists to pass bicyclists within the same lane.
A 4.27m (14ft) travel lane is generally recognized as the narrowest in which motorists can pass bicyclists within the same lane, with 4.57–4.88m (15–16ft) needed where speeds, overall traffic volume, or large truck traffic volume are higher (Fig 1) [15–17]. US roadways typically have narrower travel lanes, stripped between 3.05–3.66m (10–12ft) in width, requiring motor-ists to move fully or partially into the adjacent lane to lawfully pass a bicyclist. Numerous bicy-cle safety education programs teach bicyclists that riding near the edge of typical roadways encourages unlawful, too-close passing and that they should ride near the center of the travel lane to encourage motorists to change lanes before passing [18–19]. This engenders resentment among motorists who must wait behind slow-moving bicycle traffic, and close passes, harass-ment, and fear of overtaking collisions among bicyclists, particularly those with inadequate skills and knowledge of bicycling in traffic; bicyclists have also reported a pattern of harassment by motorists and some police when practicing this technique [20].
knowledge of the rights of bicyclists on roadways, help motorists recognize the need to change lanes when passing bicyclists, support the practice of bicyclists using the full travel lane under conditions where motorists cannot pass bicyclists within the lane, and reduce the number of crashes. Put plainly, they would communicate the message that bicyclists are permitted in the travel lane and do not have to“get out of the way”to allow motorists to pass without changing lanes. We examined the potential of three traffic control devices to attain these goals on US roadways:“Share the Road,” “Bicycles May Use Full Lane,”and Shared Lane Markings [21].
Traffic Control Devices for Bicycles as Vehicles
Bicycles are classified or treated as vehicles in all 50 US states, which means that bicyclists have most of the same legal operating rights and responsibilities as motorists, including the right to occupy a full travel lane [22]. North Carolina’s Driver Manual states this unambiguously: “Bicyclists usually ride on the right side of the lane, but are entitled to use of a full lane”[23]. In many states, so-called“far-to-right”laws specifically require bicyclists to drive as far to the right as practicable. Yet, even in those states bicyclists ultimately have the right to use the full lane when, at their discretion, driving far-to-right is not practicable. Florida’s Driver Manual, for example, notes that“A bicyclist may use the full lane even while traveling substantially below the speed of traffic if the lane is too narrow for a car to safely pass a bicycle within the lane”[24].
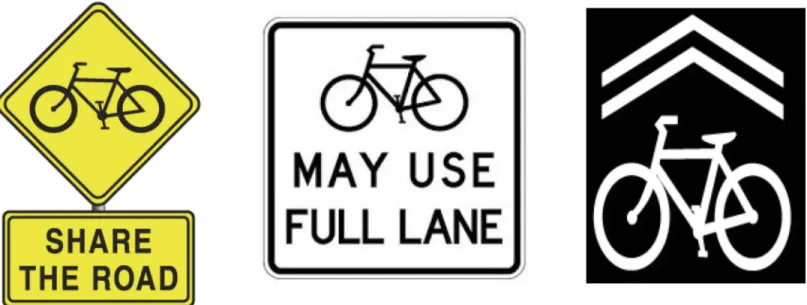
The right of bicyclists to use a full travel lane is not well-recognized by motorists or bicy-clists, which contributes to safety concerns and creates social friction among them [25]. State Departments of Transportation have used three traffic control devices in attempts to commu-nicate the right of bicyclists to use roadways, most commonly“Share the Road”signage and, more recently,“Bicycles May Use Full Lane”signage and Shared Lane Markings, also called “sharrows,”on the roadway pavement (Fig 2) [21]. The two-plaque“Share the Road”signage was designed to warn motorists that slow-moving vehicles–in this case bicycles–may be on the roadway [21]. Many State Departments of Transportation also declare that it is intended to remind motorists that bicyclists have a legal right to use roadways, though it was not designed for that purpose [26].“Bicycles May Use Full Lane”signage is intended to remind roadway users that bicyclists might be in the travel lane and have a legal right to occupy the full lane.
Fig 1. Geometry of lawfully passing a bicyclist.Depiction of two common US motor vehicles (typical sedan on the left, pickup truck/sport utility vehicle on
the right), 0.91m (3ft) minimum lateral passing distance required in most states (red dashed line), and typical 1.22m (4ft) operating space for bicyclists. The resultant total width does not include any“shy distance,”typically 0.46m (1.5ft) that motorists and bicyclists keep away from hazardous objects, between the motor vehicle and the lane marking to its left, or between the bicyclist and the edge of the road.
Shared Lane Markings on roadway pavement are intended to suggest appropriate lane posi-tioning for bicyclists, alert other roadway users that bicyclists may be present within the travel lane, and encourage safe passing of bicyclists by motorists.
Basic design principles provide guidance for hypotheses regarding traffic control devices, which must be clearly legible and quickly comprehended [21,27]. Our focus is on comprehen-sion, which for signage in general emerges from“guessability,”learnability, and experienced user performance [28]. Comprehensible traffic signs are concrete (visually obvious, not abstract) and simple (few elements and little detail), which make them meaningful; they also have low semantic distance (closeness between what is depicted and what it is intended to rep-resent; for example, a picture of a bicycle to suggest bicycles ahead has a lower semantic dis-tance than the use of a triangle to suggest a hazard) and are familiar (frequently encountered) [29]. Effective signs should be comprehensible, unambiguous, precise [30], and“convey a clear, simple meaning”[21].
Comprehension of the familiar“Share the Road”signage as a statement of bicyclists’ road-way rights has been challenged, based on arguments that it is ambiguous, imprecise, frequently misinterpreted, and not designed for that purpose [31–32]. Although often described as a reminder to motorists that bicyclists may use the travel lane [26], bicyclists frequently com-plain that motorists interpret the sign to mean that they should get out of the way. In fact, the US state of Delaware discontinued use of the“Share the Road”plaque in November, 2013, because“Some believe the plaque puts more onus on the bicyclist to share the road than the motorist”[33]. Those challenging“Share the Road”signage often call for the use of“Bicycles May Use Full Lane”instead, because it is an unambiguous, precise statement of law [32]. Shared Lane Markings are intended to show bicyclists the best place to ride and remind motor-ists that bicyclmotor-ists are permitted in the travel lane [21], but may be somewhat ambiguous and imprecise in communicating that message.
Evaluations of the comprehensibility of“Share the Road”and“Bicycles May Use Full Lane” signage in the USA are few and have produced conflicting results, in part because roadway con-ditions introduce confounding factors (S1 Text). Studies of Shared Lane Markings are more common, also have conflicting results, and have been subject to criticism for drawing positive
Fig 2. Bicycle-related traffic control devices.From left to right,“Share the Road”(Manual on Uniform Traffic Control Devices W11-1 upper plaque plus
W16-1 lower) and“Bicycles May Use Full Lane”(R4-11) signage; Shared Lane Markings (sharrows) are painted on the roadway pavement [21].
conclusions from the evaluation of improperly placed markings or using inappropriate metrics of success.
Objective
Our contribution to the literature is a straightforward evaluation of the comprehensibility of three traffic control devices:“Share the Road”and“Bicycles May Use Full Lane”signage and Shared Lane Markings. We evaluated whether any of these devices increased awareness among roadway users, relative to a control situation with no traffic control devices, that bicyclists are permitted to occupy the full travel lane and that motorists should wait to pass only after mov-ing into the adjacent lane. Secondarily, we evaluated perceptions of safety in response to each traffic control device and with no device.
We chose to evaluate these traffic control devices based on design principles and pragmatic grounds. Pragmatically, these are the four most common situations faced by US cyclists. From the perspective of design principles, although“Share the Road”signage is the most familiar, we hypothesized it would not increase comprehension, relative to an unsigned roadway, of bicy-clists’right to use the travel lane because of its high semantic distance and ambiguous, impre-cise message. We hypothesized that“Bicycles May Use Full Lane”signage would increase comprehension because it is meaningful, unambiguous, precise, and has low semantic distance; and that Shared Lane Markings would somewhat increase comprehension because the mark-ings are concrete, but ambiguous and imprecise with medium semantic distance. Our hypothe-ses and expectations were rooted in previous research suggesting semantic distance was more important than familiarity in terms of eliciting correct interpretation of signs and sym-bols [34–35].
Methods
We used a web-based survey to examine the comprehensibility of three traffic control devices on roadways relative to unsigned roadways using unambiguous scenarios and simple ques-tions. Comprehensibility was measured by the degree to which the device increased, when compared to no device, respondent recognition of the right of bicyclists to occupy the full travel lane and the duty of motorists to move into the adjacent lane to pass.
Survey Recruitment
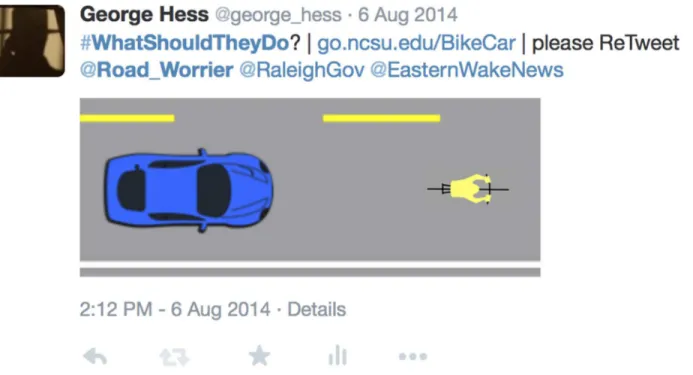
We conducted a web-based survey using a convenience sample of respondents recruited through a series of tweets–short messages sent through Twitter (twitter.com), a social media tool (Fig 3). Tweets were originated in waves by Twitter user@george_hessand directed to (“mentioned,”in the language of Twitter) other Twitter users with an interest in automobiles, bicycles, highway safety, and mass transportation, and using several different hashtags (key-words preceded by #) representing the same interests. Recipients were asked to retweet widely, to further spread our request for survey respondents. In a few cases, Hess contacted Twitter users by electronic mail to explain the survey and ask them to retweet. Our questionnaire was designed to be completed on computers, tablets, and mobile phones in well under 5 minutes.
Ethics Statement
Our survey protocol was reviewed and approved by the NC State University Institutional Review Board for the Protection of Human Subject in Research (Study #4070) during June, 2014.
Questionnaire Design
In our questionnaire, respondents were asked to evaluate two traffic situations involving motor vehicles and a bicycle: a two-lane and a four-lane roadway. The situations each depicted a motorist behind a bicyclist riding in the center of the travel lane (Fig 4). The roadway was depicted intentionally with lanes too narrow for lawful in-lane passing of bicyclists by motor vehicles (approximately 3.35m (11ft) travel lane, 1.83m (6ft) wide motor vehicle), no shoulder, no adjacent bicycle or mutli-use path, passing permitted (dashed lane lines), and traffic in the adjacent lane precluding immediate, lawful passing of the bicyclist by the motorist. This depic-tion was intended to focus attendepic-tion on essential quesdepic-tions of respondents’beliefs about the rights and duties of the bicyclist and following motorist, without confounding factors such as the possibility of the bicyclist using a shoulder, the presence of a no-passing zone, and the absence of traffic in the adjacent travel lane.
For each of the two traffic situations, respondents were asked to agree or disagree with four statements regarding action the motorist or bicyclist should take, and the permissibility and safety of the bicyclist’s road position. We created four versions of the questionnaire, one for each of our three signage scenarios and a control with no signage. All versions of the question-naire were identical with the exception of the images for the two traffic situations; the images for each treatment contained the appropriate signage or travel lane markings (Fig 4,S1andS2
Methods). The first panel of the questionnaire was an informed consent and an invitation for eligible respondents to proceed to the survey. To avoid drawing attention to the signage, the
Fig 3. Example tweet.Each tweet included a request that the viewer complete our survey and retweet it and was directed at other Twitter users (the
@handles) and Twitter users interested in specific issues (keywords preceded by #).
informed consent indicated that respondents were being asked to evaluate motorist–bicyclist interactions. Once a potential respondent proceeded, s/he was served, at random, one of the four versions of the questionnaire (S2 Methods).
We also asked respondents to provide information about the distance they drove motor vehicles and bicycles weekly, primary mode of transportation to school or work, level of educa-tion, gender, and state of residence. Responses to all demographic questions except education and gender were required for questionnaire submission.
Data Analysis
We obtained 1,978 responses to our questionnaire (Table 1) and excluded 154 from our analy-sis, because the respondents identified themselves as living outside the United States. We ana-lyzed the remaining 1,824 responses (S1andS2Data) using a logistic regression model that predicted agreement versus disagreement with each statement as a function of the signage sce-nario (each of the three traffic control devices compared to no signage), the respondent’s pri-mary commute mode (private motor vehicle vs. other), and the distance the respondent bicycled during a typical week (16km(10mi) vs.>16km). Our analyses were conducted using the statistical package, R (www.r-project.org).
Results
In almost every case, on 2- and 4-lane roadways, respondents who saw“Bicycle May Use Full Lane”signage were significantly more likely (p<0.1) than those who saw no signage to agree that bicyclists are permitted in the center of the lane, do not have to move right to allow motor-ists to pass within the same lane, that motormotor-ists should wait for a break in traffic before passing
Fig 4. Example traffic situation.This shows the image and statements we used for the two-lane roadway with theBicycles May Use Full Lanesignage
treatment. Images for the other three treatments were identical except for signage, which was appropriate for the treatment. The full survey is shown inS1 Methods; images for all four treatments are reproduced inS2 Methods.
doi:10.1371/journal.pone.0136973.g004
Table 1. Characteristics of our survey respondents.
Geographic Distribution Traffic Control Device
United States 1,824 (92%) Bicycle May Use Full Lane 489 (27%)
Non-US (excluded from analyses) 154 (8%) Shared Lane Marking 454 (25%)
Total 1,978 (100%) Share the Road 422 (23%)
None 459 (25%)
Total 1,824 (100%)
Weekly Cycling Distance Commute Mode
16km (10mi) 369 (20%) Private Motor Vehicle 776 (43%)
>16km 1,455 (80%) Other means 1,048 (57%)
Total 1,824 (100%) Total 1,824 (100%)
Education Gender
Less than High School 3 (<1%) Female 411 (23%)
High School 133 (7%) Male 1,387 (76%)
Community College 171 (9%) No response 26 (1%)
4-Year College 843 (46%) Total 1,824 (100%)
Graduate Degree 667 (37%)
No response 7 (<1%)
Total 1,824 (100%)
in the adjacent lane, and that bicyclists are safe in the travel lane (Fig 5,Table 2,S1 Table). The only exception was on 4-lane roadways in response to the statement that motorists should wait to pass, for which behavior was unaffected by the signage. Agreement with this statement, how-ever, was uniformly high (95%), regardless of traffic control devices, suggesting the vast majority of roadway users recognize the duty of motorists to wait for an opportunity to pass even without signage.
There was no statistically significant difference in responses between those who saw“Share the Road”signage and those who saw no signage in any scenario we tested (Fig 5,Table 2).
Respondents who experienced Shared Lane Markings were significantly more likely than respondents who saw no signage to agree that bicyclists are permitted in the center of the travel lane, on both 2- and 4-lane roads (Table 2). They were also more likely, on 4-lane roads, to dis-agree that the bicyclist had to move out of the way and to dis-agree that the bicyclist was safe in the center of the lane.
Regardless of signage, respondents who commuted to work by means other than personal motor vehicle were significantly more likely than those who commuted by personal motor vehicle to agree that bicyclists are permitted in the center of the lane, donothave to move right to allow motorists to pass within the same lane, that motorists should wait for a break in traffic before passing in the adjacent lane, and that bicyclists are safe in the travel lane (Table 2). The same can be said of respondents who bicycled>16km/week in comparison to those who bicy-cled16km/week, except on 4-lane roads for which there was no difference between the groups in response to the“motorist should wait to pass”statement.
We saw the largest shifts in response to the“Bicycles May Use Full Lane”signage when compared to no traffic control devices among respondents who bicycled16km per week or commuted by private motor vehicle (Fig 5). Among those who bicycled16km per week, for example, agreement with the statement that the bicyclist should move right to allow the motor-ist to pass within the same lane decreased 14 percentage points (to 29%) on the 2-lane roadway and 17 percentage points (to 17%) on the 4-lane roadway, compared to 5-point decreases (to 26% and 20%) for respondents who bicycled>16km per week. Among respondents who com-muted by private motor vehicle we saw a 10-point increase (to 63%) in agreement with the statement that it was safe for the bicyclist to be in the center of the travel lane on 2-lane road-ways, and an 18-point increase (to 71%) on the 4-lane roadway, compared to 3 points (to 75%) and 6 points (to 80%) for respondents who commuted by other means.
Although significantly more respondents agreed that bicyclists are permitted in the center of the travel lane when presented“Bicycles May Use Full Lane”signage, a large proportion still disagreed–8% overall on 2-lane and 6% on 4-lane roadways. The tendency to disagree was particularly strong among those who cycled16km per week (15% on 2-lane and 10% on 4-lane roadways) or commuted by private motor vehicle (14% on 2-lane and 11% on 4-lane roadways).
Discussion
Our results are consistent with sign design principles and guidelines promulgated in the Manual on Uniform Traffic Control Devices that support concrete, simple, unambiguous, and precise signage with low semantic distance that“convey a clear, simple meaning”[21,29–30]. They support arguments that“Share the Road”signage should not be used as a substitute for “Bicycles May Use Full Lane”signage to deliver that message, because“Share the Road”is imprecise and ambiguous for that purpose. While the one available study we reviewed for “Bicycles May Use Full Lane”signage (S1 Text) showed mixed results, we believe they can be ascribed to the confounding factors described in that study rather than inherent problems with comprehensibility of the signage. Our middle-of-the-road results for Shared Lane Markings suggest comprehensibility issues that may be partly responsible for conflicting results in on-road observational studies, many of which also suffered from improper placement of the Shared Lane Markings (S1 Text). The Manual on Uniform Traffic Control Devices suggests that“Bicycles May Use Full Lane”signage and Shared Lane Markings may be used together [21]. Although we did not test this combination, our results lead us to hypothesize that the combination would be more comprehensible than either device used in isolation.
Fig 5. Comparison of agreement with four road use statements under three treatments.Bicycle May Use Full Lane–square; Shared Lane Markings–
inverted triangle; Share the Road–yellow diamond; and control (No Sign)–red circle on 2-lane (left column) and 4-lane (right column) roads. In each plot results for the overall sample (n = 1,824) are compared to respondents who bicycle16km/week (n = 369), who commute by personal motor vehicle (n = 776), who bicycle>16km/week (n = 1,455), and who commute by other means (n = 1,048). The y-axis scales vary among statements (rows). For all
respondents, significant differences between the Bicycles May Use Full Lane treatment and the control (No sign) are marked using*for p<0.1,**p<0.05, ***p<0.01; similarly, for the Shared Lane Marking treatment they are marked using +; Share the Road never differed significantly from no signage. doi:10.1371/journal.pone.0136973.g005
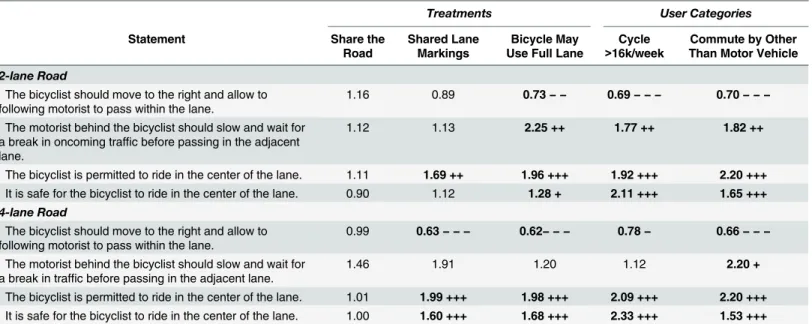
Table 2. Comparison of agreement with four road use statements by treatment and by two user categories on 2- and 4-lane roads.
Treatments User Categories
Statement Share the
Road
Shared Lane Markings
Bicycle May Use Full Lane
Cycle >16k/week
Commute by Other Than Motor Vehicle
2-lane Road
The bicyclist should move to the right and allow to following motorist to pass within the lane.
1.16 0.89 0.73− − 0.69− − − 0.70− − −
The motorist behind the bicyclist should slow and wait for a break in oncoming traffic before passing in the adjacent lane.
1.12 1.13 2.25 ++ 1.77 ++ 1.82 ++
The bicyclist is permitted to ride in the center of the lane. 1.11 1.69 ++ 1.96 +++ 1.92 +++ 2.20 +++ It is safe for the bicyclist to ride in the center of the lane. 0.90 1.12 1.28 + 2.11 +++ 1.65 +++
4-lane Road
The bicyclist should move to the right and allow to following motorist to pass within the lane.
0.99 0.63− − − 0.62− − − 0.78− 0.66− − −
The motorist behind the bicyclist should slow and wait for a break in traffic before passing in the adjacent lane.
1.46 1.91 1.20 1.12 2.20 +
The bicyclist is permitted to ride in the center of the lane. 1.01 1.99 +++ 1.98 +++ 2.09 +++ 2.20 +++ It is safe for the bicyclist to ride in the center of the lane. 1.00 1.60 +++ 1.68 +++ 2.33 +++ 1.53 +++
For treatments (Share the Road, Shared Lane Markings, Bicycle May Use Full Lane) the comparison is to the control case of no signage; the odds ratio shown compares each treatment to the control. For user categories, the comparison and associated odds ratio, is to the contrasting user category (i.e., respondents who cycle>16k/week vs. those who cycle16k/week; those who commute by means other than personal motor vehicle vs. those who commute by personal motor vehicle). All significant differences are shown in bold font and followed by signs that show whether tendency to agree increased (+) or decreased (-) relative to the comparison case. The number of signs indicates the significance level: 1 sign p<0.1; 2 signs p<0.05; 3 signs p<0.01. Cells in normal font and without following signs indicate no significant difference (p0.1) from the comparison case. Full model results (parameter estimates, standard error, p-values) are presented inS1 Table.
The improved perceptions of safety elicited by“Bicycles May Use Full Lane”signage suggest that its expanded use could help increase cycling rates. Specifically, because concerns about safety are a deterrent to initiating or increasing bicycling [9,11–12], signage improving percep-tions of safety may increase bicycling mode share.“Bicycles May Use Full Lane”signage signifi-cantly increased perceptions of safety when bicycling in the travel lane on 2- and 4-lane roadways, whereas Shared Lane Markings did so only on 4-lane roadways;“Share the Road” signage did not differ significantly in this regard from the roadways without traffic control devices.
The comparative advantages of“Bicycle May Use Full Lane”signage, and failure of“Share the Road”signage, may be much larger than our results suggest, because our sample included an unusually high number of bicycle commuters and bicycle riders relative to the US popula-tion (Table 1). Further, the positive effects, in terms of delivering the message and increasing perceptions of safety, of“Bicycle May Use Full Lane”signage were particularly strong for the two groups of respondents who most accurately reflect the US population: the 86% who com-muted by private motor vehicle in 2013 [37] and those who do not bicycle>16km per week. These portions of the population are likely to be less familiar with the application of vehicle codes to bicyclists and represent critical target audiences for traffic control devices and efforts to promote bicycling in the US.
Our results show a clear, consistent pattern of greater importance of these bicycle-related traffic control devices among private motor vehicle commuters and respondents with less expe-rience bicycling (Fig 5). We speculate that as people learn through real-life experience–by bicy-cling more or by commuting in ways other than private motor vehicle–they no longer need signs to remind them of appropriate behavior. One way of learning is through clear messages delivered by well-designed signage, which, in our study, appear to have influenced the views of novice bicyclists and private motor vehicle commuters. An effective bicycle-related traffic con-trol device could initiate a virtuous cycle, because small increases in the number of bicycle com-muters can create large declines in risk as bicyclists become part of motorists’search image. In California, for example, the risk of a bicyclist being hit by a motor vehicle is about ten times lower in communities where more than 2% of the residents commute on bicycles, relative to places where less than 1% do [38]. Decreasing risk could lead to even further increasing bicycle use.
Study Limitations
We evaluated comprehensibility only, and in a limited and highly controlled situation. In real-world traffic situations, reaction time, visibility, and visual clutter may make sign interpreta-tions more difficult for roadway users. This is especially true in urban areas, where such devices abound and may only be visible briefly [27]. While recognizing these limitations, we argue that a traffic control device with low comprehensibility in a highly controlled situation such as our survey is unlikely to be effective on real roadways where these additional factors must be considered.
Using Twitter to recruit survey respondents limits our scope of inference, because Twitter users are not representative of the US population. For example, Mislove and others reported that, in the US, Twitter users overrepresented densely populated areas and were not a represen-tative sample of gender or ethnicity [40]. Our respondent population was skewed toward peo-ple who cycled>16km per week (80%) and commuted by other than private motor vehicle (57%) (Table 1). Only 165 (9%) respondents reported that they did not bicycle at all during a typical week (these are included with our16km per week respondents). This happened for at least two reasons. First, bicyclists seemed to have more of a vested interest in the outcome and consequently spread the survey link widely to friends and to groups to which they belonged. Second, and related, a popular urban bicycling blog, UrbanVelo (urbanvelo.org), posted an entry about our survey which attracted bicyclists. Our findings, however, would likely be stron-ger with a less biased sample because the different impacts of signs found in this study were strongest among non-cyclists.
Further Work
Our finding that signage had the greatest effect on understanding of traffic laws and percep-tions of safety among respondents who cycled the least suggests that future research should tar-get people who do not cycle at all, as these roadway users may benefit most from more
comprehensible signage. Limiting the scope of future studies to assessing“Bicycles May Use Full Lane”signage and Shared Lane Markings would further decrease the sample size needed to evaluate differences related to key demographic attributes not considered in this study, such as child versus adult. Although“Share the Road”signage was no better than an unsigned road-way at conveying the message that bicyclists are permitted to occupy a full lane, future studies may find it conveys other important messages.
The use of emerging virtual reality technologies that allow respondents to experience realis-tic traffic situations using immersive, head-mounted displays can further enhance our ability to evaluate traffic control devices [41]. Respondents would be put behind the wheel of a virtual motor vehicle or handlebars of a virtual bicycle and exposed to a variety of roadway conditions. This would add reaction time, visibility, and visual clutter in a controlled environment with replication–every respondent would experience the exact same situations, reducing the com-plexity and confounding factors of on-road observation. Eye tracking would allow researchers to better understand what respondents are observing, and it would also be possible to collect supplemental data about knowledge and experience from each respondent.
them to ride up and down test roadways in varied, measurable, and repeatable ways to measure motorist behavior.
Conclusion
Of the three bicycle-related traffic control devices we tested,“Bicycles May Use Full Lane” sign-age delivered the messsign-age about the rights and responsibilities of bicyclists and motorists with respect to travel lane occupancy most consistently: bicyclists are permitted in the travel lane and need not move to allow motorists to pass them within the lane. Although Shared Lane Markings did increase comprehension in some cases, they did not deliver the message as con-sistently as“Bicycles May Use Full Lane”signage. We speculate that a combination of“Bicycles May Use Full Lane”signage and Shared Lane Markings might be particularly comprehensible. “Share the Road”signage failed to provide any additional comprehension in this regard when compared to the unsigned roadways in any of our tests.“Bicycles May Use Full Lane”showed particularly strong increases in comprehension for novice bicyclists and private motor vehicle commuters, critical target audiences for these traffic control devices and for efforts to promote bicycling in the US.
Supporting Information
S1 Data. Data dictionary.List and description of variables in dataset (seeS2 Datafor full data-set).
(PDF)
S2 Data. Comma-separated variable (CSV) dataset used in our analyses. (DAT)
S1 Methods. Complete survey, shown here for the Bicycles May Use Full Lane treatment. Each screen from the survey is shown separately as the respondent would experience them. (PDF)
S2 Methods. Images for all four treatments, shown here for the two-lane roadway. (PDF)
S1 Table. Parameter estimates, standard errors, and p-values for our logistic model. (PDF)
S1 Text. Review of studies of the three traffic control devices evaluated in this article. (PDF)
Acknowledgments
Author Contributions
Conceived and designed the experiments: GH MNP. Performed the experiments: GH MNP. Analyzed the data: GH MNP. Contributed reagents/materials/analysis tools: GH MNP. Wrote the paper: GH MNP.
References
1. Macmillan A, Connor J, Witten K, Kearns R, Rees D, Woodward A (2015) The societal costs and bene-fits of commuter bicycling: Simulating the effects of specific policies using system dynamics modeling. Environmental Health Perspectives 122(4): 335–344.
2. Olshansky SJ, Passaro DJ, Hershow RC, Layden J, Carnes BA, Brody J, et al. (2005) A potential decline in life expectancy in the United States in the 21st century. New England Journal of Medicine 352(11): 1138–1145. PMID:15784668
3. Buehler R, Pucher J, Merom D, Bauman A (2011) Active Travel in Germany and the US:: Contributions of Daily Walking and Cycling to Physical Activity. American Journal of Preventive Medicine 41(3): 241– 250. doi:10.1016/j.amepre.2011.04.012PMID:21855737
4. Andersen LB, Schnohr P, Schroll M, Hein HO (2000) All-cause mortality associated with physical activ-ity during leisure time, work, sports, and cycling to work. Archives of Internal Medicine 160(11): 1621. PMID:10847255
5. Peterson MN, Peterson T, Liu J (2013) The Housing Bomb: Why Our Addiction to Houses Is Destroying the Environment and Threatening Our Society. Baltimore: John Hopkins University Press.
6. Dietz T, Gardner GT, Gilligan J, Stern PC, Vandenbergh MP (2009) Household actions can provide a behavioral wedge to rapidly reduce US carbon emissions. Proceedings of the National Academy of Sci-ences 106(44): 18452–18456.
7. Davis SC, Diegel SW, Boundy EG (2011) Transportation energy data book: Edition 30. Oak Ridge, TN: Oak Ridge National Laboratory.
8. Royal Muller-Steiger (2008) National Survey of Bicyclist and Pedestrian Attitudes and Behavior. Wash-ington, DC: US Department of Transportation National Highway and Traffic Safety Administration. Available:http://www.nhtsa.gov/Driving+Safety/Research+&+Evaluation/National+Survey+of +Bicyclist+and+Pedestrian+Attitudes+and+Behavior. Accessed 24 December 2014.
9. Winters M, Davidson G, Kao D, Teschke K (2011) Motivators and deterrents of bicycling: comparing influences on decisions to ride. Transportation 38(1): 153–168.
10. Pucher J, Buehler R (2008) Making cycling irresistible: lessons from the Netherlands, Denmark and Germany. Transport Reviews 28(4): 495–528.
11. Harris MA, Reynolds CC, Winters M, Chipman M, Cripton PA, Cusimano MD, et al. (2011) The Bicy-clists' Injuries and the Cycling Environment study: a protocol to tackle methodological issues facing studies of bicycling safety. Injury prevention 17(5): e6–e6. doi:10.1136/injuryprev-2011-040071PMID: 21653651
12. Fishman E, Washington S, Haworth N (2012) Understanding the fear of bicycle riding in Australia. Jour-nal of the Australasian College of Road Safety 23(3): 19.
13. Sener IN, Eluru N, Bhat CR (2009) Who Are Bicyclists? Why and How Much Are They Bicycling? Trans-portation Research Record: Journal of the TransTrans-portation Research Board 2134: 63–72.
14. Teschke K, Harris MA, Reynolds CC, Winters M, Babul S, Chipman M, et al. (2012) Route infrastructure and the risk of injuries to bicyclists: A case-crossover study. American journal of public health 102(12): 2336–2343. doi:10.2105/AJPH.2012.300762PMID:23078480
15. Wilkinson WC III, Clarke A, Epperson B, Knoblauch R (1994) Selecting Roadway Design Treatments to Accommodate Bicycles. Washington DC: US Federal Highway Administration Publication No. FHWA-RD-92-073. Available:https://scholarsbank.uoregon.edu/xmlui/bitstream/handle/1794/10427/TE301_ S45_1994.pdf?sequence=1. Accessed 31 December 2014.
16. Seyfried RK, editor (2013) Traffic Control Devices Handbook, 2nd Edition. Washington, DC: Institute of Transportation Engineers.
17. Caffrey K (undated) Lane width and space: interactive graphics. Available:http://iamtraffic.org/ resources/interactive-graphics/. Accessed 1 January 2015.
18. Cycling Savvy. undated. Ten tips for successful cycling. Available: http://cyclingsavvy.org/ten-tips-for-successful-cycling/. Accessed 31 December 2014.
20. Oswald F (2011) Bicycle "right to the road" cases. Available:http://bikelaws.org/Rt2Road.htm. Accessed 1 January 2015.
21. US Departmant of Transportation-Federal Highway Administration (2012) Manual on Uniform Traffic Control Devices for Streets and Highways, 2009 Edition, Including Revisions 1 & 2 dated May 2012. Available:http://mutcd.fhwa.dot.gov/pdfs/2009r1r2/mutcd2009r1r2edition.pdf. Accessed 10 December 2014.
22. National Highway Traffic Safety Administration (NHTSA) (undated) Bicycles. Available:http://www. nhtsa.gov/Bicycles. Accessed 6 December 2014.
23. North Carolina Division of Motor Vehicles (2014) North Carolina Driver's Handbook. Available:http:// www.ncdot.gov/download/dmv/handbooks_ncdl_english.pdf. Accessed 5 December 2014. 24. Florida Dept. of Highway Safety & Motor Vehicles (2014) Florida Driver's Handbook Available:http://
www.flhsmv.gov/handbooks/englishdriverhandbook.pdf. Accessed 5 December 2014. 25. Shanteau R (2013) The marginalization of bicyclists. Available:
http://iamtraffic.org/equality/the-marginalization-of-bicyclists/. Accessed 1 January 2015.
26. North Carolina Department of Transportation (undated) Share the Road Signing Program. Available: http://www.ncdot.gov/bikeped/safetyeducation/signing/. Accessed 5 December 2014.
27. Ells JG, Dewar RE (1979) Comprehension of verbal and symbolic traffic sign messages. Human Fac-tors: The journal of the Human Factors and Ergonomics Society 21: 161–168.
28. Jordan PW, Draper SW, MacFarlane KK, McNulty SA (1991) Guessability, learnability, and experi-enced user performance. In Diaper D, Hammond N, editors. People and Computers VI.
Cambridge. pp. 237–245.
29. McDougall SJ, Curry MB, de Bruijn O (1999). Measuring symbol and icon characteristics: Norms for concreteness, complexity, meaningfulness, familiarity, and semantic distance for 239 symbols. Behav-ior Research Methods, Instruments, & Computers 31(3): 487–519.
30. Lay MG (2004) Design of Traffic Signs. In Castro C, Horberry T, editors. The Human Factors of Trans-port Signs. Boca Raton: CRC Press. pp 25–48.
31. Bike Delaware (2014) Why "Share the Road" is gone in Delaware. Available:http://www.bikede.org/ 2014/04/07/why-share-the-road-is-gone/. Accessed 10 Dec 2014.
32. Pein W (2012a) The Share the Road Sign. Available:http://bicyclingmatters.files.wordpress.com/2008/ 04/the-share-the-road-sign3.pdf. Accessed 17 December 2014.
33. DelawareDOT (2013) Memorandum: Bicycle warning sign and share the road plaque. Available:http:// www.deldot.gov/information/pubs_forms/manuals/de_mutcd/pdf/ShareTheRoadPlaqueMemo.pdf. Accessed 5 December 2014.
34. Ng AW, Chan AH (2007) The guessability of traffic signs: effects of prospective-user factors and sign design features. Accident Analysis & Prevention 39(6):1245–1257.
35. Shinar D, Vigelzang M (2013) Comprehension of traffic signs with symbolic versus text displays. Trans-portation Research, Part F 18: 72–82.
36. Willis GB (2005) Cognitive interviewing: a tool for improving questionnaire design. Thousand Oaks, CA: Sage Publications.
37. American Association of State Highway and Transportation Officials (AASHTO) (2013) Commuting in America 2013: The National Report on Commuting Patterns and Trends. Available:http://traveltrends. transportation.org/Documents/CA10-4.pdf. Accessed 2014 December 19
38. Jacobsen PL (2003) Safety in numbers: more walkers and bicyclists, safer walking and bicycling. Injury prevention 9(3): 205–209. PMID:12966006
39. Siceloff B (2015) Moped registration coming to NC and more regulations are debated. Raleigh News & Observer, 2015 Jan 27. Available: http://www.newsobserver.com/news/politics-government/state-politics/article10234505.html. Accessed 2015 June 23.
40. Mislove A, Lehmann S, Ahn, Y-Y, Onnela, J-P, Rosenquist, JN (2011) Understanding the demograph-ics of Twitter users.Proceedings of the Fifth International AAAI Conference on Weblogs and Social Media. Available:http://www.ccs.neu.edu/home/amislove/publications/Twitter-ICWSM-Updated.pdf. Accessed 2015 June 15