Elucidation of the processes that determine the compo-sition and structure of natural communities and the preva-lence of abiotic or biotic factors in these processes remains an important challenge in ecology (CHESSON & HUNTLY 1997, JACK -SON et al. 2001). While some studies carried out in tropical riv-ers have identified non-random assemblage patterns that could be associated with abiotic factors (RODRÍGUES & LEWIS 1997), others have shown the influence of biotic interactions, such as predation and competition, on assemblage structure (FREITAS et al. 2010). In large tropical rivers, the importance of abiotic and biotic factors can vary depending on the scale considered (FREITAS et al. 2013) and the period of the hydrological cycle (WINEMILLER 1989).
Aquatic ecosystems throughout the world are facing con-tinuous threats from human activities. The resulting changes they suffer exert a detrimental influence on aquatic
communi-ties (DUDGEON et al. 2006) and may be responsible for the ex-tinction of numerous species. According to AGOSTINHO et al. (2005), the main causes of fish biodiversity loss in aquatic eco-systems can be grouped into five major categories: (1) compe-tition for water and subsequent water abstraction; (2) habitat alteration; (3) pollution from different sources (heavy metals, pesticides and domestic and industrial wastewater); (4) the introduction of exotic species; and (5) commercial exploita-tion. Changes in the species richness and composition of fish communities in rivers with different levels of environmental impact can be determined in many ways. Fish community at-tributes (e.g., species richness and diversity) provide basic in-formation about qualitative changes (MAGURRAN 2003), but emergent attributes (structure, composition and organization) allow the effects of environmental changes on communities to be better assessed (KARR 1981).
Factors determining the structure of fish assemblages in an Amazonian river
near to oil and gas exploration areas in the Amazon basin (Brazil):
establishing the baseline for environmental evaluation
Igor David Costa
1& Carlos Edwar de Carvalho Freitas
2,*1Departamento de Engenharia de Pesca, Fundação Universidade Federal de Rondônia. Rua da Paz 4376,
76916-000 Presidente Médici, RO, Brazil. E-mail: [email protected]
2Departamento de Ciências Pesqueiras, Universidade Federal do Amazonas. Avenida General Rodrigo Otávio 3000,
69077-000 Manaus, AM, Brazil.
*Corresponding author. E-mail: [email protected]
ABSTRACT. Determining the significance of biotic and abiotic factors in the structuring of fish assemblages in freshwater environments is an important question in ecology, particularly in view of environmental changes caused by man. In this paper we sought to identify the factors responsible for the composition and abundance of fish species collected with gill nets in six locations near ports in forest clearance areas opened up for oil and natural gas exploration (Petrobras Pedro Moura Base) in the Urucu River, during drought and flood cycles. In all, 923 individuals from 23 families and 82 species were collected, totalling a biomass of 182,244 g. The most abundant species during the flood season were Bryconops alburnoides (Kner, 1858) and Dianema urostriatum (Miranda Ribeiro, 1912); in the drought season, the predominant species were Osteoglossum bicirrhosum (Cuvier, 1829) and Serrasalmus rhombeus (Linnaeus, 1766). The species with the greatest biomass during the flood season were Pellona castelnaeana (Valenciennes, 1847), S. rhombeus and Pellona flavipinis (Valenciennes, 1847). During the drought season, the predominant species was O. bicirrhosum. When both periods were analysed together, electrical conductivity, water transparency and dissolved oxygen were the most important factors. The species Hemisorubim platyrhynchos (Valenciennes, 1840), O. bicirrhosum, Chaetobranchus flavenscens Heckel, 1840, Geophagus proximus (Castelnau, 1855) were strongly related to high values of conductivity, pH and water current velocity during the drought season, as well as Serrasalmus altispinis Merckx, Jégu & Santos, 2000, Triportheus albus Cope, 1872, Triportheus angulatus (Spix & Agassiz, 1829) and Brycon melanopterus (Cope, 1872) that were associated with less depth and width in the drought season whereas P. castelnaeana, D. urostriatum, Rhytiodus argenteofuscus Kner, 1858 and Sorubim lima (Bloch & Schneider, 1801) were mainly associated with high transparency and dissolved oxygen during the flood season.
The Amazon River basin harbours the world’s greatest diversity of freshwater fish (FREITAS et al. 2010). To date, most studies of the diversity of Amazonian fish have been concen-trated in the floodplains adjacent to large rivers (CRAMPTON 1999, FREITAS & GARCEZ 2004, SIQUEIRA-SOUZA & FREITAS 2004), and there are few reports on the ichthyofauna of the middle and upper courses of tributaries of the Amazon River (SILVANO et al. 2000). An oil and natural gas production facility was built on the upper stretch of the Urucu River, a tributary of the right bank of the Solimões River, in 1988, and a pipeline that crosses the forest in parallel with the Urucu River has connected the facility with a harbor in the Solimões River since the end of the 1980s. Taking into account the scarce information about fish fauna in the upper stretches of tributaries of the Amazonas River, and the complete inexistence of data from the Amazo-nian fish assemblages inhabiting the water bodies surround-ing the oil and natural gas plant, we tested the hypothesis that the structure of fish assemblages differ among the studied pe-riods due to the change of limnological variables from port activities over a stretch of that watershed.
This study evaluated the influence of environmental variables on the structure of fish assemblages in a stretch of the Urucu River during the drought and flood seasons and could constitute a baseline to identify changes due environmental pressures mediated by the oil and gas exploration plant.
MATERIAL AND METHODS
The study was conducted in the Urucu River, near the Evandro 1, Evandro 2, and Urucu harbors, which supply the Petrobras Pedro Moura Oil and Gas Exploration Base. The area is located in the municipality of Coari, in the state of Amazonas. The Urucu River (04°53’S,65°11’W) is a right-bank tributary of the Solimões River and one of the main tributaries of the Coari Lake. The water in the river is classified as black. However, during the flood season, it is almost white and is referred to locally as ‘toldada’. The region is flat with gently rolling hills and acidic soil, and the climate is classified as tropical, with virtually no winter. Although rainfall is distributed through-out the year, the months of January to April and July to Sep-tember have higher and lower rainfall, respectively.
Fish collections in the Urucu River were performed in April and August 2008, during the flood and drought season, respectively. The collection points, in a longitudinal (upstream-downstream) sequence, were: a control point (PCONT) (4°51’20.7”S, 65°20’53.2”W) located upstream of the three ports; a point downstream of Urucu port (DPU) (4°50’59.3”S, 65°20’37.4”W) located 500m from the port; a point opposite Evandro 2 port (PE2) (4°45’47.9”S, 65°02’46.6”W); a point up-stream of Evandro 2 port (UE2) (4°45’42”S, 65°02’37.4”W); a point downstream of this same port (DE2) (4°45’26.4”S, 65°02’38.7”W); and a point downstream of Evandro 1 port (DE1) (4°45’02.2”S, 65°02’42.6”W) (Fig. 1). With the
excep-tion of DPU, all collecexcep-tion points were located 1 km upstream or downstream of their respective ports (Fig. 1). Eight sets of standardized 2 x 20 m fishing nets with mesh sizes varying from 30 to 100 mm (between opposite knots) were used. Sam-pling effort was standardized and collections were carried out for 13 hours continuously at each sampling point from 6:00 am to 7:00 pm. Fish were screened and identified according to NELSON (2006) and FERREIRA et al. (1998) and by experts from the National Amazonian Research Institute (INPA). The biom-ass in grams of each species was calculated using a 0.01 g accu-racy digital scale. All the fish were sorted, identified and fixed in 10% formalin and preserved in 70% ethanol. Some of the specimens were deposited in the ichthyological collection at the INPA (Vouchers: INPA-32193, INPA-32201, INPA-32186, 32187, 32188, 32184, 32190, INPA-32194, INPA-32195, INPA-32197, INPA-32199, INPA-32183, INPA-32178, 32200-INPA and INPA-32175).
Figure 1. Study area showing the sampling areas and sampling points.
The following limnological variables were measured at the subsurface at each sampling point with a DIGIMED DM4P digital potentiometer: temperature (°C), electrical conductiv-ity (µS/cm), pH and dissolved oxygen (mgO2/L). The following
was measured at each sampling point with a General Oceanics 2030R mechanical flow meter with a 6-digit odometer-style counter and minimum velocity reading of 10 cm/s.
As aliphatic hydrocarbons (AHCs) are potential contami-nants from oil and natural gas plants, the concentration and source (petrogenic or biogenic) of these pollutants in open wa-ter was dewa-termined using a specific technique for aliphatic hy-drocarbons (n-alkanes from n-C12 to n-C40 and the two
isoprenoids pristane and phytane). One liter of water was col-lected from each sampling point, and extraction was carried out by mechanical agitation using a funnel with dichloromethane. The extract was then cleaned up and fractionated using liquid chromatography and hexane as the mobile phase. Aliphatic hydrocarbon content was determined by gas chromatography with flame ionization detection (GC-FID). An internal/recovery standard was added before the samples were extracted to check the efficiency of the methodologies used – modified from EPA 8270 (1986).
The Shapiro-Wilks and Levene tests were used with the limnological variables to test for normality and homogeneity of variance, respectively, to determine whether parametric test t or non-parametric Mann-Whitney U test could be appropri-ate to compare the seasonal measures. To identify differences in fish fauna between periods of drought and flood, the analy-sis of similarities (ANOSIM) proposed by CLARKE & GREEN (1988) was used for numerical abundance and biomass data. We used the Morisita-Horn index (MAGURRAN 2003) as a quantitative simi-larity measure, as this is almost independent of sample size and species richness (WOLDA 1981). Canonical correlation analy-sis (CCA) was used with species with abundance greater than three individuals to quantify the influence of environmental variables on the distribution of fish species in periods of drought and flood. The Monte Carlo test was also performed (5.999 permutations) to determine the significance of each environ-mental variable. The data were previously log-transformed (log x + 1). CCA and ANOSIM were performed with PAST 2.17
soft-ware (HAMMER et al. 2001). Inferential analyses were considered significant when p ⭐ 0.05.
RESULTS
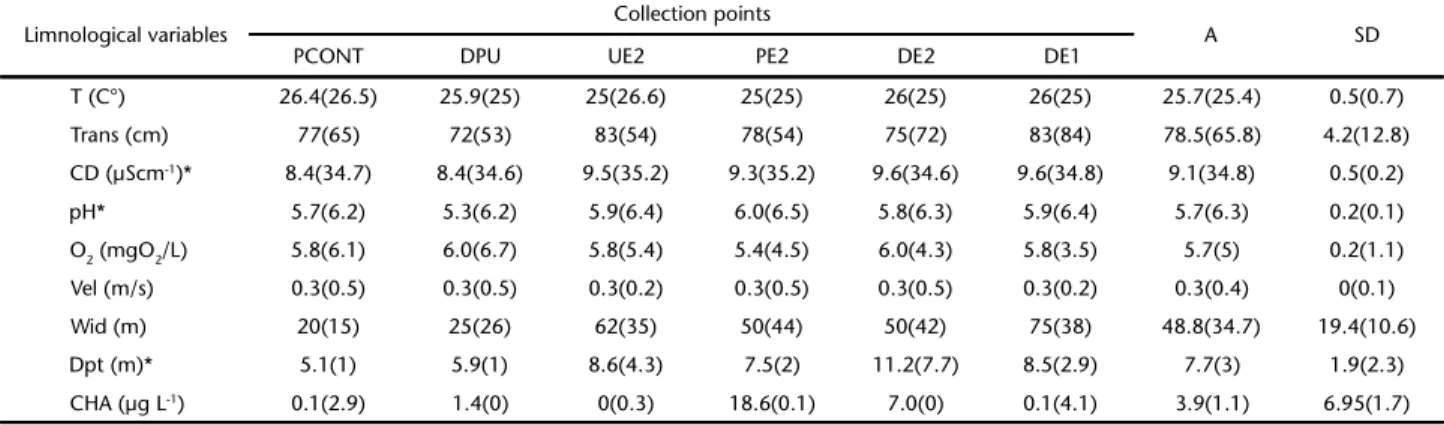
Temperature (U = 19.0; p = 0.48), transparency (U = 11.5; p = 0.09), dissolved oxygen (t = 1.77; p = 0.10), water current velocity (U = 17.5; p = 0.37), river width (t = 1.27; p = 0.22) and concentrations of aliphatic hydrocarbons (U = 21.0; p = 0.65) did not vary between the hydrological seasons. Conductivity was higher during the drought season (U = 0.001, p = 0.001) than during the flood season, and pH (t = -5.98, p = 0.0006) and river depth (t = 4.16, p = 0.001) were lower in the drought season than in the flood season (Table 1). Aliphatic hydrocarbon levels did not indicate contamination from petrogenic sources. The n-alkanes with the highest concentration [n-C29 (drought) and n-C31 (flood)] originated from the combustion of plant material.
The fish collections comprised 923 individuals distributed in 7 orders, 23 families and 82 species. Characiformes were the dominant group (61%), followed by Siluriformes (20%), while the orders Clupeiformes, Osteoglossiformes, Perciformes, Beloniformes and Pleuronectiformes accounted for less than 10% of the total captured. The most abundant species during the flood season were Bryconops alburnoides (Kner, 1858) (n = 64, 13%) and Dianema urostriatum (Miranda Ribeiro, 1912) (n = 63, 13%); in the drought season, the predominant species were
Osteoglossum bicirrhosum (Cuvier, 1829) (n = 55, 12%) and
Serrasalmus rhombeus (Linnaeus, 1766) (n = 44, 9%). The biomass
in the flood season was 76,100g and in the drought season, 106,144g, totalling 182,244 g. The species with the greatest bio-mass during the flood season were Pellona castelnaeana
(Valenciennes, 1847) (14,235 g, 20%), Serrasalmus rhombeus
(11,680 g, 16%), Pellona flavipinnis (Valenciennes, 1836) (73,55 g, 10%) and Calophysus macropterus (Lichtenstein, 1819) (7,230 g, 10%). During the drought season, the predominant species was
Osteoglossum bicirrhosum (45,506 g, 47%) (Appendix 1).
Table 1. Limnological data analyzed at collection points in the Urucu River in the flood and (drought) seasons. (T) Temperature, (Trans.) transparency, (CD) conductivity, (pH) Hydrogen potential, (O2) dissolved oxygen, (Vel.) water current velocity, (Wid) width of the river, (Dpt) depth, (CAH) concentrations of Aliphatic hydrocarbons, (A) average collection points, (SD) standard deviation, (*) p < 0.05.
Limnological variables Collection points A SD
PCONT DPU UE2 PE2 DE2 DE1
T (C°) 26.4(26.5) 25.9(25) 25(26.6) 25(25) 26(25) 26(25) 25.7(25.4) 0.5(0.7)
Trans (cm) 77(65) 72(53) 83(54) 78(54) 75(72) 83(84) 78.5(65.8) 4.2(12.8)
CD (µScm-1)* 8.4(34.7) 8.4(34.6) 9.5(35.2) 9.3(35.2) 9.6(34.6) 9.6(34.8) 9.1(34.8) 0.5(0.2)
pH* 5.7(6.2) 5.3(6.2) 5.9(6.4) 6.0(6.5) 5.8(6.3) 5.9(6.4) 5.7(6.3) 0.2(0.1)
O2 (mgO2/L) 5.8(6.1) 6.0(6.7) 5.8(5.4) 5.4(4.5) 6.0(4.3) 5.8(3.5) 5.7(5) 0.2(1.1)
Vel (m/s) 0.3(0.5) 0.3(0.5) 0.3(0.2) 0.3(0.5) 0.3(0.5) 0.3(0.2) 0.3(0.4) 0(0.1)
Wid (m) 20(15) 25(26) 62(35) 50(44) 50(42) 75(38) 48.8(34.7) 19.4(10.6)
Dpt (m)* 5.1(1) 5.9(1) 8.6(4.3) 7.5(2) 11.2(7.7) 8.5(2.9) 7.7(3) 1.9(2.3)
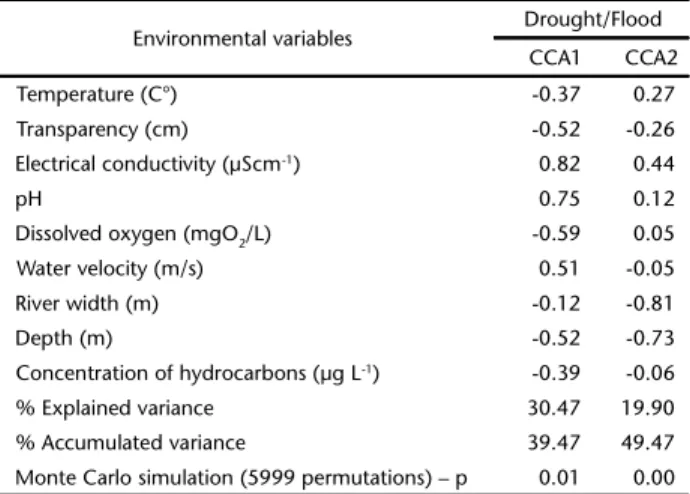
ANOSIM based on biomass did not show significant dif-ferences between flood and drought seasons (r = 0.15, p = 0.10, 9999 permutations). However, ANOSIM based on abundance revealed a greater variation in this parameter in the drought season than in the flood season (r = 0.22, p = 0.04, 9999 per-mutations). The first two CCA axes for the flood and drought seasons explained 49.47% of the distribution of species (Fig. 2). CCA 1 explained 30.47% of the variance based on conduc-tivity, transparency, pH, dissolved oxygen and water current velocity; and CCA 2 explained 19.90% of the variance associ-ated with the variables width and depth. The Monte Carlo test indicated that the first two axes derived from the CCA were significant (p < 0.05) (Table 2). Hemisorubim platyrhynchos
(Valenciennes, 1840), Osteoglossum bicirrhosum, Chaetobranchus
flavenscens Heckel, 1840 and Geophagus proximus (Castelnau,
1855)were strongly related to high values of conductivity, pH and water current velocity during the drought season,
as well as Serrasalmus altispinis Merckx, Jégu & Santos, 2000, Triportheus albus Cope, 1872, Triportheus angulatus (Spix & Agassiz, 1829) and Brycon melanopterus (Cope, 1872) that were associated with less depth and width in the drought sea-son, whereas P. castelnaeana, D. urostriatum, Rhytiodus argenteofuscus Kner, 1858 and Sorubim lima (Bloch & Schneider, 1801) were mainly associated with high transparency and dis-solved oxygen during the flood season (Table 3).
DISCUSSION
Several studies have shown that the composition, struc-ture and diversity of fish assemblages in flooded areas are cor-related with abiotic factors such as dissolved oxygen (SAINT-PAUL & SOARES 1987), temperature, pH, conductivity and habitat com-plexity; geomorphological features such as depth (STEWART et al.2002, FREITAS et al. 2013), transparency (RODRÍGUES & LEWIS 1997, SÚAREZ et al. 2001), lake area (SÚAREZ et al. 2001), connec-tivity and distance between water bodies (FREITAS & GARCEZ 2004); and biotic factors such as predation and competition (SAINT -PAUL et al. 2000).
Predictably, changes in fish community structure associ-ated with flood and drought events are relassoci-ated to variations in transparency and depth, which are strongly correlated vari-ables, primarily because of the increase in turbidity resulting from the resuspension of sediment from the river bottom to the water column (HAMILTON & LEWIS 1990). Water transparency, a variable that governs the visibility of the water column, de-termines the dominance of a large number of taxa and types of piscivorous animals in lakes during the drought season (RODRÍGUEZ & LEWIS 1997). In general, Characiformes and cichlids use visual orientation towards the daylight: they have large eyes and live in well-lit places such as surface waters (LOWE -MCCONNELL 1999). Similarly, Clupeiformes reduce their depen-dence on the optical system in the water column by adapting to life on the surface, which they do by taking advantage of a number of body features, such as silvery scales, a laterally com-pressed body, upturned jaws and a flat dorsal profile. In con-trast, several species of Siluriformes and Gymnotiformes have nocturnal habits, as well as sensorial adaptations to low light (LOWE-MCCONNELL 1999), and are found predominantly in tur-bid waters.
The association of H. platyrhynchos with conductivity during the drought season is explained by the increase in ion concentration during this period. This is due to the high tur-bidity (low light intensity) in the water column caused by the decrease in the volume of water (ESTEVES 1998). Siluriformes have sensory adaptations to low light levels and are found pre-dominantly in turbid waters (LOWE-MCCONNELL 1999), while species such as O. bicirrhosum, C. flavenscens and G. proximus
are more related to water current velocity. KIKUCHI & UIEDA (1998) observed that the highest rates of water current velocity are found in the flood season, and the lowest during the drought. Figure 2. Scores for sampling points on the first two axes of the
Canonical Correlation Analysis (CCA) in the drought/flood period: ( ) flood period and ({) drought period.
Table 2. Results of the Canonical Correlation Analysis for the occurrence of fish species and key environmental variables in periods of drought and flood in the Urucu River, Municipality of Coari, AM, Brazil.
Environmental variables Drought/Flood
CCA1 CCA2
Temperature (C°) -0.37 0.27
Transparency (cm) -0.52 -0.26
Electrical conductivity (µScm-1) 0.82 0.44
pH 0.75 0.12
Dissolved oxygen (mgO2/L) -0.59 0.05
Water velocity (m/s) 0.51 -0.05
River width (m) -0.12 -0.81
Depth (m) -0.52 -0.73
Concentration of hydrocarbons (µg L-1) -0.39 -0.06
% Explained variance 30.47 19.90
% Accumulated variance 39.47 49.47
Thus, we infer that the association of these species with water current velocity is a consequence of their sedentary hab-its, as the various collection points analyzed are transformed into large backwater areas during the drought season.
Clupeiformes, such as Pellona flavipinis (Valenciennes, 1847), are morphologically specialized for foraging near the surface (GOULDING 1980). The distribution of species associated with transparency can be interpreted based on the following evolutionary adaptations: (1) extremely good visual orienta-tion in non-piscivorous species in environments with low trans-parency, specifically at the surface of the water column because of the higher luminosity. Dianema urostriatum, one insectivo-rous species (REIS 2003), can be resident on this floodplain, colonizing the flooded forest adjacent during flood season.
The association of T. albus and T. angulatus with less depth and width during the drought season could be related to the seasonal feeding patterns of these species. Triportheus angulatus
remains into the lakes during flood period. However, when the water level is reducing, almost adults start coming out of the lake before the total isolation, performing lateral migration out of the floodplain (YAMAMOTO et al. 2004) resulting that the high-est abundance occurs during receding waters and drought pe-riod (SOARES & JUNK 2000). According to YAMAMOTO et al. (2004) in the drought season there is a clear reduction in the availabil-ity of food, insects and plant material being the most consumed by the species thus T. angulatus eat such food items that are more available in this lean period (YAMAMOTO et al. 2004). As well as the species of Triportheus, B. melanopterus presents om-nivorous habit (SANTOS et al. 2006), demonstrating a consider-able range of food items consumed by the group, which involves consumption this from plant debris, terrestrial and aquatic in-sects to fish and small vertebrates (ALBRECHT et al. 2009). The Piranha S. altispinis, like most members of this group, consumes fish however fruits, seeds and invertebrates are part of the diet of constant or occasional basis (SANTOS et al. 2006). According to YAMAMOTO et al. (2004) that the environmental seasonality con-trolled by the variation in water level may alter the richness and the abundance of resources in the environment, influenc-ing the food intake and dietary composition of predator fish. During the flood, the rising river level increases the abundance of food derived from the more different sources, providing bet-ter conditions for the fish to feed abundantly. In the dry season, the decrease in the water level leads to a scarcity of food (RESENDE et al. 1996). For carnivorous/piscivorous fishes this pattern may be inverted: during the flood stage, fodder fish species disperse over the floodplain in search of different food sources and shel-ter, which decreases their accessibility to predators. During the dry season, prey concentrate in the restricted water bodies and become more available to potential predators, thus increasing not only the diversity, but also the abundance of these items (FERREIRA et al. 2014).
It is of critical importance to understand the mechanisms that regulate the structure of fish assemblages, not only to ac-quire basic information, but also to anticipate the effect of envi-ronmental changes on the integrity of communities. As well as many studies in the Neotropics (e.g., JUNK et al.1983, SAINT-PAUL & SOARES 1987, RODRÍGUES & LEWIS 1997, TEJERINA-GARRO et al. 1998,
Table 3. Scores on axis 1 and axis 2 based on the matrix of species assemblage composition and the matrix of habitat variables in periods of drought and flood in the Urucu River, Municipality of Coari, AM, Brazil.
Species CCA 1 CCA 2
Pellonacastelnaeana (Valenciennes, 1847) -1.344080 -1.411710
Dianemaurostriatum (Miranda Ribeiro, 1912) -1.256870 -1.349400
Rhytiodusargenteofuscus kner, 1858 -1.250630 -1.057100
Sorubimlima (Bloch & Schneider, 1801) -1.187530 -0.727260
Pristobryconstriolatus (Steindachner, 1908) -1.176140 -0.413100
Raphiodonvulpinus Spix & Agassiz, 1829 -1.168580 -0.509860
Lycengraulisbatesii (Günther, 1868) -1.162720 -1.060510
Hypoptopoma cf. gulare Cope, 1878 -1.140400 -0.887850
Cynodongibbus Spix & Agassiz, 1829 -1.105250 -0.003700
Pinirapuspirinanpus (Spix & Agasiz, 1829) -1.072580 -0.029480
Pygocentrusnattereri Kner, 1858 -0.909090 -0.273610
Pellonaflavipinnis (Valenciennes, 1836) -0.898830 0.036199
Bryconopsalburnoides (Kner, 1858) -0.770940 -0.943670
Brycon cf. pesu Müller Troschel, 1845 -0.631250 0.951399
Serrasalmusrhombeus (Linnaeus, 1766) -0.459250 0.409816
Hemiodussemitaeniatus (Kner, 1858) -0.421950 0.394312
Myleusrubrypinnis (Müller & SchomburgK, 1841) -0.404910 1.042980
Moenkhausialepidura (Kner, 1858) -0.331460 1.575480
Leporinusagassizi Steindacherner, 1876 -0.226540 0.894908
Calophysusmacropterus (Lichtenstein, 1819) -0.101490 -0.279850
Plasgioscionsquamosissimus (Heckel, 1840) -0.052310 0.363431
Pimelodusblochii (Valenciennes, 1840) -0.049800 0.542570
Chalceuserythrurus (Cope, 1870) 0.047424 1.774320
Rineloricaria sp. 0.159718 1.669650
Agoniateshalecinus (Müller & Troschel, 1845) 0.292889 -0.682450
Bryconmelanopterus (Cope, 1872) 0.315085 2.866150
Serrasalmusaltispinis Merckx, Jégu & Santos, 2000 0.376206 3.238450
Triportheusalbus Cope, 1872 0.502797 2.690570
Triportheusangulatus (Spix & Agassiz, 1829) 0.595742 2.746460
Hemiodusunimaculatus (Bloch, 1794) 0.622580 -0.878750
Caenotropuslabyrinthicus (Kner, 1858) 0.632348 0.648210
Boulengerellamaculata (Valenciennes, 1850) 1.025970 -0.335890
Curimatainornata Vari, 1989 1.238580 0.507683
Curimatavittata (Kner,1858) 1.238580 0.507683
Cichla sp. 1.420020 -0.000190
Acestrhorhynchusfalcirostris (Cuvier, 1819) 1.516500 -0.199120
Hopliasmalabaricus (Bloch, 1794) 1.594580 -0.406270
Geophagusproximus (Castelnau, 1855) 1.905290 -0.727420
Chaetobranchusflavenscens Heckel, 1840 1.987890 -0.658540
Osteoglossumbicirrhosum (Cuvier,1829) 2.420040 -1.484380
SAINT-PAUL et al. 2000, SÚAREZ et al. 2001, HOEINGHAUS et al. 2003, SIQUEIRA-SOUZA & FREITAS 2004, SÚAREZ et al. 2004, 2011, FREITAS & GARCEZ 2004, FREITAS et al. 2013), our results suggest that fish assemblages are influenced by seasonal variations and are ruled by the flood pulse, which causes changes in transparency, depth, water current velocity and dissolved oxygen. Although not de-tected evidence of environment changes associated to the ac-tivities of oil extraction, this study represents a baseline for future studies associated with evaluation of eventual or cronic envi-ronmental impacts in the area.
ACKNOWLEDGMENTS
We wish to thank the National Institute for Amazonian Research and in particular J. Zuanon and H.M. Espírito-Santo for their help with the identification of the taxonomic mate-rial. T.C. Oliveira for guidance and support in the chemical analysis of the water.
LITERATURE CITED
AGOSTINHO AA, THOMAZ SM, GOMES LC (2005) Conservação da biodiversidade em águas continentais do Brasil. Megadiver-sidade 1: 70-78.
ALBRECHT MP, CARAMASCHI EP, HORN MH (2009) Population responses of two omnivorous fish species to impoundment of a Brazilian tropical river. Hydrobiologia 627: 181-193. doi: 10.1007/s10750-009-9727-7
CHESSON PL, HUNTLY N (1997) The roles of harsh and fluctuating conditions in the dynamics of ecological communities. American Naturalist 150: 520-553.
CLARKE KR, GREEN RH (1988) Statistical design and analysis for a ‘biological effects’ study.Marine Ecology Progress Series 46: 213-226.
CRAMPTON WGR (1999) Os peixes da Reserva Mamirauá: Diver-sidade e história natural na planície alagável da Amazônia, p. 10-36. In: QUEIROZ HL, CRAMPTON WGR (Eds.). Estratégias para Manejo de Recursos Pesqueiros em Mamirauá. Brasília, Sociedade Civil Mamirauá.
DUDGEON DA, ARTHINGTON AH, GESSNER MO, KAWABATA ZI, KNOWLER DJ, LEVEQUE C, NAIMAN RJ, PRIEUR-RICHARD AH, SOTO D, STIASSNY MJL, SULLIVAN CA (2006) Freshwater biodiversity: importance, threats, status and conservation challenges. Biological Review 81: 163-182. doi: 10.1017/S1464793105006950 EPA (1986) Test methods for evaluating solid waste, physical/
chemical methods; Method 8270C – Semivolatile organic compounds by gas chromatography/masspectrometry. U.S. Environmental Protection Agency. Available online at: http:/ /www.epa.gov/SW-864/main.htm [Accessed: 10/06/2008] ESTEVES FA (1998) Fundamentos de Limnologia. Rio de
Janei-ro, Interciência, 790p.
FERREIRA EJG, ZUANON JAS, SANTOS GM (1998) Peixes comerciais do médio Amazonas: Região de Santarém, Pará. Brasília,
IBAMA, 185p.
FERREIRA FS, VICENTIN W, COSTA FES, SÚAREZ YR (2014) Trophic ecology of two piranha species, Pygocentrus nattereri and
Serrasalmus marginatus (Characiformes, Characidae), in the
floodplain of the Negro River, Pantanal. Acta Limnologica Brasiliensia 26: 381-391. doi: 10.1590/S2179-975X2014000 400006
FREITAS CEC, GARCEZ RCS (2004) Fish communities of natural channels between floodplain lakes and Solimões-Amazo-nas river (Amazon-Brazil). Acta Limnologica Brasiliensis 16: 273-280.
FREITAS CEC, SIQUEIRA-SOUZA FK, PRADO KLL, YAMAMOTO RC, HURD LE (2010) Fish diversity in Amazonian floodplain lakes. International Journal of Medical and Biological Frontiers 16: 128-142.
FREITAS CEC, SIQUEIRA-SOUZA FK, FLORENTINO AC, HURD LE (2013) The importance of spatial scales to analysis of fish diversity in Amazonian floodplain lakes and implications for conservation. Ecology of Freshwater Fish 45: 1-8. doi: 10.1111/eff.12099
GOULDING M (1980) The fishes and the forest: Explorations in Amazonian Natural History. Berkeley, University of California Press, 280p.
HAMILTON SK, LEWIS WM (1990) Basin morphology in relation to chemical and ecological characteristics of lakes on the Orinoco River ûoodplain, Venezuela. Archives of Hydrobiology 119: 393-425.
HAMMER P, HARPER DAT, RYAN PD (2001) PAST: Paleontological statistics software package for education and data analysis. Paleontologia Eletrônica 4: 1-9.
HOEINGHAUS DJ, LAYMANA CA, ALBREY ARRINGTONA DA, WINEMILLER KO (2003) Spatiotemporal variation in fish assemblage structure in tropical floodplain creeks. Environmental Biology of Fishes67: 379-387.
JACKSON DA, PERES-NETO PR, OLDEN JD (2001) What controls who is where in freshwater fish communities – the roles of biotic, abiotic, and spatial factors. Canadian Journal of Fisheries and Aquatic Sciences 58: 157-170. doi: 10.1139/f00-239 JUNK WJ (1983) As águas da Região Amazônica, p. 45-100. In:
SALATI E, SCHUBART HOR, JUNK WJ, OLIVEIRA AE (Eds.). Amazô-nia: desenvolvimento, integração e ecologia. São Paulo, Editora Brasiliense.
KARR JR (1981) Assessment of biotic integrity using fish communities. Fish 6: 21-27.
KIKUCHI RM, UIEDA VS (1998) Composição da comunidade de invertebrados de um ambiente lótico tropical e sua varia-ção espacial e temporal, p. 157-173. In: NESSIMIAN JL, CARVA -LHO AL (Eds.). Ecologia de insetos aquáticos. Rio de Janei-ro, Série Oecologia Brasiliensis.
LOWE-MCCONNELL RH (1999) Estudos ecológicos em comuni-dades de peixes tropicais. São Paulo, EDUSP, 524p. MAGURRAN AE (2003) Measuring Biological Diversity. London,
NELSON JS (2006) Fishes of the World. New Jersey, Wiley, 601p. REIS RE (2003) Family Callichthyidae, p. 291-309. In: REIS RE, KULLANDER SO, FERRARIS CJ (Eds.) Checklist of the freshwater fishes of South and Central America. Porto Alegre, EDIPUCRS. RESENDE EK, PEREIRA RAC, ALMEIDA VLL, SILVA AG (1996) Alimen-tação de peixes carnívoros da planície inundável do rio Miranda, Pantanal, Mato Grosso do Sul, Brasil. Corumbá, Embrapa-CPAP, 56p.
RODRÍGUEZ MA, LEWIS WM (1997) Structure of fish assemblages along environmental gradients in floodplain lakes of the Orinoco River. Ecological Monographs 67: 109-128. SAINT-PAUL U, SOARES MGM (1987) Diurnal distribution and
behavioral responses of fishes to extreme hypoxia in Amazon floodplain lake. Environmental Biology of Fish20: 91-104. SAINT-PAUL U, ZUANON JAS, CORREA MAV, GARCIA M, FABRÉ NN, BERGER U, JUNK WJ (2000) Fish communities in central Amazonian white and blackwater floodplains. Environmental Biology of Fish 57: 235-250.
SANTOS G, FERREIRA E, ZUANON JAS (2006) Peixes Comerciais de Manaus. Manaus, INPA, 144p.
SILVANO RAM, AMARAL BD, OYAKAWA OT (2000) Spatial and tempo-ral patterns of diversity and distribution of the Upper Juruá River fish community (Brazilian Amazon). Environmental Biology of Fish 57: 25-35. doi: 10.1023/A:1007594510110 SIQUEIRA-SOUZA FK, FREITAS CEC (2004) Fish diversity of floodplain
lakes on the lower stretch of the Solimões river. Brazilian Journal of Biology 64: 501-510. doi: 10.1590/S1519-69842004000300013
SOARES MGM, JUNK WJ (2000) Commercial fishery and fish culture of the state of amazonas: status and perspectives, p.
433-461. In: JUNK WJ, OHLY JJ, PIEDADE MTF, SOARES MGM (Eds.). The Central Amazon Floodplain: actual use and options for a sustainable management. Leiden, Backhuys Publishers.
STEWART JD, IBARRA M, BARRIGA-SALAZAR R (2002) Comparison of deep-river and adjacent sandy-beach fish assemblages in the Napo river basin, eastern Ecuador. Copeia 2: 333-343. SÚAREZ YR, PETRERE JR M, CATELLA AC (2001) Factors determining
the structure of fish communities in Pantanal lagoons (MS, Brazil). Fisheries Management and Ecology 8: 173-186. SÚAREZ YR, PETRERE JR M, CATELLA AC (2004) Factors regulating diversity
and abundance of fish communities in Pantanal lagoons, Brazil. Fisheries Management and Ecology 11: 45-54.
SÚAREZ YR, SOUZA MM, FERREIRA FS, PEREIRA MJ, SILVA EA DA, XIMENES LQL, AZEVEDO LG DE, MARTINS OC, LIMA JÚNIOR SE (2011) Patterns of species richness and composition of fish assemblages in streams of the Ivinhema River basin, Upper Paraná River. Acta Limnologica Brasiliensia 23: 177-188.
TE J E R I N A-GA R R O FL, FO R T I N R, RO D R I G U É Z MA (1998) Fish community structure in relation to environmental variation in floodplain lakes of the Araguaia River, Amazon Basin. Environmental Biology of Fishes 51: 399-410.
WINEMILLER KO (1989) Patterns of variation in life history among South American fishes in seasonal environments. Oecologia 81: 225-241.
WOLDA H (1981) Similarity indices, sample size and diversity. Oecologia 50: 296-302.
YAMAMOTO KC, SOARES MGM, FREITAS CEC (2004) Alimentação de
Triportheus angulatus (Spix & Agassiz, 1829) no lago Camaleão, Manaus, AM, Brasil. Acta Amazonica 34: 653-659.
Appendix 1. Numerical abundance and biomass data of the species collected during the flood and (drought) seasons in the Urucu River, Municipality of Coari – AM/Brazil.
Taxa Abundance Biomass (g)
Osteoglossiformes Osteoglossidae
Osteoglossumbicirrhosum (Cuvier,1829) 0(55) 0(45506)
Clupeiformes Pristigasteridae
Pellonacastelnaeana (Valenciennes, 1847) 32(0) 14235(0)
Pellonaflavipinnis (Valenciennes, 1836) 22(4) 7355(1985)
Engraulidade
Lycengraulisbatesii (Günther, 1868) 7(1) 385(25)
Beloniformes Belonidae
Potamorrhaphisguianensis (Jardine, 1843) 1(0) 40(0)
Characiformes Acestrorhynchidae
Acestrhorhynchusfalcirostris (Cuvier, 1819) 1(28) 0(4289)
Acestrorhynchusfalcatus (Bloch, 1794) 3(0) 700(0)
Acestrorhynchusmicrolepis (Schomburgk, 1841) 1(0) 115(0)
Appendix 1. Continued
Taxa Abundance Biomass (g)
Agoniatidae
Agoniateshalecinus (Müller & Troschel, 1845) 11(14) 510(505)
Anostomidae
Abramiteshypselonotus (Günther, 1868) 0(2) 0(75)
Leporinusagassizi Steindacherner, 1876 14(16) 5300(5920)
Leporinusfasciatum (Bloch, 1794) 3(2) 810(270)
Schizodonfasciatus Spix & Agassiz, 1829 0(1) 0(585
Rhytiodusargenteofuscus Kner, 1858 3(0) 710(0)
Characidae
Brycon cf. pesu Müller Troschel, 1845 16(6) 1210(55)
Bryconmelanopterus (Cope, 1872) 0(4) 0(800)
Bryconopsalburnoides (Kner, 1858) 64(5) 2195(145)
Bryconopscaudomaculatos (Günther, 1864) 8(1) 235(45)
Chalceuserythrurus (Cope, 1870) 2(19) 145(1370)
Moenkhausialepidura (Kner, 1858) 14(5) 245(180)
Myleusrubrypinnis (Müller & SchomburgK, 1841) 4(5) 1045(465)
Myleus sp. 1(0) 135(0)
Mylesinusschomburgkii Valenciennes, 1850 1(0) 745(0)
Poptellabrevispina Reis, 1989 1(0) 35(0)
Pristobryconstriolatus (Steindachner, 1908) 6(0) 935(0)
Pygocentrusnattereri Kner, 1858 12(5) 1830(1330)
Serrasalmusaltispinis Merckx, Jégu & Santos, 2000 0(2) 0(320)
Serrasalmus sp. 0(6) 0(7775)
Serrasalmusrhombeus (Linnaeus, 1766) 54(44) 11680(245)
Tetragonopteruschalceus Spix & Agassiz, 1829 1(0) 90(0)
Triportheusalbus Cope, 1872 16(6) 570(645)
Triportheusangulatus (Spix & Agassiz, 1829) 0(7) 0(678)
Triportheuselongatus (Günther, 1864) 1(0) 150(0)
Chilodontidae
Caenotropuslabyrinthicus (Kner, 1858) 2(9) 240(80)
Ctenoluciidae
Boulengerellacuvieri (Agassiz, 1829) 2(0) 630(0)
Boulengerellamaculata (Valenciennes, 1850) 3(22) 410(3729)
Curimatidae
Curimata cf. cisandina (Allen, 1942) 1(0) 95(0)
Curimatainornata Vari, 1989 0(33) 0(2195)
Curimatavittata (Kner,1858) 1(3) 135(200)
Cyphocharaxnotatus (Steindachner, 1908) 0(2) 0(70)
Psectrogasteramazonica Eigenmann & Eigenmann, 1889 1(0) 150(0)
Psectrogasterrutiloides (Kner, 1858) 4(0) 590(0)
Steindachnerinabimaculata (Steindachner, 1876) 0(1) 0(95)
Cynodontidae
Cynodongibbus Spix & Agassiz, 1829 3(0) 260(0)
Raphiodonvulpinus Spix & Agassiz, 1829 5(0) 2440(0)
Erytrinidae
Hopliasmalabaricus (Bloch, 1794) 1(9) 40(400)
Hemiodontidae
Hemiodussemitaeniatus (Kner, 1858) 2(6) 150(390)
Hemiodusunimaculatus (Bloch, 1794) 7(36) 900(3745)
Anodusorinocensis (Steindachner, 1887) 1(0) 145(0)
Submitted: 3 December 2014 Received in revised form: 22 June 2015 Accepted: 6 October 2015
Editorial responsibility: Vinicius Abilhoa
Appendix 1. Continued.
Taxa Abundance Biomass (g)
Siluriformes Loricariidae
Ancistrus sp. 0(1) 0(35)
Dekeyseriaamazonica (Rapp Py-Daniel, 1985) 1(0) 95(0)
Loricariacataphracta Linnaeus, 1758 0(1) 0(20)
Rineloricaria sp. 0(4) 0(100)
Sturisoma sp. 0(2) 0(100)
Hypoptopoma cf. gulare Cope, 1878 24(1) 170(20)
Auchenipteridae
Ageneiosusbrevifilis (Linnaeus, 1766) 1(0) 375(0)
Ageneiosus gr. vittatus (Steindachner, 1908) 1(0) 10(0)
Auchenipterichthys sp. 2(0) 30(0)
Auchenipterusambyacus (Fowler,1915) 2(0) 70(0)
Auchenipterusnuchalis (Spix & Agassiz, 1829) 2(0) 205(0)
Centromochusheckelli (De Felippi, 1853) 2(0) 35(0)
Parauchenipterusgaleatus (Linnaeus, 1758) 5(0) 200(0)
Tatiaintermedia (Steindachner, 1877) 2(0) 70(0)
Callichthyidae
Dianemaurostriatum (Miranda Ribeiro, 1912) 63(0) 1030(0)
Pimelodidae
Calophysusmacropterus (Lichtenstein, 1819) 28(15) 7230(325)
Hemisorubimplatyrhynchos (Valenciennes, 1840) 0(8) 0(5022)
Hypophtalmusedentatus Spix & Agassiz, 1829 2(0) 533(0)
Hypophtalmusmarginatus Valenciennes,1840 2(0) 195(0)
Pimelodusblochii (Valenciennes, 1840) 5(4) 490(285)
Pinirapuspirinanpus (Spix & Agasiz, 1829) 4(0) 1320(0)
Pseudoplatystomafasciatum (Linnaeus, 1766) 1(0) 1085(0)
Sorubimlima (Bloch & Schneider, 1801) 4(0) 550(0)
Perciformes
Cichlidae
Biotodomacupido (Heckel, 1840) 0(6) 0(155)
Chaetobranchusflavenscens Heckel, 1840 0(7) 0(1580)
Cichla sp. 0(10) 0(1760)
Cichlamonoculus (Spix & Agassiz, 1831) 0(2) 1765(225)
Crenicinchlacincta Regan, 1905 1(0) 460(0)
Geophagusproximus (Castelnau, 1855) 0(9) 0(1185)
SatanopercaJurupari (Heckel, 1840) 0(1) 0(190)
Scianidae
Plasgioscionsquamosissimus (Heckel, 1840) 8(6) 2340(1140)
Pleuronectiformes Achiridae