P e r g a m o n 0 1 4 6 - 6 3 8 0 ( 9 4 ) 0 0 0 8 3 - 2
Org. Geochem. Vol. 22, No. 1, pp. 11-25, 1995 Elsevier Science Ltd. Printed in Great Britain
Source rock/dispersed organic matter characterization---TSOP
Research Subcommittee Results
S. C. TEERMAN, 1 B. J. CARDOTT, 2 R. W. HARDING, 3 M. J. LEMOS DE SOUSA, 4 D. R. LOGAN, 5 H. J. PINHEIRO, 4 M. REINHARDT, 6 C. L. THOMPSON-RIZER 7 and R. A. WOODS 7
*Chevron Petroleum Technology Co., P.O. Box 446, La Habra, CA 90633, U.S.A. 2Oklahoma Geological Survey, I00 E. Boyd St, Norman, OK 73019, U.S.A.
3Simon-Robertson, Gwynedd LL30 ISA, U.K.
4Organic Petrology Unit, Department of Geology, University of Porto, Praca Gomes Teixeira, 4000 Porto, Portugal
SPhillips Petroleum Co., 254 Geosciences Bid, Bartlesville, OK, U.S.A. 6International Geological Consultant, Martinstr. 4, 30659 Hannover, Germany
7Conoco Inc., P.O. Box 1267, Ponca City, OK, U.S.A.
Abstract--Because sedimentary organic matter consists of a diverse mixture of organic components with different properties, a combination of chemical and petrographic results offers the most complete assessment of source rock properties. The primary purpose of this Society for Organic Petrology (TSOP) subcommittee is to contribute to the standardization of kerogen characterization methods. Specific objectives include: (1) evaluation of the applications of different organic matter (petrographic) classifi- cations and terminology, and (2) integration of petrographic and geochemical results. These objectives were met by completing questionnaires, and petrographic, geochemical and photomicrograph round-robin exercises. Samples that were selected for this study represent different petrographic and geochemical properties, and geologic settings to help identify issues related to the utilization of different classifications and techniques. Petrographic analysis of the organic matter was completed using both a prescribed classification and the individual classification normally used by each participant. Total organic carbon (TOC), Rock-Eval pyrolysis and elemental analysis were also completed for each sample. Significant differences exist in the petrographic results from both the prescribed and individual classifications. Although there is general agreement about the oil- vs gas-prone nature of the samples, comparison of results from individual classifications is difficult due to the variety of nomenclature and methods used to describe an organic matter assemblage. Results from the photomicrograph exercise document that different terminology is being used to describe the same component. Although variation in TOC and Rock-Eval data exists, geochemical results define kerogen type and generative potential. Recommen- dations from this study include:
(1) A uniform organic matter classification must be employed, which eliminates complex terminology and is capable of direct correlation with geochemical parameters.
(2) A standardized definition and nomenclature must be used for the unstructured (amorphous) organic matter category. Subdivisions of this generalized amorphous category are needed to define its chemical and environmental properties.
(3) Standardized techniques including multimode illumination, types of sample preparations and data reporting will help eliminate variability in the type and amount of organic components reported.
Key words---organic petrology, organic matter classification, maceral, amorphous, multimode illumina- tion, petrographic and geochemical integration, kerogen, source rock
INTRODUCTION AND BACKGROUND
Effective petrographic identification of individual constituents in sedimentary organic matter can describe source rock properties, provide insight into depositional conditions, and define thermal maturity. Petrographically, dispersed organic matter is generally divided into structured and unstructured components. Structured organic matter includes the liptinite, vitrinite, and inertinite macerals, and zooclasts (faunal remains), which are well under- stood. Because unstructured or amorphous organic
matter originates from a variety of precursors and processes, it varies in petrographic, physical, and chemical properties. The chemical composition of amorphous material can vary from hydrogen-rich to hydrogen-poor for a given thermal maturity (Tissot and Welte, 1984). Petrographic identification and characterization of unstructured organic matter is important because it is a major component of most hydrocarbon source rocks. However, grouping unstructured organic matter into a single generalized category prevents interpretation of its hydro- carbon generative potential and paleoenvironmental
12 S . C . TEERMAN et al. properties. Numerous terms have been used to
describe "unstructured" organic matter, which con- tributes to confusion in the characterization of this material. Clearly defined and well accepted terminol- ogy is essential for the effective description and characterization of unstructured organic matter.
Sedimentary organic matter consists of material insoluble in normal organic solvents (kerogen) and a soluble fraction (bitumen). Chemically, kerogen is classified into types I, II, III and IV (Tissot et al., 1974; Harwood, 1977) based on elemental analysis (atomic H/C and O/C). Rock-Eval pyrolysis, which can be used to infer kerogen types, has become a standard method for the chemical evaluation of source rocks. Because a specific kerogen type often consists of a diverse mixture of chemically distinct organic com- ponents that react differently during maturation, a combination of chemical and petrographic results offer the most complete assessment of source rock properties. Therefore, it is important for organic petrographic results to complement and correlate with geochemical data and geological results. Previous studies have documented the application and import- ance of this integrated approach (Jones and Edison, 1978; Larter, 1985; Thompson and Dembicki, 1986). Organic petrology applied to source rock evalu- ation has evolved from both coal petrology and palynology. Because of the many approaches and goals of organic petrology, a wide variety of tech- niques and classifications are used. Powell et al. (1982) indicated that the following factors often contribute to a poor correlation between optical and chemical results: unrepresentative kerogen concentrates, in- adequate definition of amorphous kerogen and in- adequate quantitative estimation of organic matter components. Effective utilization of organic petrology to characterize dispersed organic matter will require a uniform approach. An organic matter classification and its corresponding applications must have a strong scientific basis and provide: (1) acceptable limits of reproducibility for inter- and intra-laboratory results, (2) timely and cost efficient results, (3) data that can be applied by both organic petrologists and other earth scientists, (4) answers to industrial and academic problems, and (5) support of geochemical techniques by an integrated and comparative approach.
At the 1987 annual meeting of The Society for Organic Petrology (TSOP), a research subcommittee was formed to review problems related to the inte- gration of organic petrographic data with geologic and geochemical data. An initial TSOP study "Influ- ence of Kerogen Isolation Methods on Petrographic and Bulk Chemical Composition Of A Woodford Shale Sample" was completed by Senftle (1989).
OBJECTIVES T S O P Research Subcommittee
The overall purpose of this subcommittee is to contribute to the standardization of kerogen
characterization methods. Primary objectives of this subcommittee include: (1) evaluation of the appli- cations of different organic matter (petrographic) classifications and terminology, and (2) integration of petrographic and geochemical results. Secondary ob- jectives include evaluation of: (1) techniques for petrographic analysis (light modes, types of sample preparations, etc.), (2) kerogen isolation procedures and (3) methods of sample preparation. There is an urgent need to meet these objectives to provide a standardized and usable system of organic petro- graphic results.
This TSOP subcommittee will complement
International Committee for Coal Petrology (ICCP) objectives for the standardization of kerogen characterization methods. ICCP working groups on related subjects include isolation of organic matter and organic matter classifications.
Present T S O P study
Specific objectives for this study include:
(1) Circulation of a questionnaire to compile and understand petrographic and geochemical methods of kerogen characterization. (2) Petrographic and geochemical round-robin
analysis of four samples to evaluate: (1) appli- cation of various organic matter terminology and classifications. (2) different petrographic techniques to characterize dispersed organic matter, and (3) geochemical techniques for evaluating kerogen quality.
(3) Round-robin description of photomicrographs of the four samples to directly compare nomen- clature and properties used to define specific organic components.
Results of this study will contribute to identifying and standardizing methods to characterize dispersed organic matter, and integrate petrographic and geochemical results. Although different methods of kerogen isolation lead to discrepancies in petro- graphic and geochemical results, standardization of preparation procedures was not a primary objective of this specific study.
SAMPLES AND PROCEDURES
This specific study involves eight subcommittee members representing industrial, government and academic groups. Participants are a mix of European and North American organic petrologists and geo- chemists. All individuals or laboratory groups that were committed to completing the petrographic and geochemical analyses in the given time were invited to participate. Identification of participant results has been kept confidential to ensure objectivity and en- courage participation by all laboratories.
Source rock/dispersed organic matter characterization
Table I. Sample name, location, and geologic information
Sample No. 1 2 3 4*
Group Wilcox Mesa Verde
Formation Monterey Ohio Shale Tropic Shale
Member Cleveland
Lithology Shale Shale Shale Coal
Age Eocene Miocene Miss./Dev. Cretaceous
Location Hallsville, TX Arroyo, CA Lewis Co., KY Kane Co., UT
Site Sabine mine Outcropt Outcropt Underground mine
*Penn State Coal Sample Bank (PSOC No. 1109).
tOutcrop samples contain only minor weathering, which does not affect study objectives.
13
matter that represent different depositional con- ditions, geologic age, and wt% total organic carbon (TOC), These samples have a wide range of petro- graphic and geochemical properties, which help identify issues and questions related to different classifications, techniques, and sample types. Some of these samples were selected because of their difficult petrographic characteristics. Each participating laboratory was provided with representative splits consisting of 5-10g of unprocessed rock. Sample names, locations and geologic information are listed in Table 1.
Each laboratory completed kerogen isolation and sample preparation using their normal procedures. A maceral or visual kerogen analysis was requested using both a prescribed classification and the individ- ual classification normally used by each participant. The prescribed classification includes the following categories: amorphous, structured liptinite, vitrinite, inertinite, and other (solid bitumen, zooclasts, etc.), which is generally similar to proposed categories by the ICCP. Subdivisions of the prescribed categories were encouraged. Each participant completed a mac- eral analysis using their own petrographic techniques but were asked to provide: (1) descriptions of sample preparation procedures, (2) types of light modes and sample preparations used, and (3) presentation of results using their typical format (maceral percent- ages or description).
Participants were asked to complete wt% TOC and Rock-Eval pyrolysis to geochemically evaluate each sample. However, not all participants had access to geochemical instrumentation. Each laboratory was encouraged to conduct other geochemical analyses if possible.
In addition, sample splits were sent to various commercial laboratories for wt% TOC, Rock-Eval pyrolysis (whole rock and kerogen) and elemental analyses (atomic H/C and O/C). Kerogen isolation for these analyses was completed at a single locality to eliminate variables related to processing. Although samples were sent to commercial laboratories, con- tractor evaluation was not an objective of this study. Photomicrographs illustrating specific organic components from the four samples were distributed to determine: (1) nomenclature used by each partici- pant to describe specific organic component(s), and (2) how a specific component fits into their classifi- cation. Photomicrographs represent both whole rock
and isolated kerogen preparations (strew mounts and reflectance preparations). Input was also solicited concerning: (1) other terminology that can describe the component, (2) application of certain sample preparations, preparation techniques or light modes to effectively identify the component, and (3) hydro- carbon potential or environmental significance of an individual component.
RESULTS AND DISCUSSION Questionnaire summary
A summary of questionnaire results indicates:
(1) The primary objectives of petrographic evalu- ation of dispersed sedimentary organic matter are to define thermal maturity and kerogen
quality/hydrocarbon generative potential.
Geologic information is secondary. Geo- chemists and geologists are the main users of organic petrographic data.
(2) Most laboratories use both geochemical and petrographic techniques to evaluate kerogen quality. Geochemical results are often used more extensively, and used to select samples for petrographic analyses. Most laboratories com- pare or integrate petrographic and geochemical results in some manner.
(3) For petrographic analysis, most laboratories use a variety of sample preparations and light modes but with different priorities. Results are often combined, depending on the specific sample. Petrographic results are usually reported to the nearest 1-5% (of the total organic matter assemblage in the sample prep- aration) and incorporated into a computerized data base. Maceral groups are often subdivided for different applications. Most laboratories formally or informally subdivide "amorphous organic matter" using different petrographic properties.
Maceral analysis
14 S. C. TEERMAN et al.
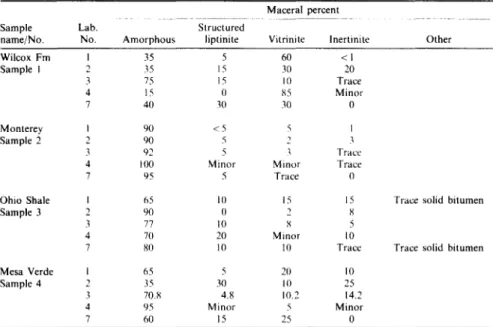
Table 2. Maceral results lbr T S O P samples--prescribed classification
Maceral percent
Sample Lab. Structured
name/No. No. A m o r p h o u s liptinite Vitrinite lnertinite Other
Wilcox F m I 35 5 60 < I
Sample I 2 35 15 30 20
3 75 15 10 Trace
4 15 0 85 Minor
7 40 q0 3(1 0
Monterey I 90 < 5 ~ I
Sample 2 2 90 5 2 3
3 92 5 ~ Trace
4 H)0 Minor Minor Trace
7 95 5 Trace 0
Ohio Shale I 65 10 15 15
Sample 3 2 90 0 2 8
3 77 10 S 5
4 7(I 20 Minor 10
7 80 10 I0 Trace
Mesa Verde I 65 5 20 10
Sample 4 2 35 30 10 25
3 70.8 4.8 10.2 14.2
4 95 Minor 5 M i n o r
7 60 15 25 0
Trace solid bitumen
Trace solid bitumen
Note: Not all participants provided data for prescribed classification.
the prescribed classification are listed in Table 2. Good agreement exists for the Monterey sample, which contains predominantly amorphous organic matter. Results for the other three samples, however, display differences in the relative proportions of the amorphous and structured categories. Unfortunately, not all laboratories reported results for the prescribed classification.
Differences in reported amounts of vitrinite and inertinite for individual samples are related to: (1) the exclusive use of transmitted or reflected light, (2) type of sample preparation utilized, and (3) petrographic properties used to distinguish the two macerals. Vari- ation in structured liptinite content for individual samples is related to different definitions used by various laboratories, and the light mode and type of sample preparation used.
The absence of a standardized definition for the amorphous category contributes to discrepancies in maceral results. For the Wilcox sample, the gradational nature of the amorphous-structured vitrinite contributes to the variation in the reported amorphous content. For the Mesa Verde sample, poor distinction between alginite and amorphous components, and the bituminite-amorphous termi- nology contribute to variation in maceral results.
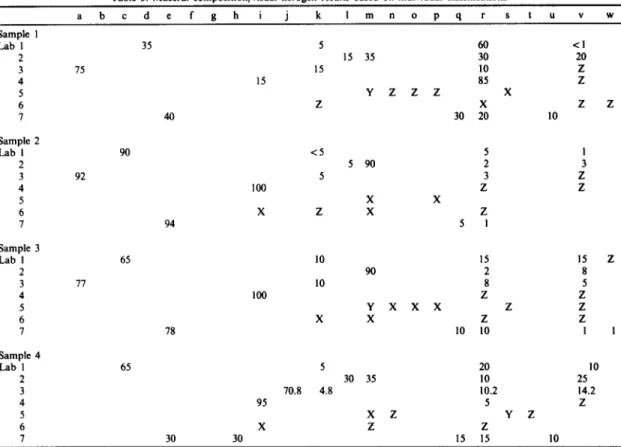
Results of individual classifications shown in Table 3 generally identify the oil-prone nature of the Monterey, Ohio Shale and Mesa Verde samples, and the gas-prone Wilcox assemblage. However, close comparison of results from individual classifi- cations is difficult due to the wide variety of nomen- clature and categories used to describe an organic matter assemblage. Comparison is also difficult because both numerical and descriptive terms are used to report maceral content. Numerous terms
were used in this exercise to describe unstructured organic matter: amorphous, sapropel, sapropelites, alginite, bituminite, SOM (structureless organic matter and sedimentary organic matter), liptinite, amorphogen, organo-mineral matrices, and herba- ceous. Individual classifications are shown in Appendix 1.
Although each laboratory may be internally con- sistent and capable of interpreting their results, the large intra-laboratory variation makes interpretation of individual results difficult. Much of this variability is related to the method and classification used to define maceral composition. For the prescribed and individual classifications, inconsistent results are re- lated to: (1) absence of uniform guidelines in classify- ing organic matter, (2) variation in terminology used to describe organic components, especially amor- phous material and (3) different light modes and types of sample preparations used to petrographically evaluate the organic matter.
A uniform classification and terminology will contribute to eliminating discrepancies in identifying the type of structured organic components and evaluation of amorphous material. Numerical determination of the relative abundance of organic matter components would contribute to effective comparison of laboratory results.
Source rock/dispersed organic matter characterization
Table 3. Maeeral composition/visual kerogen results based on individual classifications
15
a b c d e f g h i j k I m n o p q r s t u v w
Sample 1
Lab 1 35 5 60 <1
2 15 35 30 20
3 75 15 10 Z
4 15 85 Z
5 Y Z Z Z X
6 Z X Z
7 40 30 20 10
Sample 2
Lab I 90 < 5 5 1
2 5 90 2 3
3 92 5 3 Z
4 100 Z Z
5 X X
6 X Z X Z
7 94 5 1
Sample 3
Lab 1 65 10 15 15 Z
2 90 2 8
3 77 10 8 5
4 100 Z Z
5 Y X X X Z Z
6 X X Z Z
7 78 10 10 1 I
Sample 4
Lab 1 65 5 20 10
2 30 35 10 25
3 70.8 4.8 10.2 14.2
4 95 5 Z
5 X Z Y Z
6 X Z Z
7 30 30 15 15 10
a, amorphous, unspecified; b, amorphous group 1; c, amorphous group 2; d, amorphous group 3; e, amorphous A; f, amorphous B; g, amorphous C; h, amorphous D; i, sapropel; j, bituminite; k, structured liptinite; I, exinite; m, alginite; n, resinite; o, sporinite; p, SOM; q, herbaceous; r, vitrinite/huminite; s, telocollinite; t, desmocollinite; u, woody; v, inertinite; w, bitumen/exsudate; x, abundant/frequent; y, common; z, rare/minor/present/trace.
Photomicrographs
Results from the photomicrograph exercise indi- cate that different terminology is being used to de- scribe the same component. Although differences in terminology can sometimes be understood, it often leads to discrepancies and confusion. Issues that became evident from this exercise include:
(1) The distinction between vitrinite and inertinite is subjective when using only transmitted light. The opaque nature of these macerals can be related to composition and/or particle thickness.
(2) It is difficult to consistently distinguish between amorphous and structured vitrinite in samples containing "degraded" vitrinite (Wilcox Fm) or "dense consolidated" amorphous material (Ohio Shale).
(3) Multimode illumination (transmitted, reflected and fluorescence) and utilization of a variety of sample preparations are important to identify and classify organic matter.
(4) There needs to be a better correlation and standardization of terms when different light modes and sample preparations are used. (5) A consistent application of nomenclature needs
to be established to describe fluorescent par- ticles that do not display distinct morphology.
(6) Elimination or replacement of the term herbaceous should be considered, or a clear definition of the term and its correlation to other terminology needs to be established. (7) Organic petrologists are not always comfort-
able working with both isolated kerogen and whole rock sample preparations.
(8) A better correlation needs to be developed between the identification and characterization of unstructured organic matter in isolated kerogen preparations and whole rock. (9) There is difficulty in identifying and classifying
unstructured organic matter in reflected light preparations of isolated organic matter.
Representative photomicrographs of the round robin analysis, which illustrate specific organic components and corresponding issues, are shown in Plate 1.
16 S.C. TEERMAN el al. matter (Combaz, 1964, 1974, 1975, 1980; Burgess,
1974; Raynaud and Robert, 1976; Batten, 1977; Fisher, 1977; Hunt, 1979; D u r a n d and Nicaise, 1980; Alpern, 1980; Robert, 1981; Gutjahr, 1983; Tissot and Welte, 1984; Suzuki, 1984; Mukhopadhyay et al., 1985; Thompson and Dembicki, 1986; Teichmuller, 1986; Senftle et al., 1987). The term amorphinite was defined by van Gijzel (1982) and has been proposed by the ICCP to describe the group of material which exhibits no discrete form or shape.
Other terms used to describe amorphous organic matter sometimes erroneously imply that the material has an algal origin and is always oil-prone. Although confusion exists, alginite has been defined by the ICCP (1976) as a structured component consisting of specific recognizable algal remains (Botryococcus, Tasmanites, Gloeocapsarnorpha prisca, etc.). There- fore, alginite is separated from amorphous material, which lacks distinctive morphology and originates from various precursors. Many other terms describ- ing amorphous material subjectively interpret its origin and are confusing to non-experts.
Another term used to describe unstructured organic matter is bituminite. Bituminite, originally described by Teichmuller (1974) in coals, was accepted as a component of primary sedimentary organic matter by the ICCP in 1988. It exhibits no specific form but often occurs as a fine-grained groundmass, irregular laminae or pod-like masses. Teichmuller (1986) states that bituminite represents a bacterial decompositional product of algae and plankton with input of bacterial biomass. Sub- divisions of bituminite have been described by Teichmuller and Ottenjann (1977) and Creaney (1980), which suggest a variety of precursors, preser-
vational conditions and chemical properties similar to amorphous organic matter. There is an important need to standardize terminology for unstructured organic matter, including the bituminite-amorphous terms.
In mature and post-mature source rocks, bitumen (a secondary material) can be an important com- ponent that can have an amorphous appearance (Jacob, 1989; Alpern et al., 1992, 1993). This material, which has a wide range of petrographic and geochemical properties, needs to be distinguished from structured and amorphous components. The classification and interpretation of this component can have important implications to source rock stud- ies.
Geochemical analyses
Rock-Eval pyrolysis and wt% TOC were com- pleted by six participants and three commercial lab- oratories. The Monterey, Ohio Shale, and Mesa Verde Coal appear to consist of a Type II kerogen; the Wilcox is a Type III kerogen. Rock-Eval Hydro- gen Index and Oxygen Index (HI-OI) results for the four samples are displayed on a modified van Kreve- len diagram in Fig. 1. Differences in the $2/$3 are helpful in separating oil-prone assemblages ( > 5 ) from the gas-prone Wilcox sample. Rock-Eval $2 values help define generative potential of these samples.
HI results from individual laboratories generally show good agreement for characterizing these four samples. Although variation in H I - O I values > 100mg HC/g OC and 50mg CO2/g OC exist respectively for a single sample, results define kerogen quality and their oil- vs gas-prone nature. W t % TOC
(Plate I on Jacing page)
Plate. 1. Photomicrographs of TSOP samples. Round robin participants were asked to describe and discuss properties, classification and nomenclature used for the organic components labeled in each
photomicrograph.
1A & B. Wilcox Formation. (A) Transmitted white light, isolated organic matter. (B) Epi-fluorescence, same field of view as (A). l, Does particle represent structured vitrinite or amorphous material? How is the boundary between structured vitrinite and amorphous organic matter defined? 2, Describe classifi- cation or subdivision of amorphous material based on petrographic properties. 3, Name of fluorescent
component that lacks specific morphology.
2A & B. Ohio Shale. (A) Transmitted white light, isolated organic matter. (B) Epi-illumination, white light; reflectance preparation of isolated organic matter. 2(A) and (B) represent separate fields of view. 1, Name or classification of particle. 2, Classification of amorphous material [same material as in 2(B) # 4]. 3, Does particle represent an amorphous or vitrinitic component? 4, Classification of organic component (bituminite vs amorphous terminology). Compare with component # 2 in transmitted light. 5. Classifi-
cation or name of particle.
3A & B. Monterey Formation. (A) Transmitted white light of isolated organic matter. (B) Same field of view as (A) in epi-fluorescence. 1, Based on petrographic properties, how would this amorphous material be classified? How does this material differ from the Wilcox amorphous organic matter in I(A) and (B) (similar level of thermal maturity). 2, Name or classification of fluorescent particle. How important are these particles in the petrographic characterization of the organic assemblage. 3, Name or classification
of particle. What do the opaque particles represent?
4A & B. Mesa Verde Coal. (A) Epi-illumination reflected white light; whole rock preparation. (B) Epi-fluorescence; same field of view as (A). Describe the dominant type of organic constituent in the
sample. 1, Name and classification of fluorescent component.
For each photomicrograph, describe how additional sample preparations and light modes would assist in the classification of the organic assemblage: 1, application of reflected white light (1 and 3), 2, use of whole rock preparations (1, 2, 3), 3, application of fluorescence (2), 4, use of transmitted light to evaluate
Source rock/dispersed organic matter characterization 17
1A&B Wilcox Fm. I 25p.m I
2A&B Ohio Shale
3A&B Monterey Fm.
4A&B Mesa Verde Coal
Plate l--legend opposite
I
I~ S. (7. TEERMAN et al.
1000
i
-?5,
~ 4
3 8 0 0O 5
. ~ ~ 7
O II u A
- r
_ca 6 0 0 ~ B
k ; o C
x
e) L a b 2
"0
_c 400 HI = 115
~ 200
-r-
/I
"-- x II1
0 50 1 O0 150 200 250
Oxygen Index (mg COdg Corg)
TSOP Sample 1. Wilcox Formation, Texas
1000
c~
~ 8 0 0 O
,1,-
m 600
g
x
0
"O
-=400
t - 0
:~ 200 -t"
I
0 I J ~ I I I a
0 50 100 150 200
Oxygen Index (mg CO2/g Corg)
TSOP Sample 2. Monterey Formation, California L a b 2 HI = 4 4 6
250
1000 I Lab
~ 81111
e, 7
II o A
em 6 0 0 0 B
x
L a b 2 "0
--
¢ 400 HI = 476
- t -
O
0 50 100 150 200
Oxygen Index (mg CO2/g Corg)
TSOP Sample 3. Ohio Shale, Kentucky
250
1000
~ 0 o
, r
~ 6 0 0
g
"O
-~ 4OO
C
P
"D " r 200 -
))
0 0
/ '
"~1 '' ' ~ III
I i I
50 100 150 200
Oxygen Index (mg CO2/g Corg)
TSOP Sample 4. Mesa Verde Coal, Utah
n A B
L a b 2 HI = 5 3 7
250
Fig. 1. Rock-Eval Hydrogen and Oxygen Index results from individual laboratories 1"o1" TSOP samples (whole rock). Note Lab. No. 2 did not provide Oxygen Index values.
and Rock-Eval data from each laboratory are listed in Table 4. Consistent patterns appear in H I - O I results for individual laboratories. Differences in HI and OI are related to variation in both TOC, and $2 and $3 values, respectively. Sometimes, differences in TOC and $2 compensate each other resulting in similar HI values. Except for the Wilcox sample, the Ol is not extremely useful in sample characterization. Variation of laboratory re- sults for individual samples are related to sample preparation, instrumentation, and analytical pro- cedures.
Rock-Eval HI Ol values of isolated kerogen from three contractor laboratories display good agreement for each sample (Fig. 2 and Table 5). Generally, HI and Ol results are similar for isolated kerogen and corresponding whole rock analyses. However, Ohio Shale and Monterey Formation HI values of isolated
kerogen are approximately 75 and 100 mg HC/g OC higher, respectively.
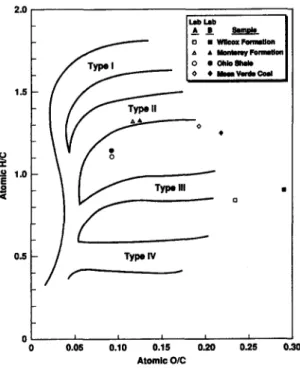
Atomic H/C values display good agreement for individual samples (Fig. 3 and Table 6); however. results are based on analysis from only two contrac- tor laboratories. In contrast to the HI, the atomic H/C more accurately defines the Ohio Shale as a Type II/III kerogen, which agrees with petrographic results. Rock-Eval sometimes has limitations in defining kerogen quality for mixed organic assem- blages (Scott, 1992).
Minor differences occur in the atomic O/C ratios for relatively oxygen-rich samples. Compared to Rock-Eval Ol values, the atomic O/C effectively defines the nature of these kerogens and their position on maturation pathways.
S o u r c e r o c k / d i s p e r s e d o r g a n i c m a t t e r c h a r a c t e r i z a t i o n Table 4. Rock-Eval pyrolysis results for TSOP samples (whole rock)
19
T O C SI $2 S3 PI HI OI Tin, ~
Sample Lab. (wt%) (mg HC/g Rk) ( m g H C / g Rk) ( m g C O 2 / g Rk) (SI/S1 + S2) S2/$3 ( m g H C / g OC) ( m g C O 2 / g OC) (°C)
Sample 1 I 3.45 0.25 3.28 1.53 0.07 2.14 95 44 423
2 5.61 0.19 6.46 0.02 115
3 6.10
4 3.84 0.13 2.28 1.31 0.05 1.74 59 34 428
5 3.70 0.24 3.01 2.01 0.07 1.50 81 54 427
7 3.44 0.16 2.96 1.94 0.05 1.53 86 56 423
A 4.31 0.62 7.53 3.27 0.07 2.30 175 76 423
B 3.32 0.34 3.95 1.92 0.07 2.06 119 58 425
C 3.44 0.41 2.81 2.66 0.12 1.06 82 77 417
Sample 2
Sample 3
Sample 4
1 4.20 0.56 21.73 0.69 0.02 31.49 517 16 420
2 3.76 0.40 16.78 0.02 446
3 3.69
4 3.85 0.31 14.77 0.97 0.02 15.23 384 25 424
5 4.20 0.55 16.80 1.15 0.03 14.61 400 27 418
7 3.50 0.53 14.28 1.61 0.03 8.87 408 46 420
A 5.16 0.60 38.31 3.48 0.01 11.01 742 67 427
B 3.91 0.61 18.58 1.20 0.03 15.48 475 31 420
C 3.60 0.74 19.17 1.58 0.03 12.13 533 44 418
1 11.74 2.01 55.04 1.78 0.03 30.92 469 15 427
2 13.86 2.14 65.93 0.03 476
3 11.90
4 12.50 142 48.38 1.33 0.02 36.38 387 11 426
5 11.20 1.58 36.90 1.73 0.04 21.33 329 15 427
7 11.96 2.13 40.61 4.14 0.05 9.81 340 35 421
A 11.87 2.24 47.27 4.62 0.04 10.23 398 39 425
B 12.12 2.38 49.47 1.46 0.04 33.88 408 12 420
C 10.90 2.51 50.08 1.90 0.04 26.36 459 17 417
1 53.01 8.01 301.40 10.50 0.03 28.68 569 20 435
2 57.43 6.32 308.10 0.02 537
3
4 53.75 2.54 266.50 12.20 0.09 21.80 496 23 433
5 54.50 10.20 236.00 15.10 0.04 15.63 433 28 437
7 57.38 3.79 293.10 27.10 0.01 10.83 511 47 428
A 64.97 6.00 333.50 31.90 0.02 10.45 513 49 435
B 48.49 5.93 242.10 12.70 0.02 19.14 499 26 435
C 49.29 7.14 292.90 17.80 0.02 16.44 594 36 436
Note: Labs A - C represent contractor labs.
geochemical study before strict conclusions are stated.
Rock-Eval Tmax and vitrinite reflectance data to define thermal maturation of the four samples are listed in Table 4 and Appendix 2, respectively.
Comparison of maceral and geochemical analyses
Rock-Eval and elemental analysis effectively describe kerogen quality and the hydrocarbon gener- ative potential of these samples. In contrast, it is difficult to use some of the petrographic results to define the generative potential of these organic matter assemblages. Although results of the prescribed classification provide useful information, the lack of definition to the generalized "amorphous" category and variation in intra-laboratory results limit effec- tive characterization. For most individual classifi- cations, inadequate definition of kerogen quality is related to: (1) lack of clear definition for certain petrographic terms, (2) poor correlation between petrographic terms and geochemical data, (3) vari- ation in intralaboratory results, and (4) different methods of reporting results.
A combination of geochemical and petrographic results provides the most complete characterization of these samples. Bulk geochemical parameters
provide a quantitative evaluation of the kerogen quality and generative potential. Petrographic analy- sis identifies individual components that make up the kerogen, which can be used to further interpret and cross check geochemical results. In addition, the hydrocarbon characteristics of individual oil-prone
10001 I
~.~ l / IA ® ; 1 0 h ~ l . ~ ,
[ i MontmQyFm. I I I o • [] ~WrdeCod
i 400
200
Ohio Shale
~ W l l o o x Fm.
.- - 7 . ~ n l
0 I I I
0 50 100 150 200 250
Oxygen Index (rag CO~g Cocg)
20 S. C. TEERMAN et a/.
Table 5. Results of Rock-Eval pyrolysis of isolated kerogens
TOC SI S2 $3 HI Ol Tm~ x
Sample (wt%) (rag HC/g Rk)* (mg HC/g Rk)* (mg CO 2/g Rk)* (mg HC/g OC) (mg CO 2/g OC) (C) Sample I
Lab A 48.34 3.53 58.55 26.02 121 54 418
Lab B 56.56 4.26 68.26 26.69 122 47 416
Lab C 56.30 5.29 63.67 33.97 113 60 420
Sample 2
Lab A 42.78 22.27 247.63 8.98 579 21 422
Lab B 57.33 29.54 299.42 8.62 522 15 424
Lab C 51.89 19.60 272.80 t2.80 526 25 428
Sample 3
Lab A 62.50 20.63 307.58 9.54 492 15 428
Lab B 66.84 21.30 310.11 8.92 464 13 426
Lab C 66.36 13.58 315.09 9.05 475 14 434
Sample 4
Lab A 44.14 5+40 242.75 18.96 550 43 435
Lab B 48.85 8.69 239.66 16.00 491 33 434
Lab C 52.10 5.10 252.65 25.71 485 49 438
*Consists of isolated kerogen and small amounts of insoluble minerals.
2.0
1.5
-~ 1.0 E
<
0.5
[TT
- -I o • w ~ l . * .
I +, , , , m ~ r ~ , ~ ,
/
-
Type IV
0 I I I I I
0.0S 0.10 0.15 0.20 0,9.5 0.30 Atomic O/C
Fig. 3. Plot of elemental analysis (atomic H/C and O/C) data for isolated kerogens from TSOP samples.
c o n s t i t u e n t s , o r g a n i c m a t t e r o c c u r r e n c e , o r g a n i c p r e - c u r s o r s , a n d d e p o s i t i o n a l c o n d i t i o n s c a n be d e s c r i b e d b y p e t r o g r a p h i c a n a l y s i s . O r g a n i c p e t r o l o g y c a n effectively i d e n t i f y t h e i n e r t i n i t e c o n t e n t a n d its effects o n g e o c h e m i c a l r e s u l t s , w h i c h is difficult b a s e d o n p y r o l y s i s t e c h n i q u e s .
A l t h o u g h H I v a l u e s o f t h e M o n t e r e y , O h i o S h a l e a n d M e s a V e r d e s a m p l e s i n d i c a t e s i m i l a r k e r o g e n q u a l i t y , p e t r o g r a p h i c r e s u l t s d e m o n s t r a t e t h e t y p e a n d a m o u n t o f oil- vs g a s - p r o n e , a n d i n e r t c o m - p o n e n t s a r e different. T h e M o n t e r e y c o n s i s t s o f pre- d o m i n a n t l y o i l - p r o n e c o m p o n e n t s ; t h e O h i o S h a l e , a m i x t u r e o f s e v e r a l t y p e s o f o i l - p r o n e c o n s t i t u e n t s , a n d g a s - p r o n e a n d i n e r t m a t e r i a l . T h e M e s a V e r d e s a m p l e c o n s i s t s o f a u n i q u e m i x t u r e o f oil- a n d g a s - p r o n e c o m p o n e n t s e m b e d d e d in a n o r g a n i c m a t r i x . F o r t h e W i l c o x s a m p l e , t h e H I a n d a t o m i c H / C d o c u m e n t t h e g a s - p r o n e n a t u r e o f t h e o r g a n i c a s s e m b l a g e . P e t r o - g r a p h i c a n a l y s i s identifies t h e g a s - p r o n e vitri-nitic o r i g i n o f t h i s a m o r p h o u s m a t e r i a l .
Integration o f geochemical and petrographic
parameters
C o r r e l a t i o n o f a p e t r o g r a p h i c c l a s s i f i c a t i o n to geo- c h e m i c a l r e s u l t s p r o v i d e s t h e i n t e g r a t i o n o f t h e t w o
Table 6. Results of elemental analyses.
Sample % Carbon % Hydrogen % Oxygen % Nitrogen H/C O/C Sample I
Lab A 60.80 4.14 19.02 1.43 0.82 0+23
Lab B 61.58 4.57 24.00 1.46 0.89 0.29
Sample 2
Lab A 55.97 6.10 7.96 2.13 1.31 0.11
Lab B 58.56 6.37 9.42 2.38 1.31 0.12
Sample 3
Lab A 67.09 6.15 7.90 2.23 1.10 0.09
Lab B 69.51 6.62 8.54 2.22 1.14 0.09
Sample 4
Lab A 53.31 5.73 13.62 1.22 1.29 0.19
L a b B 53.51 5.69 15.58 1.33 1.28 0.22
Source rock/dispersed organic matter characterization 21
techniques. Calibration between petrographic and geochemical parameters requires an understanding of the chemistry of different groups of organic com- ponents. It has long been recognized that the liptinite, vitrinite and inertinite maceral groups display distinct chemical properties (Seyler, 1943; van Krevelen, 1950; Dormans et al., 1957). More recent work has shown that, within maceral groups, chemical differ- ences occur based on the specific type of vitrinite and liptinite (Gutjahr, 1983).
Due to the variation in properties of amorphous material, a single petrographic category prevents accurate characterization of the hydrocarbon genera- tive potential or paleoenvironmental aspects of a source rock. Various studies have demonstrated the geochemical significance of amorphous organic matter subdivisions. Van Gijzel (1982) described three types of amorphous organic matter, which have chemical definition. Sentfle (1984) described fluoresc- ing and non-fluorescing amorphous material, which correlates to chemical properties of an organic matter assemblage. Thompson and Dembicki (1986) demon- strated that the correlation of optically distinct amor- phous assemblages to geochemical properties is possible using transmitted, incident white light and fluorescence to recognize petrographic differences. Their work suggests that amorphous nomenclature should describe the optical-chemical properties rather than imply biological origins. Senftle et al. (1987) suggested that multimode illumination permits the distinction of different types of amorphous organic matter. Although different nomenclature is used,
Mukhopadhyay (1989) subdivided amorphous
materials based on their chemical and petrographic characteristics.
An organic matter classification that can be di- rectly correlated to geochemical data will enhance petrographic analysis and complement geochemical results. Jones and Edison (1978) grouped both struc- tured and amorphous organic matter into four categories generally equivalent to the four defined kerogen types (Tissot et al., 1974; Harwood, 1977). This approach, which eliminates complex petro- graphic terminology, emphasizes the identification of individual petrographic components based on their chemical properties. In addition to morphological information, this approach provides definition to bulk geochemical parameters and an important cross- check for petrographic results.
R E C O M M E N D A T I O N S A N D FUTURE DIRECTION
There is a need to develop a uniform petrographic classification that facilitates effective organic matter characterization and provides additional value to source rock evaluation. A standardized, well defined classification is needed that routinely uses well under- stood nomenclature. Acceptable limits of reproduci- bility need to be established to provide consistent results. Organic petrographic results must comp-
lement and provide additional information to established geochemical parameters and geological information. Unless these attributes of a uniform classification are achieved, future advancement and utilization of organic petrology will be difficult.
The following recommendations result from this study:
(1) A uniform organic matter classification must be employed, which eliminates complex termi- nology and is capable of direct correlation with geochemical parameters.
(2) A standardized definition, nomenclature, and application of amorphous organic matter is needed that can help provide useful and repro- ducible results.
(3) Subdivisions of the amorphous category are needed to better characterize its chemical
(hydrocarbon generative potential) and
environmental properties.
(4) Standardized techniques including utilization of multimode illumination and different sample preparations will help eliminate some of the variability in the amount and type of struc- tured and amorphous components identified.
Future direction of this subcommittee includes: (1) additional photomicrographs of round robin and other samples, (2) standardization of microscopic techniques, (3) address "amorphous problem" and nomenclature, (4) define consistent subdivisions of amorphous organic matter, and (5) integration of microscopic and geochemical results. Future work should be carried out with the ICCP and other groups.
Acknowledgements~Gratitude is expressed to all sub- committee participants and corresponding laboratories for their contributions. Chevron Petroleum Technology Com- pany provided financial support to help complete this study. The TSOP Research Committee provided financial support for publication of color photomicrographs. D. Logan (Phillips) provided some of the round robin samples. Con- structive comments from reviews by D. K. Baskin, J. R. Castafio, W. G. Dow and J. Thompson contributed to the manuscript. T. T. Ta (Chevron) provided technical assist- ance in carrying out this study. Appreciation is expressed to S. E. Kim (Chevron) for graphical support in completing this manuscript.
REFERENCES
Alpern B. (1980) Petrography of kerogen. In Kerogen. Insoluble Organic Matter from Sedimentary Rocks (Edited by Durand B.), pp. 339-383. Editions Technip, Paris. Alpern B., Lemos de Sousa M. J., Pinheiro H. J. and Zhu
X. (1992) Optical morphology of hydrocarbons and oil progenitors in sedimentary rocks--relations with geo- chemical parameters. Publ. Mus. Labor. miner, geol. Fac. Cienc. Porto N. S. 3, 1-21.
Alpern B., Lemos de Sousa M. J., Pinheiro H. J. and Zhu, X. (1993) Detection and evaluation of hydrocarbons in source rocks by fluorescence microscopy. Org. Geochem.
20, 789-795.
Batten D. (1977) Proc. I V Int. Paly. Conf., Lucknow, India.
22 S.C. TEERMAN el a/.
Burgess J. D. (1974) Microscopic examination of kerogen (dispersed organic matter) in petroleum exploration. Geol. Soc. Am. Spec. Paper 153, 19-30.
Combaz A. (19643 Les palynofacies. Bey. Micropaleo. 7,
205-218.
Combaz A. (1974) La matiere algaire et Forigine du petrole. In Advances in Organic Geochemistry 1973 (Edited by Tissot B. and Bienner F.), pp. 423438. Editions Technip, Paris.
Combaz A. (19753 Essai de classfication des roches carbonees et des constituants organiques des roches sedimentaires. In Petrographie de la Matiere Organique des Sediments, Relations avec la Paleotemperature et le Potentiel Petrolier (Edited by Alpern B.), pp. 9 3 101. Centre National de la Recherche Scientifique, Paris. Combaz A. (1980) Les kerogenes vus au microscope. In
Kerogen. Insoluble Organic Matter .[?om Sedimentary Rocks (Edited by Durand B.), pp. 55 111. Editions Technip, Paris.
Creaney S. (19803 The organic petrology of the Upper Cretaceous Boundary Creek Formation, Beaufort- Mackenzie basin. Bull. Can. Pet. Geol. 28, 112 129. Dormans H. N. M., Huntjens F. J. and van Krevelen D. W.
(1957) Chemical structure and properties of coal- composition of the individual macerals (vitrinites, fusinites, micrinites, and exinites). Fuel 36, 321 339. Durand B. and Nieaise G. (1980) Procedures for kerogen
isolation. In Kerogen. Insoluble Organic Matter from Sedimentary' Rocks (Edited by Durand B.), pp. 35 53. Editions Technip, Paris.
Fisher M..I. (19773 Proc. 1V Int. Po(v. ConiC, Lucknow, India.
van Gijzel P. (1982) Characterization and identification of kerogen and bitumen and determination of thermal maturation by means of qualitative and quantitative microscopical techniques. In How to Assess Maturation and Paleotemperatures. SEPM Short Course No. 7. pp. 159 216.
Gutjahr C C. M. (1983) Introduction to incident-light microscopy of oil and gas source rocks. Geol. Mtljnbouw
62, 417-425.
Harwood R. J. (19773 Oil and gas generation by laboratory pyrolysis of kerogen. AAPG Bull. 61, 2082 2102. Hunt J. M. (1979) Petroleum Geochemistry and Geology.
Freeman, San Francisco.
International Committee for Coal Petrology (1963, 1971, I976) International Handbook qf Coal Petrology, 2nd edition (1963), 1st Supplement (1971), 2nd Supplement (1976). Centre National de la Recherche Scientifique, Paris.
Jacob H. (1989) Classification, structure, genesis and practi- cal importance of natural solid oil bitumen ("migrabitu- men"). Int. J. Coal Geol. 11, 65 79.
Jones R. W. and Edison T. A. (1978) Microscopic obser- vations of kerogen related to geochemical parameters with emphasis on thermal maturation. In Low Tempera- ture Metamorphism of Kerogen and Clay Minerals (Edited by Oltz O. F.), pp. 1 12. Society of Econ. Paleont. Min. van Krevelen D. W. (1950) Graphical-statistical method for the study of structure and reaction processes of coal. Fuel
24, 269 284.
Larter S. R. (19853 Integrated kerogen typing in the recog- nition and quantitative assessment of petroleum source
rocks. In Petroleum Geochemistry in Exploration of the Norwegian Shell" (Edited by Thomas B. M. et al.),
pp. 269-286. Graham & Trotman, London.
Mukhopadhyay P. K. ([989) Characterization of amor- phous and other organic matter types by microscopy and pyrolysis-gas chromatography. O r g . Geochem. 14, 269 284.
Mukhopadhyay P. K., Hagemann H. W. and Gormly J. R. (19853 Characterization of kerogens as seen under the aspect of maturation and hydrocarbon generation. Erdol Kohle Erdgas Petrochem. 38, 7 18.
Powell T. G., Creaney S. and Snowdon L. R. (19823 Limitations of use of organic petrographic techniques for identification of petroleum source rocks. AAPG Bull. 66,
430 435.
Raynaud J. F. and Robert P. (t976) Les methodes d'etude optique de la matiere organique. Bull. Centr. Rech. Pau-SNPA If[, 109 127.
Robert P. ( 198 I) Classification of organic matter by means of fluorescence; applications to hydrocarbon source rocks. Int. J. Coal Geol. I, 101 137.
Scott J. (I 992) Accurate recognition of source rock charac- ter in the Jurassic of the North West Shelf, Western Australia. APEA 32, 289 299.
Senftle J. T. (1984) Optical analysis of kerogen its role in an integrated approach for kerogen typing. North Arnerican Coal Petrographers Meeting Programs and Abs.,
Merrilville, Ind.
Senftte J. T. (1989) Influence of kerogen isolation methods on petrographic and bulk chemical composition of a Woodford Shale sample. TSOP Research Subcommittee Report ( 10/31/89).
Senftle J. T., Brown J. I-L and Latter S. R. (19873 Refine- ment of organic petrographic methods for kerogen characterization. Int. ,L Coal Geol. 7, 105--117. Seyler C. A. (1943) The relevance of optical measurements
to the structure and petrology of coal. In Proceedings, Cor![erence on the Ultra:line Structure of Coals and Cokes,
London, pp. 270 289.
Suzuki N. (1984) Characteristics of amorphous kerogens fractionated from terrigenous sedimentary rocks.
Geochim. Cosmochim. Acta 48, 243 249.
Teichmuller M. (19743 lrber neue macerale der liptinit- gruppe und die entstehung des micrinits. Fortschr. Geol. Rheinld. Wes(f 24, 37 64.
Teichmuller M. (19863 Organic petrology of source rocks, history and state of the art. Org. Geochem. 10, 581 599.
Teichmuller M. and Ottenjann K. (1977~ Art und diagenese von liptiniten und lipoiden stoffen in einem erdolmut- tergestein auf grund fluoreszenzmikroskopiseher untersuchungem. Erdol Kohle Erdgas Petrochem. 30,
387 398.
Thompson C. L. and Dembicki H. (19863 Optical character- istics of amorphous kerogens and the hydrocarbon- generating potential of source rocks. Int. J. Coal Geol. 6,
229 249.
Tissol B. and Welte D. I t (1984~ Petroleum Formation and Occurrence. Springer, Berlin.
Source rock/dispersed organic matter characterization 23
A P P E N D I X 1
Amorphous Herbaceous Woody Vitrinite InerUnite Solid Bitumen
1olo
Solid Bitumen Amorphous*
Group1 I Group2 I Group3
I I
Structured Liptinite
(I) (ll)
Vitdnite (III)
Inertinite (iv)
*Amorphous Groups 1-3 Generally Equivalent to Type I-III Kerogen
Liquid Exinlte Prone
Alglnite
Gas Vltrlnlto
Prone
arbor (InerUnite)
Type II Structured
Terrestrially But
Dedved Occasionally
Amorphous
Type I Amorphous
Lacustrine Kerogen
Algae
Type II Madne Algae
Type III Structured
Kerogen (Rarely (?) Amorphous)
Type IV Structured
Kerogen
LipUnite Herbaceous
Sapropel or Liptinite
Amorphous
Huminite Woody
InertJnite
Phyrogen
Amorphogen
Hylogen
Phytoclast (Fluorescent)
ProUstoclast
Phytoclast
Coaly Malanogen Inertinite
Kerogen Composition Data
% (Visual, From Microscopy) % (Calculated)
Alginite Wxy
InerUnite Vitrinite Sapropel Inertinite Vitrinite Sapropel Sapropel
24 S.C. TEERMAN et al.
Rock: OM:
OM Pyrite Quantity
Oxidation
Maceral Composition
Vitrinite
Inertinite ~ Liptinite
Pyrite:
X = Frequent + = Common / = Little - = Rare
V = Abundant
[ ] Framboidal [ ] Crystaline [ ] Massive [ ] Glauconite
[ ] Coal
[ ] SOM [ ] Telocollinite [ ] Telinite [ ] Desmocollinite [ ] Sporinite [ ] Cutinite [ ] Resinite [ ] Liptodetrinite [ ] Alginite [ ] Microplankton [ ] Sclerotinite [ ] Fusinite [ ] Semitusinite [ ] Macrinite [ ] Micdnite [ ] Bituminit e [ ] Dead Carbon [ ] Graphite
Macemls Reflected Light Fluorescence
Inertinite Huminite/ Vitrinite Polymacente Bitumenite Sporinite Cutinite Resinite Liptodetrinite Telalginite Lamalginite Migrabitumen Exsudates
Organo-Mineral Matrices Zooclasts
Proportion: Fluo/Non-Fluo OM:
Pollution: Reworking:
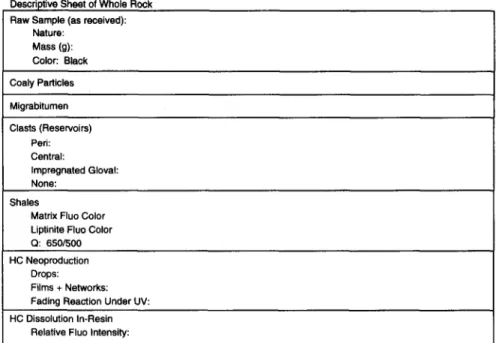
Source rock/dispersed organic matter characterization
Descriptive Sheet of Whole Rock Raw Sample (as received):
Nature: Mass (g): Color: Black
25
Coaly Particles
Migrabitumen
Clasts (Reservoirs)
Peri:
Central:
Impregnated Gloval: None:
Shales
Matrix Fluo Color Liptinite Fluo Color Q: 650/500
HC Neoproduction Drops: Films + Networks: Fading Reaction Under UV: HC Dissolution In-Resin
Relative Fluo Intensity:
A P P E N D I X 2
Table A2. Vitrinite Reflectance Data TSOP Samples Sample and Lab No. % Reflectance n a Sample 1
1 0.40 55 0.03
2 0.46 61 0.02
3 0.40 WR 65 0.04
0.31 Conc 60 0.06
4 0.40 55 0.02
5 0.41 76 0.03
6 0.45 I 10 0.05
Sample 2
I 0.32 26 0.04
2 0.32 26 0.02
3 0.27 10 0.05
0.29 31 0.06
0.33 55 0.04
0.30 15 0.02
0.33 70 0.04
4 5 6 Sample 3
1 2 3 4 5 6 Sample 4
1 2 3 4 5 6
0.39 35 0.03
0.44 WR 40 0.06
0.44 Conc 23 0.05
0.46 8 0.04
(0.4-0.45)
0.39 21 ,0.05
0.43 50 0.03
0.47 35 0.03
0.38 WR 100 0.04
0.42 55 0.04
0.41 39 0.04