918 Rev Bras Epidemiol 2013; 16(4): 918-29
Deaths of bicycle riders in Brazil:
characteristics and trends during
the period of 2000 – 2010
Mortalidade de ciclistas no Brasil:
características e tendências no
período 2000 – 2010
Leila Posenato GarciaI
Lúcia Rolim Santana de FreitasII
Elisabeth Carmen DuarteII
IInstituto for Applied Economic Research – Brasília (DF), Brazil.
IISchool of Medicine of Universidade de Brasília – Brasília (DF), Brazil.
Corresponding author: Leila Posenato Garcia. Instituto de Pesquisa Econômica Aplicada. SBS, Quadra 1, Bloco J, CEP: 70076-900, Brasília, DF, Brasil. E-mail: [email protected]
Conlict of interests: nothing to declare.
Abstract
Introduction: In Brazil, bicycle use has been increasing. Accidents involving cyclists are important causes of morbidity and mor-tality. Objective: To describe the mortal-ity of cyclists injured in transport accidents in Brazil, the characteristics of the victims and of the occurrence, and to investigate its trends during the period between 2000 and 2010. Methods: A descriptive study with data from the Mortality Information System (SIM) was conducted in the period of 2000 – 2010. Crude and age-standardized corrected mortality rates were calculated for Brazil, its macro-regions and states. Linear regression was used to study the trends. Results: In the period of 2000 – 2010, 32,422 bicycle-related deaths were identiied in Brazil. In 2010, there were, on average, 8.8 bicycle-related deaths per day. Age-standardized mortality rates for the country were 15.3 and 15.9 deaths per million inhabitants in 2000 and 2010, respectively (p = 0.725). During the whole period, the Center-Western region showed the highest rates, though stable, correspond-ing to 23.4 deaths per million inhabitants in 2010. Men accounted for 85.4% of deaths, with death risk 5 times higher than women. Conclusion: In spite of the stable rates for the country, there was an increase trend in the Northern and Northeastern regions, while a decreasing trend was observed in the Southern and Southeastern regions. he risk of death was higher among men, elderly, and people living in large cities and at the Center-Western region.
Introduction
he bicycle is a low cost mean of transport that also presents advantages to the environ-ment, besides allying transport to the practice of physical activity for the rider. Brazil has the sixth largest bicycle leet among all the coun-tries in the world, losing to China, India, the United States, Japan and Germany1. he bicycle is the most used individual mean of transport in the country. In small urban centers (more than 90% of the Brazilian cities), bicycles also share space with pedestrians in most dislo-cations. his happens because bicycles are an economically accessible transportation alternative for most people, no matter the income, and they can be used from child-hood to older ages1.
For those reasons, in Brazil there are initia-tives to encourage the use of bicycles as a mean of transport, such as the Brazilian Program of Bicycle Mobility, or the Bicycle Brazil Program (PBB). his Program was established in 2004 after the initiative of the National Secretariat of Transport and Urban Mobility (SeMob), of the Ministry of Cities (MCidades)2, in order to stimulate municipal and state governments, as well as the Federal District, to develop and improve actions that favor the safer use of the bicycle as a mean of transport.
As a consequence, the use of the bicycle has been increasing in Brazil, both as a mean of transport to work and school, and to leisure activities. Even though it plays a relevant role in the dislocation of millions of people, the necessary infrastructure to the use of bicycles in the country is not available everywhere1. he shared traic of bicycles and cars is pointed out as the main insecurity factor, facilitating the occurrence of accidents3.
Injuries caused by traic accidents are an important cause of death in the world. Out of the approximate 1.3 million deaths caused by these injuries every year, nearly 90% take place in medium and low-income countries4. In the region of the Americas, 39% of the people who die because of lesions caused by traic are considered to be vulner-able: pedestrians, cyclists or motorcyclists. However, in the sub-region of the Southern
Resumo
Introdução: No Brasil, o uso da bicicleta tem sido crescente. Os acidentes envolvendo ciclis-tas são causas importantes de morbidade e mortalidade. Objetivo: Descrever a mortali-dade de ciclistas traumatizados em acidentes de transporte, as características das vítimas e da ocorrência e investigar sua tendência no período 2000 – 2010. Métodos: Foi realizado estudo descritivo com dados do Sistema de Informações sobre Mortalidade (SIM) no perí-odo 2000 – 2010. Foram calculadas taxas de mortalidade especíicas corrigidas brutas e padronizadas por idade, para o Brasil, regiões e Unidades da Federação, além da mortali-dade proporcional. Regressão linear simples foi empregada para estudo das tendências. Resultados: No período 2000 – 2010, após correção, foram identiicados 32.422 óbitos de ciclistas traumatizados em acidentes de transporte no Brasil. Em 2010, ocorreram em média 8,8 óbitos por dia. As taxas de mortali-dade padronizadas para o país corresponde-ram a 15,3 e 15,9 óbitos de ciclistas por milhão de habitantes, em 2000 e 2010, respectiva-mente (p = 0,725). Em todo o período, a região centro-oeste apresentou taxas estáveis e mais elevadas que as demais regiões, equivalente a 23,4 óbitos por milhão de habitantes, em 2010. Os homens representaram 85,4% dos óbitos, com risco de morte cinco vezes supe-rior às mulheres. Conclusão: Apesar da esta-bilidade das taxas no país, houve tendência de aumento nas regiões nordeste e norte e redução no sul e sudeste. O risco de morte foi mais elevado entre homens, pessoas idosas e residentes em municípios de grande porte e na região centro-oeste.
920 Deaths of bicycle riders in Brazil: characteristics and trends during the period of 2000 – 2010Garcia, L.P. et al. Rev Bras Epidemiol
2013; 16(4): 918-29
Cone, where Brazil is located, mortality of vulnerable people reaches 50% of traffic-related deaths5. In Brazil, mortality caused by transport accidents represented, in 2007, almost 30% of the total of deaths caused by external causes6. In 2003, out of the total of deaths by land transport accidents, 46.9% involved vulnerable people (3.8% of cyclists, 30.2% of pedestrians and 12.9% of motorcy-clists); and 30.2% involved car occupants7. In the comparison of proportional mortality according to mean of transport, it should be considered that, in major urban centers, where the number of deaths has greater impact on statistics, the bicycle is not so used, in contrast with the other means of transport. In fact, a study conducted in Porto Alegre, capital of the state of Rio Grande do Sul, revealed that the risk of death for those who use bicycles was about 80 times higher than for those using the collective transport. he same risk was 13 times higher when compared to bus users, but who walk part of the route3.
Transport accidents, including those involving bicycles, are important causes of morbidity and mortality and impose high costs to the Uniied Health System (SUS), as well as to society8. To know about the mortal-ity of cyclists who were injured in transport accidents, as well as the proile of the victims, provides subsidies to assist the elaboration and the implementation of public policies addressed to facing such a serious social and public health problem.
he objectives of this study are to describe the mortality of cyclists injured in transport accidents, including the characteristics of the victims and the circumstances of the accident, as well as to investigate its tendency in the period of 2000 – 2010.
Methods
A descriptive study was conducted with data from the Mortality Information System (SIM) concerning the period of 2000 – 2010, extracted in July, 2012.
he deaths of Cyclists Injured in Transport Accidents (CTAT) correspond to codes V10-V19 of the tenth revision of the International
Classiication of Diseases and Related Health Problems (ICD-10). he proportional mortality of CTAT in relation to the total of deaths caused by land transport accidents (LTA) was calcu-lated by considering the deaths corresponding to the following codes in the tenth revision of ICD-10: V01-V09 (pedestrian injured in transport accident), V-20-V29 (motorcycle rider injured in transport accident), V-30-V39 (occupant of three-wheeled motor vehicle injured in transport accident), V40-V49 (car occupant injured in transport accident), V50-V59 (occupant of pick-up truck or van injured in transport accident), V60-V69 (occupant of a heavy transport vehicle injured in transport accident), V70-V79 (bus occupant injured in transport accident), and V83-V87 (other land transport accidents).
Deaths of CTAT were described according to gender, color or ethnicity (less than 10, 10 to 19, 20 to 29, 30 to 39, 40 to 49, 50 to 59, 60 to 69, 70 years old or more), region of residency, day of the week and month of occurrence. he descrip-tion was also made in relahe descrip-tion to the size of the city, according to the classiication adopted by the Brazilian Institute of Geography and Statistics (IBGE), as follows: (1) small 1 = cities with up to 20,000 inhabitants, (2) small 2 = cities with 20,001 to 50,000 inhabitants, (3) medium = cities with 50,001 to 100,000 inhabitants, (4) large = cities with 100,001 to 900,000 inhabitants and (5) metropolis = cities with more than 900,000 inhabitants.
he absolute number of deaths of CTAT, mortality and proportional mortality rates were calculated according to these variables for the triennium 2000 – 2002 and 2008 – 2010, as well as for the total period of 2000 – 2010. In order to describe the deaths of CTAT, the correction for sub-register was made, with proportional redistribution of deaths by LTA; the type of vehicle or transport accident was not speci-ied (ICD-10 causes V89-V99).
same place and period multiplying it by one million. The size of the resident population used as denominator came from census (2000 and 2010), and intercensal projec-tions (2001 to 2009) produced by IBGE and made available by DATASUS. The mortal-ity rates of CTAT standardized by age were calculated, using the standard population of the World Health Organization (WHO)9. The age groups defined for the standard-ization of the rates were: < 10, 10 to 19, 20 to 29, 30 to 39, 40 to 49, 50 to 59, 60 to 69, 70 years old and more. For the calculation of standardized mortality rates, the corrected number of deaths was used.
The proportional mortality of the basic cause of death in relation to the total num-ber of deaths by LTA was calculated as the percentage of deaths of CTAT or other means of transport according to age groups and genders. The proportion of deaths of CTAT who had head trauma identified as a consequential cause of death was cal-culated, being defined as intermediate or immediate cause, described in Part I, lines a, b, c or d of DO, and excluding the basic cause of death.
The tendencies of the standardized mortality rates in Brazil and regions were estimated by the simple linear regression. The conjectures for the use of this statistics
were measured and tendencies were con-sidered to be statistically significant when p ≤ 0.05. The analyses were made with the assistance of the Stata, version 10, and Microsoft Excel.
his study was conducted exclusively with data from the Mortality Information System (SIM), of public access, without identifying the subjects and observing the principles of ethics in research involving human beings, therefore, the appreciation of an ethics com-mittee was dismissed.
Results
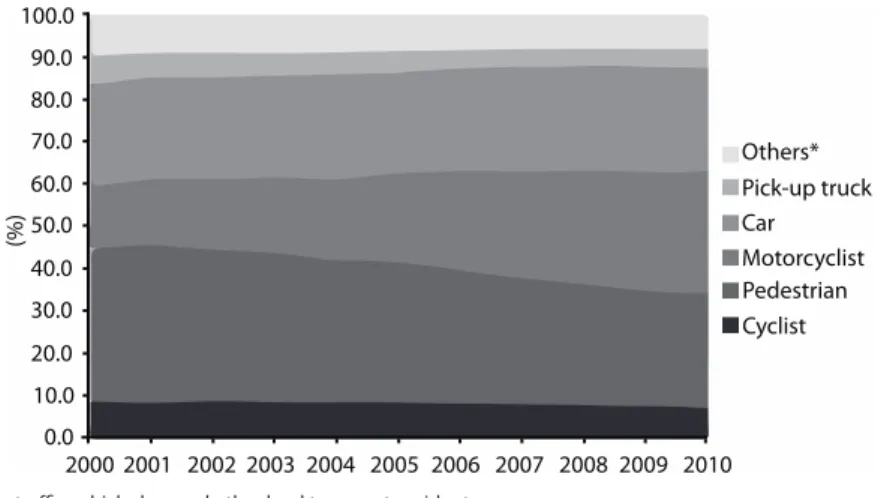
In the period of 2000 – 2010, after the correction for sub-register, 32,422 deaths of cyclists injured in transport accidents (CTAT) were identified in Brazil. In the same period, 390,767 deaths caused by land transport accidents (LTA) were registered. Deaths of CTAT corresponded to 9.3% of the total number of deaths caused by LTA. In 2000, the deaths of CTAT corresponded to 8.9% of the total number of deaths caused by LTA (n = 2,588), while in 2010 it was 7.3% of this total (n = 3,177) (Figure 1). In the period of 2000-2010, there was increasing participation of deaths of motorcyclists, from 14.6 to 28.8%, and car occupants, of 24.2 to 24.7%. On the other hand, there was
Others* Pick-up truck Car Motorcyclist Pedestrian Cyclist
2000 2001 2002 2003 2004 2005 2006 2007 2008 2009 2010 100.0
90.0
80.0
70.0
60.0
50.0
40.0
30.0
20.0
10.0
0.0
(%)
*Three-wheeled vehicle, heavy traic vehicle, bus and other land transport accidents. *Triciclo, transporte pesado, ônibus e outros acidentes de transporte terrestre.
Figure 1 - Proportional mortality (%) according to cause of death in relation to the total number of deaths by traic accidents. Brazil, 2000 to 2010.
922 DeaGarcia, L.P. et al.ths of bicycle riders in Brazil: characteristics and trends during the period of 2000 – 2010 Rev Bras Epidemiol
2013; 16(4): 918-29
reduced participation of deaths of pedes-trians, from 36.0 to 26.8%.
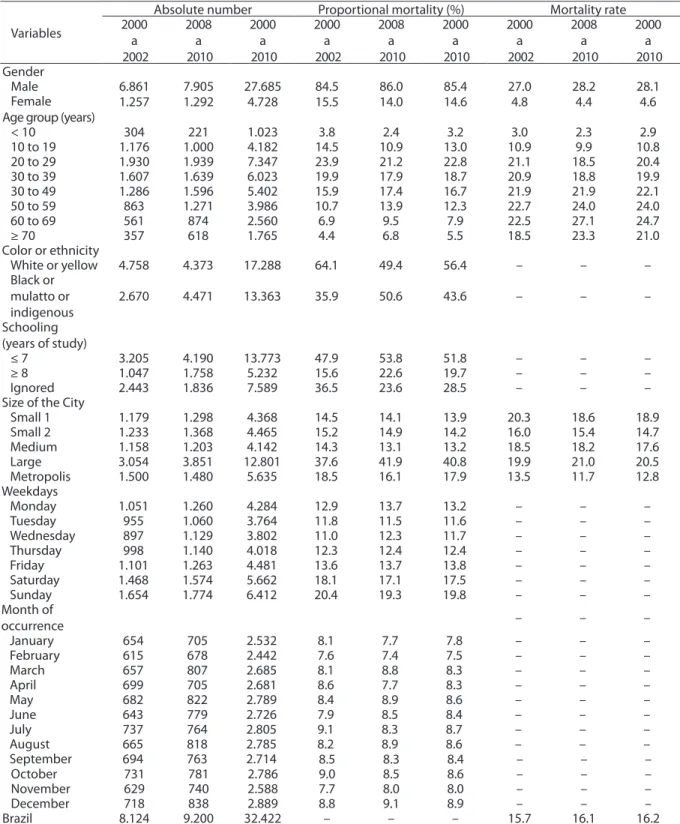
In Brazil, there was increased crude mortality rate of CTAT, from 15.7 deaths per million inhabitants, in the triennium 2000-2002, to 16.1, in the triennium 2008-2010, with positive variation of 2.3%. In both trienniums, the frequency of deaths of CTAT was higher among men, among people age 20 to 49 years old, white or yellow, with low schooling. More frequent deaths occurred on Saturdays and Sundays, with relatively homogeneous distribution during the entire year. The metropolis pre-sented the lowest risks of deaths of CTAT, followed by small cities 2 (Table 1).
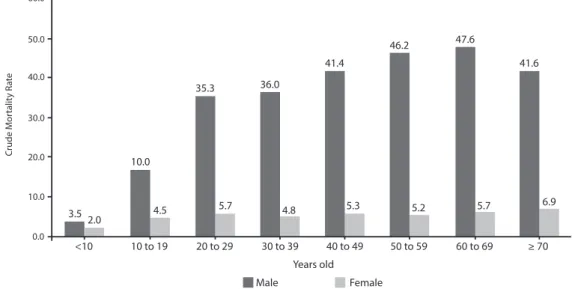
In both trienniums, the risk of death of CTAT estimated by the crude mortality rate was about five times higher among men in relation to women (Table 1). This risk increases with age, reaching values close to 20 deaths per million inhabitants in the age grouop of 20 to 29 years old, and these val-ues are maintained to older ages (Figure 2). After investigating the consequential causes of deaths of CTAT, it was observed that in 42.8% there was head trauma (data not shown). The annual number of deaths
of CTAT in Brazil increased from 2,588, in 2000, to 3,177, in 2010, with positive varia-tion of 22.8%. In the period of 2000 – 2010, there were in average 2,947 deaths a year. In 2010, there were in average 264.8 deaths of CTAT a month, or 8.8 a day. There was stability in standardized mortality rates in the period of 2000 to 2010 (15.4 deaths and 15.9 deaths per million inhabitants, respectively). The Northeast presented more expressive increase in standard-ized rates (from 9.8 to 16.0 deaths), with statistically significant tendency, as well as the North region. The Center-West region presented stable and higher rates than the other regions, in all of the observed years (23.4 deaths per million inhabitants, in 2010). In the Southeast region, there was statistically significant reduction of rates (15.1 and 13.2, in 2000 and 2010, respec-tively). In the South region, there was statistically significant reduction (24.2 and 20.9 deaths per million inhabitants, in the same years). In 2010, the highest crude and standardized mortality rates of CTAT were registered in Center-West (22.5 and 23.4, respectively) and South regions (21.9 and 20.9, respectively) (Table 2).
Male Female
C
rude M
or
talit
y R
a
te
3.5 2.0
10.0
35.3 36.0
41.4
46.2 47.6
41.6
5.7 6.9
≥ 70 60 to 69
50 to 59 40 to 49
30 to 39 20 to 29
10 to 19 <10
5.2 5.3
4.8 5.7
4.5
60.0
50.0
40.0
30.0
20.0
10.0
0.0
Years old
Figure 2 - Crude mortality rate of cyclists injured in transport accidents (deaths per million inhabitants), according to age groups and sex, total for the period 2000 – 2010.
Variables
Absolute number Proportional mortality (%) Mortality rate 2000
a 2002
2008 a 2010
2000 a 2010
2000 a 2002
2008 a 2010
2000 a 2010
2000 a 2002
2008 a 2010
2000 a 2010 Gender
Male 6.861 7.905 27.685 84.5 86.0 85.4 27.0 28.2 28.1
Female 1.257 1.292 4.728 15.5 14.0 14.6 4.8 4.4 4.6
Age group (years)
< 10 304 221 1.023 3.8 2.4 3.2 3.0 2.3 2.9
10 to 19 1.176 1.000 4.182 14.5 10.9 13.0 10.9 9.9 10.8
20 to 29 1.930 1.939 7.347 23.9 21.2 22.8 21.1 18.5 20.4
30 to 39 1.607 1.639 6.023 19.9 17.9 18.7 20.9 18.8 19.9
30 to 49 1.286 1.596 5.402 15.9 17.4 16.7 21.9 21.9 22.1
50 to 59 863 1.271 3.986 10.7 13.9 12.3 22.7 24.0 24.0
60 to 69 561 874 2.560 6.9 9.5 7.9 22.5 27.1 24.7
≥ 70 357 618 1.765 4.4 6.8 5.5 18.5 23.3 21.0
Color or ethnicity
White or yellow 4.758 4.373 17.288 64.1 49.4 56.4 – – –
Black or mulatto or indigenous
2.670 4.471 13.363 35.9 50.6 43.6 – – –
Schooling (years of study)
≤ 7 3.205 4.190 13.773 47.9 53.8 51.8 – – –
≥ 8 1.047 1.758 5.232 15.6 22.6 19.7 – – –
Ignored 2.443 1.836 7.589 36.5 23.6 28.5 – – –
Size of the City
Small 1 1.179 1.298 4.368 14.5 14.1 13.9 20.3 18.6 18.9
Small 2 1.233 1.368 4.465 15.2 14.9 14.2 16.0 15.4 14.7
Medium 1.158 1.203 4.142 14.3 13.1 13.2 18.5 18.2 17.6
Large 3.054 3.851 12.801 37.6 41.9 40.8 19.9 21.0 20.5
Metropolis 1.500 1.480 5.635 18.5 16.1 17.9 13.5 11.7 12.8
Weekdays
Monday 1.051 1.260 4.284 12.9 13.7 13.2 – – –
Tuesday 955 1.060 3.764 11.8 11.5 11.6 – – –
Wednesday 897 1.129 3.802 11.0 12.3 11.7 – – –
Thursday 998 1.140 4.018 12.3 12.4 12.4 – – –
Friday 1.101 1.263 4.481 13.6 13.7 13.8 – – –
Saturday 1.468 1.574 5.662 18.1 17.1 17.5 – – –
Sunday 1.654 1.774 6.412 20.4 19.3 19.8 – – –
Month of
occurrence – – –
January 654 705 2.532 8.1 7.7 7.8 – – –
February 615 678 2.442 7.6 7.4 7.5 – – –
March 657 807 2.685 8.1 8.8 8.3 – – –
April 699 705 2.681 8.6 7.7 8.3 – – –
May 682 822 2.789 8.4 8.9 8.6 – – –
June 643 779 2.726 7.9 8.5 8.4 – – –
July 737 764 2.805 9.1 8.3 8.7 – – –
August 665 818 2.785 8.2 8.9 8.6 – – –
September 694 763 2.714 8.5 8.3 8.4 – – –
October 731 781 2.786 9.0 8.5 8.6 – – –
November 629 740 2.588 7.7 8.0 8.0 – – –
December 718 838 2.889 8.8 9.1 8.9 – – –
Brazil 8.124 9.200 32.422 – – – 15.7 16.1 16.2
Table 1 - Number of deaths of cyclists injured in transport accidents, proportion (%) and crude mortality rates (per million inhabitants) according to characteristics of the victim and of the occurrence. Brazil, 2000 to 2010.
924 Deaths of bicycle riders in Brazil: characteristics and trends during the period of 2000 – 2010Garcia, L.P. et al. Rev Bras Epidemiol
2013; 16(4): 918-29
2000 2001 2002 2003 2004 2005 2006 2007 2008 2009 2010 Trend**
North
n 147 154 200 184 190 229 220 225 258 230 242 –
Crude rate 10.2 10.6 12.9 11.9 11.8 13.9 13.2 15.5 15.5 13.4 13.7 –
Standardized rate 12.1 12.7 14.7 14.2 14.1 16.6 15.8 18.0 18.0 15.6 15.4 ß = -0.375 (p = 0.008)
Northeast
n 453 444 524 478 471 537 585 653 653 668 854 –
Crude rate 8.9 8.5 10.0 9.1 8.8 9.9 10.7 11.8 11.8 11.9 15.6 –
Standardized rate 9.8 9.4 10.8 10.0 9.5 10.7 11.7 12.4 12.4 12.6 16.0 ß = 0.503 (p < 0.001)
Southeast
n 1.115 1.170 1.199 1.232 1.288 1.301 1.236 1.226 1.104 1.104 1.138 –
Crude rate 15.1 15.7 15.9 16.1 16.5 16.3 15.3 15.0 13.4 13.4 13.8 –
Standardized rate 15.1 15.7 15.8 15.9 16.3 16.1 15.1 14.7 14.0 13.0 13.2 ß = -0.266 (p = 0.005)
South
n 606 593 705 711 728 672 654 616 632 595 612 –
Crude rate 23.8 22.9 27.0 26.9 26.8 24.5 23.5 21.7 22.6 21.0 21.9 –
Standardized rate 24.2 23.2 27.4 27.0 26.9 24.6 23.5 21.3 22.0 20.3 20.9 ß = -0.537 (p = 0.015)
Center-West
n 267 252 296 274 328 374 337 366 363 354 331 –
Crude rate 21.6 19.9 23.6 20.9 24.4 27.8 24.0 25.8 22.5 24.2 22.5 –
Standardized rate 22.8 22.1 26.3 23.0 26.8 30.7 25.5 27.4 27.0 26.0 23.4 ß = 0.256 (p = 0.316)
Brazil
n 2.588 2.613 2.924 2.879 3.005 3.113 3.032 3.068 3.072 2.951 3.177 –
Crude rate 14.7 14.7 16.2 15.7 16.1 16.4 15.7 15.7 15.7 14.9 16.1 –
Standardized rate 15.3 15.3 16.8 16.3 16.6 16.9 16.1 15.9 15.8 15.0 15.9 ß = -0.222 (p = 0.725) Table 2 - Number of deaths, crude and standardized* mortality rates of cyclists injured in transport accidents (per million inhabitants). Brazil and regions, 2000 – 2010.
Tabela 2 - Número de óbitos, taxas brutas e padronizadas* de mortalidade de ciclistas traumatizados em acidentes de trans-porte (por milhão de habitantes). Brasil e regiões, 2000 – 2010.
*Age-standardized mortality rates through direct metod, using WHO world standard population; **Trend refers to standardized mortality rates. *Taxas de mortalidade padronizadas por idade pelo método direto, tendo como padrão a população mundial padrão da OMS; **Tendência referente à taxa de mortalidade padronizada.
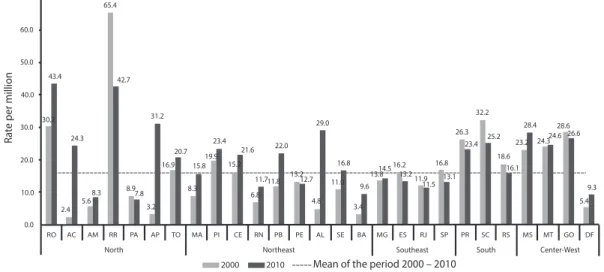
As to the occurrence of deaths of CTAT in the FU, in the period of 2000 to 2010, Roraima presented the highest standardized mortality rates (65.4 and 42.7 deaths per million inhabitants, respectively). These values are much higher in relation to the mean rates observed in Brazil. In 2010, high rates were also observed in the states of Rondônia (43.4), Amapá (31.2) and Alagoas (29.0). The states that presented remarkable tendencies of increment in
the standardized mortality rates of CTAT, per million inhabitants, in the period of 2000-2010, were: Acre (from 2.4 to 24.3), Amapá (from 3.2 to 31.2), Paraíba (from 11.8 to 22.0) and Alagoas (from 4.8 to 29.0). On the other hand,
Discussion
his study revealed that mortality rates of cyclists injured in transport accidents in Brazil are high, and presented stability in the period of 2000 to 2010. However, there was increase in the Northeast and North regions, and reduction in the South and Southeast regions. Cyclists took the forth position between fatal victims of transport accidents, after motorcy-clists, pedestrians and car occupants. he high-est mortality rates of cyclists were observed in the Center-West and South regions. Deaths were concentrated in large cities. he risk of death due to this cause was almost ive times higher among men in relation to women. Deaths were more frequent on weekends. he highest mortality rates were observed in the age groups older than 20 years old, and remained high even at older ages.
The structural fragility of bicycles, the diferential of speed between bicycles and motorized vehicles and the frequent absence of bicycle paths produce a narrow relation-ship between these means of transportation in urban regions, thus designing a highly risky scenario to cyclists. hese factors, together with the increasing leet of bicycles and the low adherence to protective equipment among
cyclists can be mentioned as explanations to the high rates of mortality of cyclists in Brazil. he Ministry of Cities estimates that the Brazilian bicycle leet is close to 75 mil-lion units, which are mainly used as a mean of transport of workers1. In the 1990s, public policies addressed to encourage the use of the bicycle were adopted in some cities10. In 1997, the Brazilian Traic Code11 determined the protection to bicycle in urban traic, including the prediction of a ine to drivers who disre-spect the minimum distance of 1.5 meters when passing or surpassing a bicycle. In 2004, the use of the bicycle had new stimulation with the Bicycle Brazil Program2.
In this study, the highest mortality rates of cyclists were registered in medium and large cit-ies, which can be explained by the size of bicycle lee and the number of motorized vehicles, as well as by the lack of cycling infrastructure. Even though the major cycling demand is in the sub-urb, cycling structures are usually in regions that are adjacent to the central area of cities3. Traic accidents are not concentrated in large cities and are not directly related to the size of the city, as in the case of homicies12. Even though metropolis have a high absolute number of traic-related deaths, in relative terms mortality is not as high as in medium and large cities.
50.0 60.0 70.0
40.0
30.0
20.0
10.0
0.0 2.4
5.6
8.3 8.97.8 3.2
31.2
16.9 20.7
15.8 19.9
23.4
15.2 21.6 22.0
11.711.8 8.3
6.8 13.2
12.7
4.8 16.8
11.0
3.4 9.6
13.814.5 16.2
13.2 11.9
11.5 16.8
13.1 26.3
23.4 25.2 18.6
16.1 32.2
23.2 28.4
24.324.6 28.6
26.6
9.3 5.4
2000 2010
RR AM AC
RO PA AP TO MA PI CE RN PB PE AL SE BA MG ES RJ SP Southeast
PR SC RS MS MT GO DF
South Center-West
Northeast North
Mean of the period 2000 – 2010 24.3
29.0 42.7
43.4
30.2
65.4
R
a
te per million
Figure 3 - Standardized mortality rates* of cyclists injured in transport accidents (per million inhabitants). States, 2000 and 2010, and Brazil, average for the period 2000 – 2010.
Figura 3 - Taxas padronizadas* de mortalidade de ciclistas traumatizados em acidentes de transporte (por milhão de habitantes). Unidades da Federação, 2000 e 2010, e Brasil, média do período 2000 – 2010.
*Age-standardized mortality rates through direct metod, using WHO world standard population.
926 Deaths of bicycle riders in Brazil: characteristics and trends during the period of 2000 – 2010Garcia, L.P. et al. Rev Bras Epidemiol
2013; 16(4): 918-29
In this study, it was observed that deaths of cyclists were more frequent on weekends, which is in accordance with other studies13. his inding can relect the use of the bicycle for leisure by people who are not so famil-iar with its risks; it can also be associated with the higher alcohol consumption during weekends14,15.
Higher mortality rates were observed in the Center-West and South regions. However, a study conducted with data from the National Household Sample Survey (PNAD), conducted in 2008, revealed that the North and Northeast regions presented the highest proportions of accidents involving bicycles, in relation to all of the transport accidents. In these regions, the importance of the events involving the cyclists can be associated with the frequent use of the bicycle as a mean of transport to work, especially in small cities and in rural areas16. A cross-sectional study conducted in the city of Pelotas, Rio Grande do Sul, with a sample of 1,705 workers aged 15 years old or more, living in the urban zone, revealed that the prevalence of bicycle use was of 17.2% (95%CI 15.4 – 19.0). Higher prevalence was found among men, with low schooling and lower economic status. Approximately 6% of the workers had sufered traic accidents with body injury in the 12 months prior to the interview17.
It is known, however, that bicycle-related accidents present high sub-notification. Another study conducted in Pelotas, which identified all of the victims of traffic acci-dents from October 1997 to September 1999, revealed that the sub-notiication of accidents with cyclists in the police reports was of 33%. Besides, in relation to running over cyclists, the lack of registers of the vehicle in charge was even higher: 47%13.
he VIVA survey (Violence and Accident Surveillance), performed in 2009 in public emergency services of 23 capitals in Brazil and in the Federal District, showed that among the 9,934 assistances due to registered transport accidents, most referred to accidents in which the victim was riding a motorcycle (50.9%), and a bicycle (18.4%), being higher than victims who were car occupants (9.5)18. Even though
the injuries caused to cyclists do not show among the main external causes of death, its relevance is evident in the emergency services. Besides, the lethality of bicycle-related accidents is high. A study conducted in the city of Pelotas, Rio Grande do Sul, showed that the lethality of pedestrians and cyclists was almost the same, about 5%, higher to that of motorcyclists (3%) and car occupants (1.3%)13. One of the relevant indings of this study was the risk of death among elderly cyclists, in relation to the other age groups. his result allied to the supposition that elderly people are not the main users of this mean of trans-port conirms the highest lethality of acci-dents in this population, already described by other studies. A study conducted with victims aged 60 years old or more, who had accidents in 1995, in the urban perimeter of the city of Maringá, Paraná, showed that the incidence of traic accidents among the elderly was of 329.2 per 100 thousand inhabitants, which is lower in comparison to the other age groups (528.2 per 100 thousand inhabitants)19. However, the coeicient of lethality was three times higher among the elderly in relation to victims aged less than 60 years old (10.3% and 3.4%, respectively), which expresses that elderly people are more vulnerable to more severe traumas. Still, 13% of the elderly who were victims of transport accidents were cyclists, only after pedestrians (52%). The authors attributed the high occurrence of bicycle accidents to how frequently this vehicle is used as a mean of transport by the elderly in the city19. A study conducted in England, with data from 2007 – 2009, calculated the risk of hospitalizations and deaths by accidents per hours of use of diferent means of transport and according to diferent age groups. Male cyclists aged 70 years old or more constituted the group with higher risk20.
transport of victims of almost one fourth of deaths caused by LTA were not known. herefore, it was chosen to proportionally redistribute these causes of death, aiming to correct, even if partially, sub-registration. However, no correction was conducted for deaths by ill-deined causes. herefore, it is possible that there is residual underestima-tion of mortality. Besides, inequalities in the quality and coverage of SIM between the studied years and regions and FU can damage the comparison of indicators between difer-ent momdifer-ents in time and geographic areas. Another limitation is related to the denomina-tor used to calculate mortality rates. he total population was used as denominator, since the number of cyclists was unknown, as well as the distance or duration of the routes taken with bicycles, which would have led to more accurate indicators. Considering the possible increased of the bicycle leet in the studied period, and the unequal distribution of popu-lations in the diferent states and regions of Brazil, the mortality rates could be under or overestimated in relation to this alternative denominator. Besides, other denominators could be used to estimate the risk of death and to allow the comparison with other means of transport20.
According to a document by SeMob, the bicycle is considered to be “transparent” or “invisible” not only because of its physical simplicity, but also by the low impact to the environment. he bicycle requires reduced infrastructure for circulation and parking, once it demands little space. Besides, it gener-ates no noise or pollutant emission. Despite that, many users of the streets only see the bicycles when considering they “disturb traic”, without considering their beneits1. Besides, the bicycle also brings beneits to the health of its users, once it leads to the practice of physical activity. Vigitel (surveillance of risk factors and protection for chronic diseases by telephonic survey), conducted in 200621, revealed that riding a bicycle is a frequently used physical activity for leisure, losing only to walking, soccer, weight lifting and running.
he Brazilian Program of Bicycle Mobility, or Bicycle Brazil Program (PBB), states that
the inclusion of the bicycle in urban disloca-tions should be approached in urban mobility policies as a way of social inclusion, besides reducing and eliminating pollutant agents and improving the health of the popula-tion1. Among its objectives, stimulating city governments to establish cycling systems and a creating set of actions to guarantee the safety of the cyclists in urban dislocations stand out2. he insertion of the bicycle in the current transport systems should be encour-aged, with the construction of bicycle paths and bicycle lanes, and the inclusion of the modern concept of cyclable routes, which are shared traic routes adapted for the safe use of the bicycle1. A literature review iden-tiied the construction of exclusive spaces for the circulation of bicycles (bicycle paths and bicycle lanes) as the main suggestion to increase safety22. Aiming at the reduction of deaths among cyclists, besides the investments in infrastructure, the use of protective equip-ment should be encouraged. he mandatory equipment for bicycles with rim superior to 20 is: rear view mirror on the left side, attached to the handlebars with no support rod; bell; night relection signaling, with visibility of at least 30 meters, in the front, in the back, on the sides and on the pedals23.
928 Deaths of bicycle riders in Brazil: characteristics and trends during the period of 2000 – 2010Garcia, L.P. et al. Rev Bras Epidemiol
2013; 16(4): 918-29
in Victoria, Australia, demonstrated that the number of head traumas reduced 70% two years after the use of the helmet became mandatory by law, in 1990. here was also a 28% reduction in the number of deaths of cyclists26. A study conducted in Ontario, Canada, revealed that the mortality rate of cyclists aged from 1 to 15 years old presented a 55% reduction after a similar law was estab-lished, in 199527.
In this study, it was observed that some type of head trauma was involved in more than 40% of deaths among cyclists, which is in accordance with another study28. his inding can be strongly related to the low adherence to protective equipment, especially the helmet. Facing this fact, the use of helmets by cyclists is strongly recommended. Such resistance is known due to the cost of the helmet, incon-venience (discomfort, heat, among others), or low social acceptance in certain groups29. In order to favor the adherence to this rec-ommendation, it is especially suggested to lower the price of this product, aiming at the reduction of its cost in order to make the product more accessible, since this initiative
References
1. Brasil. Ministério das Cidades, Secretaria Nacional de Transporte e da Mobilidade Humana. Programa Bicicleta Brasil. Programa Brasileiro de Mobilidade por Bicicleta. Brasília (DF); 2007.
2. Brasil. Ministério das Cidades. Portaria no 399, de 22 de setembro de 2004. 2004.
3. Feder M, Moscarelli F, Lopes SB. Considerações sobre o uso da bicicleta em Porto Alegre a partir da análise dos acidentes com vítimas fatais. Anais do 16º Congresso Brasileiro de Transporte e Trânsito. Maceió, 2007. Disponível em http://www.cbtu.gov.br/estudos/pesquisa/ antp_16congr/resumos/arquivos/antp2007_21.pdf. (Acessado em 15 de janeiro de 2013).
4. World Health Organization (WHO). 2nd Global Status Report on Road Safety [Internet]. Disponível em: http:// www.who.int/violence_injury_prevention/global_status_ report/lyer_en.pdf. (Acessado em 15 de janeiro de 2013).
5. Organización Panamericana de la Salud. Informe sobre el Estado de la Seguridad Vial en la Región de las Américas. Washington; 2009.
6. Reichenheim ME, De Souza ER, Moraes CL, De Mello Jorge MHP, Da Silva CMFP, De Souza Minayo MC. Violence and injuries in Brazil: the efect, progress made, and challenges ahead. Lancet 2011; 377(9781): 1962-75.
7. Souza MFM, Malta DC, Conceição GMS, Silva MMA, Gazal-Carvalho C, Morais Neto OL. Análise descritiva e de tendência de acidentes de transporte terrestre para políticas sociais no Brasil. Epidemiol e Serv Saúde 2007; 16(1): 33-44.
8. Grupo Técnico de Prevenção de Acidentes e Violências. Centro de Vigilância Epidemiológica “Prof. Alexandre Vranjac”. Coordenadoria de Controle de Doenças. Secretaria de Estado da Saúde de São Paulo. O impacto dos acidentes e violências nos gastos da saúde. Rev Saúde Pública. 2006; 40(3): 553-6.
9. Ahmad OB, Boschi-Pinto C, Lopez AD, Murray CJ, Lozano R, Inoue M. Age Standardization of Rates: A New WHO Standard; 2001.
10. Afonso NS, Badini C, Gouvea F. Mobilidade e Cidadania. São Paulo: ANTP; 2003.
11. Código de Trânsito Brasileiro. Lei no 9.503, de 23 de setembro de 1997.
12. Confederação Nacional de Municípios (CNM). Estudos técnicos. Mapeamento das Mortes por Acidentes de Trânsito no Brasil. 2009.
13. Barros AJD, Amaral RL, Oliveira MSB, Lima SC, Gonçalves EV. Acidentes de trânsito com vítimas: sub-registro, caracterização e letalidade. Cad Saúde Pública 2003; 19(4): 979-86.
would have great impact on the adherence to this practice. Another suggestion is the con-nection between the sale of the helmet to the sale of the bicycle, so that all cyclists already receive the helmet when they acquire a new bicycle. he proper regulation and supervi-sion as to the quality of this product are also necessary, as well as the implementation of educational measures.
14. Abreu ÂMM, Lima JMB de, Matos LN, Pillon SC. Uso de álcool em vítimas de acidentes de trânsito: estudo do nível de alcoolemia. Rev Latino-Am Enfermagem 2010;18(spe):513-20.
15. Brasil. Ministério da Saúde (MS). Secretaria de Vigilância em Saúde. Viva: vigilância de violências e acidentes, 2008 e 2009. Brasília : Ministério da Saúde; 2010.
16. Malta DC, Mascarenhas MDM, Bernal RTI, Silva MMA da, Pereira CA, Minayo MC de S, et al. Análise das ocorrências das lesões no trânsito e fatores relacionados segundo resultados da Pesquisa Nacional por Amostra de Domicílios (PNAD) Brasil, 2008. Ciênc Saúde Coletiva 2011;16(9): 3679-87.
17. Bacchieri G, Barros AJD, Santos JV dos, Gonçalves H, Gigante DP. Intervenção comunitária para prevenção de acidentes de trânsito entre trabalhadores ciclistas. Rev Saúde Pública 2010; 44(5): 867-75.
18. Malta DC, Bernal RTI, Mascarenhas MDM, Monteiro RA, Sá NNB de, Andrade SSC de A, et al. Atendimentos por acidentes de transporte em serviços públicos de emergência em 23 capitais e no Distrito Federal - Brasil, 2009. Epidemiol Serv Saúde 2012; 21(1): 31-42.
19. Souza RKT, Soares DFPP, Mathias AF, Andrade OG, Santana RG. Idosos vítimas de acidentes de trânsito: aspectos epidemiológicos e impacto na sua vida cotidiana. Acta Sci Health Sci 2003; 25(1): 19-25.
20. Mindell JS, Leslie D, Wardlaw M. Exposure-based, “like-for-like” assessment of road safety by travel mode using routine health data. Baradaran HR. PLoS ONE 2012; 7(12): e50606.
21. Brasil. Ministério da Saúde. Secretaria de Vigilância em Saúde. Secretaria de Gestão Estratégica e Participativa. Vigitel Brasil 2006: vigilância de fatores de risco e proteção para doenças crônicas por inquérito telefônico. Brasília : Ministério da Saúde; 2007.
22. Bacchieri G, Barros AJD. Acidentes de trânsito no Brasil de 1998 a 2010: muitas mudanças e poucos resultados. Rev Saúde Pública 2011; 45(5): 949-63.
23. Conselho Nacional de Trânsito - CONTRAN. Resolução no 46, de 21 de maio de 1998.
24. Bacchieri G, Gigante DP, Assunção MC. Determinantes e padrões de utilização da bicicleta e acidentes de trânsito sofridos por ciclistas trabalhadores da cidade de Pelotas, Rio Grande do Sul, Brasil. Cad Saúde Pública 2005; 21(5): 1499-508.
25. hompson DC, Rivara F, hompson R. Helmets for
preventingheadand facial injuries in bicyclists. In: he Cochrane Collaboration, Rivara F. Cochrane Database of Systematic Reviews. Chichester, UK: John Wiley & Sons, Ltd; 1999.
26. Cameron MH, Vulcan AP, Finch CF, Newstead SV.
Mandatory bicycle helmet use following a decade of helmet promotion in Victoria, Australia--an evaluation. Accid Anal Prev 1994; 26(3): 325-37.
27. Wesson DE, Stephens D, Lam K, Parsons D, Spence L, Parkin PC. Trends in pediatric and adult bicycling deaths before and after passage of a bicycle helmet law. Pediatrics 2008; 122(3): 605-10.
28. Powell EC, Tanz RR. Cycling injuries treated in emergency departments: need for bicycle helmets among preschoolers. Arch Pediatr Adolesc Med 2000; 154(11): 1096-100.
29. Graitcer PL, Kellermann AL, Christofel T. A review of educational and legislative strategies to promote bicycle helmets. Inj Prev 1995; 1(2): 122-9.
30. Garcia LP, Freitas LRS de, Duarte EC. Avaliação preliminar do impacto da Lei da Cadeirinha sobre os óbitos por acidentes de automóveis em menores de dez anos de idade, no Brasil: estudo de séries temporais no período de 2005 a 2011. Epidemiol Serv Saúde 2012; 21(3): 367-74.
31. Malta DC, Soares Filho AM, Montenegro M de MS, Mascarenhas MDM, Silva MMA da, Lima CM, et al. Análise da mortalidade por acidentes de transporte terrestre antes e após a Lei Seca - Brasil, 2007-2009. Epidemiol Serv Saúde 2010; 19(4): 317-28.
32. Brasil. Presidência da República. Casa Civil. Lei no 11.706, de 19 de junho de 2008.
33. Brasil. Conselho Nacional de Trânsito - CONTRAN. Resolução no 277, de 28 de maio de 2008.