Revista
Brasileira
de
Hematologia
e
Hemoterapia
Brazilian
Journal
of
Hematology
and
Hemotherapy
w w w . r b h h . o r g
Original
article
Evaluation
of
red
cell
and
reticulocyte
parameters
as
indicative
of
iron
deficiency
in
patients
with
anemia
of
chronic
disease
Ana
Beatriz
Barbosa
Torino,
Maria
de
Fátima
Pererira
Gilberti,
Edvilson
da
Costa,
Gisélia
Aparecida
Freire
de
Lima,
Helena
Zerlotti
Wolf
Grotto
∗UniversidadeEstadualdeCampinas(UNICAMP),Campinas,SP,Brazil
a
r
t
i
c
l
e
i
n
f
o
Articlehistory:
Received25March2014 Accepted24July2014
Availableonline18September2014
Keywords:
Automation
Anemia,Iron-deficiency Redcellindices Reticulocytes Erythropoiesis
a
b
s
t
r
a
c
t
Objective:Thepurposeofthisstudywastoevaluatetheeffectivenessofmatureredcelland reticulocyteparametersunderthreeconditions:irondeficiencyanemia,anemiaofchronic disease,andanemiaofchronicdiseaseassociatedwithabsoluteirondeficiency.
Methods:Peripheralbloodcellsfrom117adultpatientswithanemiawereclassified accord-ing to iron status, and inflammatory activity, and the results of a hemoglobinopathy investigationas:irondeficiencyanemia(n=42),anemiaofchronicdisease(n=28),anemia ofchronicdiseaseassociatedwithirondeficiencyanemia(n=22),andheterozygous tha-lassemia(n=25).Thepercentageofmicrocyticredcells,hypochromicredcells,andlevelsof hemoglobincontentinbothreticulocytesandmatureredcellsweredetermined.Receiver operatingcharacteristicanalysiswasusedtoevaluatetheaccuracyoftheparametersin differentiatingbetweenthedifferenttypesofanemia.
Results:Therewasnosignificantdifferencebetweentheirondeficientgroupandanemia ofchronicdiseaseassociatedwithabsoluteirondeficiencyinrespecttoanyparameter. Thepercentageofhypochromicredcellswasthebestparametertodiscriminateanemia ofchronicdiseasewithandwithoutabsoluteirondeficiency(areaundercurve=0.785;95% confidenceinterval:0.661–0.909,withsensitivityof72.7%,andspecificityof70.4%;cut-off value1.8%).Theformulamicrocyticredcellsminushypochromicredcellswasvery accu-rateindifferentiatingirondeficiencyanemiaandheterozygousthalassemia(areaunder curve=0.977;95%confidenceinterval:0.950–1.005;withsensitivityof96.2%,andspecificity of92.7%;cut-offvalue13.8).
Conclusion:Theindicesrelatedtoredcellsandreticulocyteshaveamoderateperformance inidentifyingabsoluteirondeficiencyinpatientswithanemiaofchronicdisease.
©2014Associac¸ãoBrasileiradeHematologia,HemoterapiaeTerapiaCelular.Published byElsevierEditoraLtda.Allrightsreserved.
∗ Correspondingauthor at:DepartamentodePatologiaClínica, Faculdadede CiênciasMédicas,UniversidadeEstadualde Campinas
(UNICAMP),CidadeUniversitáriaZeferinoVaz,BarãoGeraldo,13083-970Campinas,SP,Brazil. E-mailaddress:[email protected](H.Z.W.Grotto).
http://dx.doi.org/10.1016/j.bjhh.2014.09.004
Introduction
Newautomatedbloodcellanalyzerscanprovideinformation aboutindividualcellcharacteristics,includingthehemoglobin contentofreticulocytesandmatureredbloodcells,and per-centagesofmicrocyticred cellsandhypochromic redcells. Thesenew parametershave beenused inthe diagnosis of irondeficiencyanemia(IDA),thalassemia(-thal)carriers,1–3 andanemiaofchronicdisease (ACD).4,5 Thedifferentiation betweenthesethreeconditionsisveryimportantasthe clin-icalapproachisuniquetoeachparticularcondition.
Asreticulocyteshaveanormallifespanofonetotwodays, informationconcerningthehemoglobincontentofyoungred cellsisagood measurementoftheironavailabilityand an early marker ofiron deficient erythropoiesis.6 Reticulocyte hemoglobin equivalent (Ret-He) reflects real-time informa-tiononthesynthesisofyoungredcellsinthebonemarrow. Otheravailableparametersarethepercentageofredcellswith Hbcontentequivalenttoorlessthan17pg(%HypoHe),and thepercentageofredcells withavolumeoflessthan60fL (%MicroR),1whichcorrespondstoasub-populationofmature redcellsexhibitingevidenceofinsufficientironcontent.
A mathematical formula using %MicroR and %HypoHe
(MHe), proposed by Urrechaga et al.,7 tested discriminant indicesinhealthyindividuals,-thalandIDApatients;its sen-sitivitywas97.4%andspecificitywas97.1%indifferentiating
-thalfrommildIDA.
Anemiaassociatedwithchronicinflammation,infection ormalignancyisthemostcommonanemiainhospitalized patients.Althoughstainableironispresentinthebone mar-row, elevated levels ofinflammatory cytokines interfere in erythropoiesis, leading to a hyporegenerative anemia and defectiveironincorporationintoredcellprogenitors.Reduced concentrationsofcirculating iron and normalor increased ironstorescharacterizeastateoffunctionalirondeficiency.8
Anemia of inflammation can be associated with abso-luteirondeficiency(ADCcombi),generallyinpatientswith inflammatorydiseaseandchronicbloodloss.Differentiation betweenACDandACDcombiisclinicallyimportant,but in theclinicalpracticethisdifferentiationisdifficultwhenusing conventionalbiomarkerssuchasferritinconcentrationand transferrin saturation.9 Thesolubletransferrin receptor/log ferritinratiomaybeusefulindistinguishingACDfromACD combi.10
Theaimofthestudywastoanalyzetheeffectivenessof newlaboratoryparametersrelatedtomatureredbloodcells andreticulocytesindifferentiatingthreeconditionsrelatedto irondeficiency:IDA,ACDandACDcombi.Indeed,the perfor-manceoftheparameterswillbetestedtodistinguishIDAfrom
-thal,twocommoncausesofmicrocyticanemia.
Methods
Thisprojectwas approvedbythe Ethics Committeeofthe FaculdadedeCiênciasMédicasdaUniversidadeEstadualde Campinas (UNICAMP), São Paulo, Brazil. All samples were selectedfromroutinebloodcollectionsandsoinformed con-sentwaswaived.
Peripheralbloodsamplesfrom117adultpatientswith ane-mia(Hb<12.0g/dLforwomenandHb<14.0g/dLformen)were selectedfromtheroutineworkload.Bloodanalysishadbeen requestedbygeneralpractitionersmostlytoinvestigate ane-mia.
Patientswere classifiedaccordingtoironstatusanalysis (commercialkitsfromRocheDiagnostics,Germany):IDAwhen serumiron(SI)levelswere<45mg/dLformenand<30mg/dL for women,transferrin saturation <15% and serum ferritin <30g/Lformenand<13g/Lforwomen.
PatientswereclassifiedasACDwhenSIlevelswerenormal orlessthannormal(40–160mg/dLand30–160mg/dLformen andwomen,respectively),transferrinsaturationwasnormal orlessthannormal(30–50%),serumferritinlevelswere nor-malorhigh(30–400g/Land13–150g/Lformenandwomen, respectively)andC-reactiveprotein>5mg/dL(Tina-Quant C-ReactiveProtein,RocheDiagnostics,Germany).
Solubletransferrinreceptor(sTfR)levels(Roche Diagnos-tics,Germany)weremeasuredinallsamples,andthesTfR/log ferritinratiowasusedtoidentifyirondeficiencyinpatients withACD.PatientswithACDshowingsTfR/logferritin>2.06or sTfR>3.71g/mL(cut-offvaluesindicativeofirondeficiency inourlaboratory)wereclassifiedasACDcombi.
Twenty-sixpatientshaddiagnosesof-thalaccordingto thelevelofhemoglobinA2determinedbyhighperformance liquidchromatography(HPLC-VariantII–HemoglobinTesting System,Bio-RadLaboratories,Inc.,CA,USA).
Patientswith-thalassociatedwithotherkindsofanemia, patientswithreticulocytosisorpancytopenia,individualsthat hadreceivedtransfusionswithinthepreviousthreemonths, andpatientsonironreplacementtherapywereexcludedfrom thestudy.
A control group was composed of apparently healthy individuals with no clinical signs or symptoms ofdisease, including acute inflammatory/infection, and with normal hematologic findings, and C-reactive protein <5mg/L. The healthy individuals were students or laboratory staff, all
of whom had donated blood samples on a voluntary
basis.
Determinationofredcellandreticulocyteparameterswas performedusingaSysmexXE-5000automatedhematological analyzer(Sysmex,Kobe,Japan),whichprovidedthefollowing parameters:Ret-He,%MicroR,hemoglobincontentofredcells obtainedfromopticalcounting(RBC-He),and%HypoHe.The MHeindexwascalculatedas%MicroR−%HypoHe.7
The Mann–Whitney test was applied to compare the
groups. A receiveroperator characteristic (ROC) curve was used to evaluatethe accuracy ofthe parameters to differ-entiate betweenthe differenttypesofanemia. Thelevelof significancewassetatap-value<0.05.Data wereanalyzed usingSPSSforWindows,Version13.0(SPSSInc.,Chicago,IL, USA).
Results
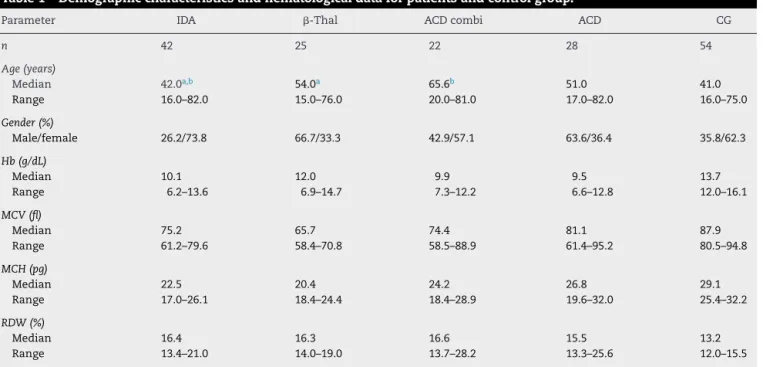
Table1–Demographiccharacteristicsandhematologicaldataforpatientsandcontrolgroup.
Parameter IDA -Thal ACDcombi ACD CG
n 42 25 22 28 54
Age(years)
Median 42.0a,b 54.0a 65.6b 51.0 41.0
Range 16.0–82.0 15.0–76.0 20.0–81.0 17.0–82.0 16.0–75.0
Gender(%)
Male/female 26.2/73.8 66.7/33.3 42.9/57.1 63.6/36.4 35.8/62.3
Hb(g/dL)
Median 10.1 12.0 9.9 9.5 13.7
Range 6.2–13.6 6.9–14.7 7.3–12.2 6.6–12.8 12.0–16.1
MCV(fl)
Median 75.2 65.7 74.4 81.1 87.9
Range 61.2–79.6 58.4–70.8 58.5–88.9 61.4–95.2 80.5–94.8
MCH(pg)
Median 22.5 20.4 24.2 26.8 29.1
Range 17.0–26.1 18.4–24.4 18.4–28.9 19.6–32.0 25.4–32.2
RDW(%)
Median 16.4 16.3 16.6 15.5 13.2
Range 13.4–21.0 14.0–19.0 13.7–28.2 13.3–25.6 12.0–15.5
IDA:irondeficiencyanemia;-thal:heterozygousbetathalassemia;ACDcombi:anemiaofchronicdiseaseassociatedwithabsoluteiron deficiency;ACD:anemiaofchronicdisease;CG:controlgroup;Hb:hemoglobin;MCV:meancellvolume;MCH:meancellhemoglobin;RDW:red celldistributionwidth.
a p=0.030.
b p=0.023.
Table1describesthedemographiccharacteristicsand lab-oratorialdataofthepatientsandcontrolgroup,andTable2
shows the iron status measurements used to classify the patientsinthedifferentgroups.
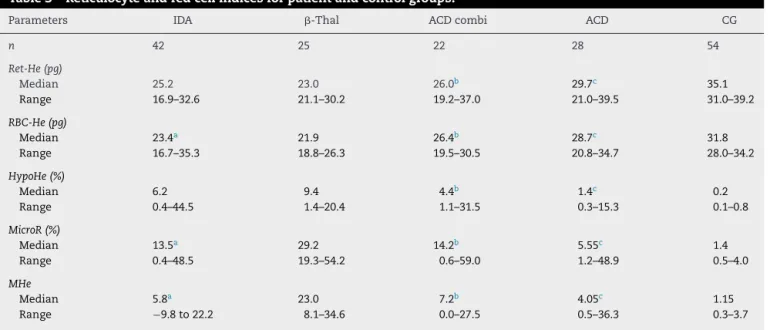
As expected the -thal group had the highest %MicroR (Table3).The%HypoHewasalsohigherinthe-thalgroup when compared to other groups, except for IDA patients.
However,asthemicrocyticcellsweremoreabundantinthe
-thalgroup,whenthesetwoparameterswereassociatedin theMHeindex,thedifferencebecamemoreevidentand sta-tisticallysignificant.
TheMann–Whitneytestshowednosignificantdifference between the IDA and ACD combi groups in respect to all
parameters. When the ACD and ACD combi groups were
Table2–Biochemicaldata.
Parameters IDA -Thal ACDcombi ACD CG
n 42 25 22 28 54
SI(mg/dL)
Median 24.5 94.0 23.5 28.0 100.0
Range 7.0–73.0 49.0–224.0 12.0–99.0 9.0–98.0 49.0–185.0
TS(%)
Median 6.1 31.9 9.2 11.6 29.5
Range 1.5–15.5 22.4–68.2 4.5–25.7 3.0–42.2 17.6–50.1
SF(g/L)
Median 8.2 224.5 254.5 163.7 59.6
Range 3.2–23.4 66.8–1619.0 27.8–2000.0 42.1–2000.0 19.7–407.9
sTfR(g/mL)
Median 9.4 7.4 7.0 2.7 2.4
Range 1.4–28.8 2.6–25.5 3.5–22.4 0.5–6.2 1.6–3.8
sTfR/logferritin
Median 10.4 2.6 3.4 1.1 1.3
Range 1.9–40.9 1.3–10.9 1.3–9.6 0.2–3.8 0.8–2.2
Table3–Reticulocyteandredcellindicesforpatientandcontrolgroups.
Parameters IDA -Thal ACDcombi ACD CG
n 42 25 22 28 54
Ret-He(pg)
Median 25.2 23.0 26.0b 29.7c 35.1
Range 16.9–32.6 21.1–30.2 19.2–37.0 21.0–39.5 31.0–39.2
RBC-He(pg)
Median 23.4a 21.9 26.4b 28.7c 31.8
Range 16.7–35.3 18.8–26.3 19.5–30.5 20.8–34.7 28.0–34.2
HypoHe(%)
Median 6.2 9.4 4.4b 1.4c 0.2
Range 0.4–44.5 1.4–20.4 1.1–31.5 0.3–15.3 0.1–0.8
MicroR(%)
Median 13.5a 29.2 14.2b 5.55c 1.4
Range 0.4–48.5 19.3–54.2 0.6–59.0 1.2–48.9 0.5–4.0
MHe
Median 5.8a 23.0 7.2b 4.05c 1.15
Range −9.8to22.2 8.1–34.6 0.0–27.5 0.5–36.3 0.3–3.7
IDA:irondeficiencyanemia;-thal:heterozygousbetathalassemia;ACDcombi:anemiaofchronicdiseaseassociatedwithabsoluteiron deficiency;ACD:anemiaofchronicdisease;CG:controlgroup;Ret-He:reticulocytehemoglobincontent;RBC-He:redbloodcellhemoglobin content;HypoHe:percentageofhypochromicredcells;MicroR:percentageofhypochromicredcells;MHe:MicroR−HypoHeindex.
Mann–Whitneytestwasappliedforcomparisonbetweengroups.
a p<0.01(IDA×-thal).
b p≤0.01(ACD×ACDcombi).
c p<0.001(ACD×CG).
compared,the RBC-He andRet-He were significantlylower fortheACDcombigroup(p-value=0.016andp-value=0.003, respectively). Meanwhile, the %MicroR, %HypoHe and the valueofMHeweresignificantlyhigherintheACDcombigroup (p-value=0.001, p-value=0.003 and p-value=0.014, respec-tively).
AlthoughtheACDgrouphadsTFR/logferritinvaluesbelow thecut-offlimitindicativeofirondeficiency,theRet-Heand RBC-Hevaluesweresignificantlyreducedwhencomparedto thecontrolgroup.However,the%HypoHe,%MicroRandMHe werehigher(p-value<0.001forall).
ThebesttesttodifferentiateIDAfrom-thalwastheMHe index(areaundercurve–AUC:0.977;95%confidenceinterval [95%CI]:0.950–1.005).Valuesbelowthecut-offof13.8showed asensitivityof96.2%andspecificityof92.7%inidentifyingIDA patients.Agoodperformancewasseenforthe%MicroR(AUC: 0.886;CI95%:0.810–0.963),andvalues<25.0%gavesensitivity of84.6%andspecificityof78.0%indetectingirondeficiency.
When the ROCcurve wasapplied tothe ACD and ACD combi groups, the best performance was seen with the %HypoHeparameter,althoughwitha moderateAUC value (AUC:0.785;95%CI:0.661–0.909;sensitivity72.7%,and speci-ficity71.4%;cut-off:1.8%).
The best parameter to distinguish IDA from ACD was the%HypoHe(AUC:0.835; 95% CI:0.737–0.933). Avaluefor %HypoHe<2.45%hadasensitivityof75.4%andspecificityof 70.4%inidentifyingACD.TheAUCswerelowerforRBC-He (AUC:0.809;95%CI:0.696–0.922),Ret-He(AUC:0.780;95%CI: 0.661–0.899),and%MicroR(AUC:0.785;95%CI:0.662–0.908).
ThecapacityofthetestsindiscriminatingIDAfromACD combiwasnotsatisfactoryastheAUCwaslowerthan0.700 forallparameters.
Discussion
Thediagnostic performanceofreticulocyteparametershas beentestedbymanyauthors,especiallyforthediagnosisof irondeficiency inpatientssubmittedtodialysis.6,10,11 Mea-surementofthereticulocytecontentishelpfulindetecting theearlieststagesofirondeficiency,priortothedevelopment ofanemia.6,12,13Thereductioninreticulocytehemoglobinhas been observed in other conditions besides iron deficiency, suchasinhemoglobinopathies.14,15
Theeffectivenessofusingreticulocyteparametersto diag-noseIDAand ACDhasbeentested inother studies.2,8,16 In arecentstudywithgeriatricpatients,theauthorsconcluded thatRet-Hedoesnotperformbetterthantheclassicindices, such as mean cell hemoglobin and mean cell hemoglobin concentrationindifferentiatingbetweenIDAandACD.5Our resultsshow that, althoughthe Ret-Hevalue waslower in IDA than ACD, theaccuracyofthe testtodistinguishboth types of anemia was moderate, and lower than using the %HypoHe. A potential utility of Ret-He was demonstrated in a study with patients with chronic rheumatic disease and anemia. The predictive value ofRet-He was tested in responsetooralirontherapy,andaccordingtotheauthors, thefindingssupporttheroleofRet-Heasamarkerforiron responsiveness.17
TheMHeindexwasfirstproposedandtestedbyUrrechaga etal.16 Theperformanceofthisindexwas better (sensitiv-ity98.0%and specificity95.9)thanotherpublishedindices. The authors suggest that samples with MHe values >11.5 canbechosenforfurtheranalysistoconfirmthediagnosis of-thal. These dataare coincident with our results. The MHeindexshowed thebest performanceindiscriminating IDAfrom-thal,althoughthecut-offvalueisdifferentfrom thevaluedescribedbyUrrechagaetal.,16probablybecause we did not separate patients according to the severity of anemia.
As far as we know, no other reports exist about
the efficiency of other red cell parameters in patients with anemia of inflammation associated with absolute iron deficiency. The clinical utility of the determination of the %Hypo has long been recognized in differentiat-ingbetweeniron-deficientandiron-sufficientpatientswith chronickidneydiseasewhoreceiveerythropoietinstimulating agents.20
ThesTfR/logferritinratiovalueswerecalculatedtoidentify irondeficiencyinpatientswithACD.ThemeasurementofsTfR hasbeenconsideredagoodindicatoroffunctionalironstatus asitdoesnotsuffertheinfluencesofsystemicinflammation unlikeSI,transferrin,andferritinmeasurements.21,22 Thus, whenthereisareductionoffunctionaliron,transferrin recep-torsynthesisisstimulated,aswasobservedinourresults.Iron deficiencyischaracterizedbyanincreaseinsTfRlevelsand lowferritinvalues,whileinanemiaofinflammation, transfer-rinreceptorlevelsareonlyslightlyaffectedandserumferritin isgreatlyincreased.23Intheclinicalpracticethis differentia-tionisimportantbecauseironsupplementationisbeneficial for ACD combi, but may be deleterious for ACD patients. AccordingtoourresultsthebestparametertodistinguishACD combifromACDwasthe%HypoHeeventhoughthe sensitiv-ityandspecificityweremoderate,followedby%MicroR.Itis interestingtonotethattherewerenodifferencesbetweenthe IDAandACDcombigroupsforanytest,asopposedto differ-encesobservedwhenACDwascomparedwithIDA.Infact, theabsoluteirondeficiencyassociatedtoACDincreasesthe numberofmicrocyticandhypochromicredcells,developing cellfeatures similartoIDA.ACDpatientsshowed evidence ofreduced iron availability for erythropoiesis, but the dis-turbanceoftheironmetabolisminfunctionalirondeficiency was less remarkable than in the association of ACD with IDA.
In practical terms the incorporation of new cellular indicescanspeedupdiagnosisofIDA,-thalandACD,and consequently target more quickly and more precisely the subsequent confirmatory exams in order to introduce the appropriatetreatment.On theother hand,the difficulty in identifyingabsoluteirondeficiencyinpatientswith inflam-matoryconditionsremains.Therefore,thechallengepersists, andotherstudiesareneededtofindaparameterwithvalue inclinicaldecisionmaking.
Conflicts
of
interest
Theauthorsdeclarenoconflictsofinterest.
r
e
f
e
r
e
n
c
e
s
1.UrrechagaE,BorqueL,EscaneroJF.Erythrocyteand
reticulocyteparametersinirondeficiencyandthalassemia.J ClinLabAnal.2011;25(3):223–8.
2.CanalsC,RemachaAF,SardáMP,PiazueloJM,RoyoT,Romero A.ClinicalutilityofthenewSysmexXE-2100parameter– reticulocytehemoglobinequivalent–inthediagnosisof anemia.Haematologica.2005;90(8):1133–4.
3.SudmannAA,PiehlerA,UrdalP.Reticulocytehemoglobin equivalenttodetectthalassemiaandthalassemic hemoglobinvariants.IntJLabHematol.2012;34:605–13.
4.MarkovicM,Majkic-SinghN,IgnjatovicS,SinghS. Reticulocytehaemoglobincontentvs.solubletransferrin receptorandferritinindexinirondeficiencyanemia accompaniedwithinflammation.IntJLabHematol. 2007;29(5):341–6.
5.JoostenE,LioenP,BrusselmansC,IndevuystC,BoeckxN.Is analysisofthereticulocytehaemoglobinequivalentauseful testfordiagnosisofirondeficiencyanemiaingeriatric patients?EurJIntMed.2013;24(1):63–6.
6.BrugnaraC,SchillerB,MoranJ.Reticulocytehemoglobin equivalent(RetHe)andassessmentofiron-deficientstates. ClinLabHaematol.2006;28(5):303–8.
7.UrrechagaE,BorqueL,EscaneroJF.Theroleofautomated measurementofredcellsubpopulationsontheSysmexXE 5000analyzerinthedifferentialdiagnosisofmicrocytic anemia.IntJLabHematol.2011;33(1):30–6.
8.ThomasC,ThomasL.AnemiaofChronicDisease:pathology andlaboratorydiagnosis.LabHematol.2005;11(1):14–23.
9.MastA.Theclinicalutilityofperipheralbloodtestsinthe diagnosisofirondeficiencyanemia.Bloodline.2001;1:7–9.
10.TheurlI,AgnerE,TheurlM,NairzM,SeiferM,SchrollA,etal. Regulationofironhomeostasisinanemiaofchronicdisease andirondeficiencyanemiadiagnosisandtherapeutic implications.Blood.2009;113(21):5277–86.
11.FishbaneS,ShapiroW,DuktaP,ValenzuelaOF,FaubertJ.A randomizedtrialofirondeficiencytestingstrategiesin hemodialysispatients.KidneyInt.2001;60(6):
2406–11.
12.WaradyBA,KauszA,LernerG,BrewerED,ChadhaV,Brugnara C,etal.Irontherapyinthepediatrichemodialysis
population.PediatrNephrol.2004;19(6):655–61.
13.BrugnaraC.Reticulocytecellularindices:anewapproachin thediagnosisofanemiasandmonitoringoferythropoietic function.CritRevClinLabSci.2000;37(2):93–130.
14.StoffmanN,BrugnaraC,WoodsER.Analgorithmusing reticulocytehemoglobincontent(CHr)measurementin screeningadolescentsforirondeficiency.JAdolescHealth. 2005;36(6):529.
15.ChouliarasGL,StamoulakatouA,TsiftisG,PerissakiG, PremetisE,LycopoulouL.Age,betathalassaemiatrait,and iron-deficiencyanaemiasignificantlyaffectreticulocyte indicesinpre-schoolchildren.EurJPediatr.
2010;169(9):1097–104.
16.UrrechagaE,BorgesL,EscaneroJF.Analysisofreticulocyte parametersontheSysmexXE5000andLH750analyzersin thediagnosisofinefficienterythropoiesis.IntJLabHematol. 2011;33(1):37–44.
17.vanSantenS,demastQ,OostingJD,vanEdeA,SwinkelsDW, vanderVenAJ.Hematologicalparameterspredictinga responsetooraltherapyinchronicinflammation. Haematologica.2014[Epubaheadofprint].
19.SchoorlM,SchoorlM,LinssenJ,VillanuevaMM,NoGuerraJA, MaritnezPH,etal.Efficacyofadvanceddiscriminant algorithmsforscreeningoniron-deficiencyanemiaand
-thalassemiatrait:amulticentricevaluation.AmJClin Pathol.2012;138(2):300–4.
20.TessitoreN,SoleroGP,LippiG,BassiA,FacciniGB,BedognaV, etal.Theroleofironstatusmarkersinpredictingresponseto intravenousironinhaemodialysispatientsonmaintenance erythropoietin.NephrolDialTransplant.2001;16(7):1416–23.
21.PunnonenK,IrjalaK,RajamakiA.Serumtransferrinreceptor anditsratiotoserumferritininthediagnosisofiron deficiency.Blood.1997;89(3):1052–7.
22.MalopeBI,MacPhailAP,AlbertsM,HissDC.Theratioof serumtransferrinandserumferritininthediagnosisofiron status.BrJHaematol.2001;115(1):84–9.