www.solid-earth.net/3/63/2012/ doi:10.5194/se-3-63-2012
© Author(s) 2012. CC Attribution 3.0 License.
Solid Earth
Effect of glacial-interglacial sea-level changes on the displacement
and stress field in the forearc and along the plate interface of
subduction zones
T. Li and A. Hampel
Institut f¨ur Geologie, Leibniz-Universit¨at Hannover, Callinstr. 30, 30167 Hannover, Germany
Correspondence to:T. Li ([email protected])
Received: 7 December 2011 – Published in Solid Earth Discuss.: 21 December 2011 Revised: 3 February 2012 – Accepted: 4 February 2012 – Published: 22 February 2012
Abstract. Combined seismological, space-geodetic and nu-merical studies have shown that the seismicity at subduc-tion zones may be modulated by tides and glacier fluctua-tions on timescales of 1–100 a, because these changes in loads on Earth’s surface are able to alter the stress field in the upper plate and along the plate interface. Here we use a two-dimensional finite-element model of a subduction zone to investigate how glacial-interglacial sea-level changes af-fect the forearc region and the plate interface. The model results show that a sea-level fall by 125 m over 100 ka causes up to 0.7 m of vertical displacement, with the maximum up-lift occurring between the trench and the coast. The upup-lift signal induced by the sea-level fall decreases to zero∼20 km
landward of the coastline. A subsequent sea-level rise by 125 m over 20 ka causes subsidence, which is again most pronounced in the submarine part of the forearc. The sea-level changes cause horizontal displacements of up to 0.12 m, which are directed seaward during sea-level fall and land-ward during sea-level rise. With respect to the stress field, the sea-level changes lead to variations in the vertical stress and the shear stress of up to 1.23 MPa and 0.4 MPa, respec-tively. The shear stress variations are highest beneath the coast, i.e. in the area where the sea-level changes cause the strongest flexure. The resulting Coulomb stress changes on the plate interface are of the order of 0.2–0.5 MPa and in-dicate that earthquakes are promoted during sea-level fall and delayed during sea-level rise. Our findings imply that eustatic sea-level changes during glacial-interglacial peri-ods may have induced displacements and stress changes that were large enough to affect the seismic cycle of subduction thrusts.
1 Introduction
Active faulting in subduction zones poses a serious seismic threat to the often densely populated coastal regions. As a consequence, much effort has been put into monitoring the seismicity beneath the forearc and the identification of pa-rameters that may modulate the frequency and magnitude of earthquakes on different timescales. One of the first pa-rameters that were recognized to affect the seismicity in sub-duction zones was the ocean tides. The hypothesis of ocean tides as a trigger of earthquakes was put forward by Nasu et al. (1931) after an earthquake hit central Japan in 1930. Since then, a positive correlation between ocean tides and earthquake occurrences has been documented by many stud-ies (e.g. Shlien, 1972; Tsuruoka et al., 1995; Kasahara, 2002; Cochran et al., 2004). After statistically analysing 988 glob-ally distributed high-magnitude seismic events, Tsuruoka et al. (1995) concluded that, of all fault types, normal faults are most susceptible to tidally triggered earthquakes because the periodic ocean loading affects the vertically oriented maxi-mum principal stress. Based on the analysis of earthquake data from 1977–2000, Cochran et al. (2004) later showed that strong ocean tides can also trigger shallow thrust earth-quakes, with the rate of earthquakes differing from the back-ground rate by a factor of 3 with the tidal stress. They con-cluded that the tidal stress changes have more effect on thrust and normal faults than on strike-slip faults because the latter are oriented mostly subvertical and hence less susceptible to the variable ocean loading.
64 T. Li and A. Hampel: Sea-level changes and subduction zones
glaciers situated in the upper plate (e.g. Cohen, 1993; Sauber et al., 2000; Ivins and James, 2004). A combination of glaciological and seismological records, modern space-geodetic measurements and numerical modelling revealed that glacier mass fluctuations over the last 10–100 years in south-central Alaska induced considerable vertical displace-ments and stress changes that have modulated the back-ground seismicity of the subduction zone (Cohen, 1993; Sauber et al., 2000; Sauber and Molina, 2004). For example, in the eastern Chugach Mountains, southern Alaska, a large-scale redistribution of glacier ice between 1993 and 1995 was associated with a significant increase in the number and size of earthquakes (Sauber et al., 2000). This finding was later confirmed by a comprehensive compilation of seismological and glaciological data for southern Alaska, which showed that rapid ice fluctuations promoted small earthquakes on thrust faults (Sauber and Ruppert, 2008).
On the timescale of 10–100 ka, eustatic sea-level changes may affect the stress state of the crust at the borders of ocean basins. During the last glacial-interglacial cycle that culmi-nated in the Last Glacial Maximum (LGM)∼20 ka ago, the
sea-level fall and subsequent rise was∼125 m (Imbrie et al.,
1984; Zachos et al., 2001; Peltier and Fairbanks, 2006). Us-ing a semi-analytical approach with an elastic plate overly-ing a viscoelastic half-space, Luttrell and Sandwell (2010) showed that the post-LGM sea-level rise and the resulting flexural loading caused considerable stress perturbations in coastal regions worldwide. To estimate the effect of these stress perturbations on major plate boundary faults, which were not included in their model, they calculated the resolved shear and normal stresses for selected faults of known orien-tation. The results show that the post-LGM sea-level rise should have caused an increase in the Coulomb stress by up to 1.5 MPa on the vertically oriented San Andreas, Alpine and North Anatolian faults (Luttrell and Smith, 2010). For the Cascadia subduction zone, which they approximated by a 15◦-dipping plane, they calculated a change in the Coulomb stress of∼0.4 MPa, using a friction coefficient of 0.4.
The results of the previous studies summarized above pro-vide strong epro-vidence that faults in the upper part of a sub-duction zone – including the seismogenic part of the plate interface – are susceptible to changes in ice and water loads on different timescales. So far, however, the effect of eustatic sea-level changes on uplift and subsidence of the forearc as well as on the stress along the plate interface remains unre-solved. In this study, we use a two-dimensional numerical model with a subduction-zone geometry to quantify how the forearc and the plate interface respond to the sea-level fall and rise during a glacial-interglacial period. In the follow-ing, we describe the model setup and present the results with a focus on the induced changes in the displacement and stress fields in the upper part of the subduction zone, including the seismogenic part of the plate interface. Finally, we discuss implications for the seismic cycle of subduction thrusts.
2 Model setup
To quantify the effect of sea-level changes on a subduction zone, we use a two-dimensional finite-element model cre-ated with the commercial software ABAQUS (version 6.11). The model consists of a 1500 km-long oceanic plate, which is subdivided into a 8 km-thick crust and a 72 km-thick litho-spheric mantle, and a 1000 km-long continental plate con-sisting of a 15 km-thick upper crust, a 15 km-thick lower crust and a 70 km-thick lithospheric mantle. Our model does not include the sub-lithospheric mantle, i.e. we assume that glacial-interglacial sea-level changes do not induce signifi-cant viscous flow in the sub-lithospheric mantle. The model domain is meshed using triangular plane-strain elements with a maximum edge length of 1 km. The rheological parame-ters of the model are given in Fig. 1. To obtain the geometry of a subduction zone as depicted in Fig. 1a, we perform the following steps: First, the initially horizontal oceanic plate is downflexed to take into account the bending stresses in the subducting plate (cf. Buiter et al., 2001; Hampel and Pfiffner, 2006). This model step is carried out using a viscosity of 1×10²³Pa s for the lithospheric mantle. Afterwards, the
continental plate is added to the model domain with the con-tact between the two plates representing the plate interface. In the same model step, a water body and a pressure (Fig. 1a), which together represent an ocean with a average water depth of 5000 m, are added on top of the oceanic plate and the con-tinental margin. At the trench, the water depth increases to 6580 m. In the third model step, isostatic equilibrium is es-tablished. This model step as well as the following steps is computed as a static analysis, i.e. viscous deformation is not considered. As the displacements and stress changes result-ing from the sea-level variations occur in the uppermost part of the model and are small compared to the thickness of the plates, the two vertical model sides and the bottom are fixed in the vertical and horizontal directions to facilitate the cal-culation of the model.
During the final model step, the falling and subsequently rising sea level during a glacial-interglacial cycle is simu-lated by changing the pressure applied on top of the wa-ter body. Based on the global sea-level curve derived from the oxygen-isotope record (Imbrie et al., 1984; Chappell and Shackleton, 1986; Zachos et al., 2001; Peltier and Fairbanks, 2006), we assume a sea-level fall by 125 m over 100 ka and a subsequent sea-level rise by the same amount over 20 ka (Fig. 1b). During these sea-level changes the plate interface is kept locked, i.e. no relative displacement occurs between the two plates. For comparison, we also calculated a refer-ence model run, in which no sea-level changes occur.
3 Model results
Fig. 1. (a)Setup of the finite-element model with an oceanic and a continental plate that are in contact along a locked plate interface (solid red line). Rheological parameters areρdensity,EYoung’s modulus, andνPoisson’s ratio. Gravity is included as a body force (gacceleration of gravity). An ocean on top of the oceanic plate and the continental margin with an average water depth of 5000 m is implemented as a combination of a water body (average water depth: 4875 m) and a pressure Pocequivalent to 125 m of water (blue arrows). This pressure is decreased and subsequently increased to simulate the falling and subsequently rising sea level during a glacial-interglacial cycle, respectively (see Fig. 1b for the temporal evolution of the pressure). At the beginning of the model run, isostatic equilibrium is established by a lithostatic pressure and elastic foundation at the bottom of the model. Afterwards, the model sides and bottom are fixed in the horizontal and vertical directions (see text for details). Red triangles mark the locations of points F and P0–P4, at which displacements and stresses were extracted from the model (Figs. 2–4, 6). Box with dashed outline marks the part of the model for which the displacement and vertical stress fields are shown in Figs. 2–4. (b)Temporal evolution of the sea level in the model, reflecting a fall and subsequent rise by 125 m over 120 ka (cf. Imbrie et al., 1984; Peltier and Fairbanks, 2006). For comparison, a control run was performed with a constant sea level (dashed line).
stress field from the model. In addition to cross-sections of the model, the evolution of these parameters through time will also be shown at six selected points, with point F being located in the submarine part of the forearc, four points (P1– P4) located on the plate interface and one point positioned 360 km seaward of the trench (P0) (see Fig. 1a). Note that the model time is shown as time before present in all subse-quent figures.
3.1 Vertical displacement
During the sea-level fall between 120 ka and 20 ka, the up-per part of the subduction zone rises by up to 0.7 m (Fig. 2a), with the uplift maximum occurring in the forearc region at point F. The displacement induced by the sea-level fall de-creases both with depth and landward where it diminishes to zero∼20 km landward of the coast. During the subsequent
sea-level rise between 20 ka and 0 ka, the forearc and the oceanic plate subside by up to 0.7 m owing to the increase in the water load (Fig. 2b). The temporal evolution of the
ver-tical displacement at points P0–P4 (Fig. 2c) shows that the points located closest to the ocean floor (P0–P2) experience the strongest uplift and subsidence, whereas points P3 and P4 located at a depth of 15 km and 20 km, respectively, are barely affected by the sea-level changes. In the control run without sea-level changes, no vertical displacement occurs.
3.2 Horizontal displacement
66 T. Li and A. Hampel: Sea-level changes and subduction zones
Fig. 2.Vertical displacement induced by(a)a falling sea level (120– 20 ka) and(b)a rising sea level (20–0 ka). (c)Temporal evolution of the vertical displacements at point F in the forearc and at points P0–P4 located on the plate interface (Figs. 1a, 2a). For reference, the result from the control run (constant sea level) is shown for point P1.
rise. In contrast, the distance between P3 and P4 increases during the sea-level fall and decreases during the sea-level rise.
3.3 Stress changes
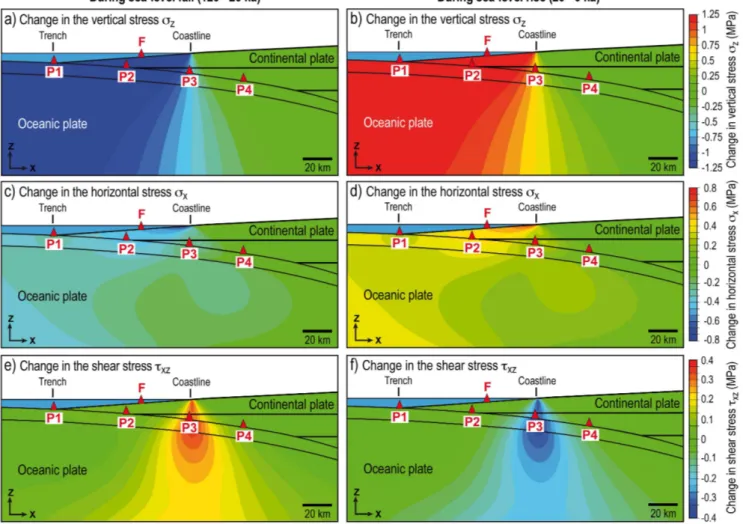
To illustrate the effect of the sea-level variations on the stress field, we extracted the changes in the vertical stressσz, the horizontal stress σx and the shear stress τxz between 120 and 20 ka (sea-level fall) and from 20 to 0 ka (sea-level rise) (Fig. 4). In concert with the changing water load, the vertical stress decreases during sea-level fall and increases during
Fig. 3. Horizontal displacement induced by(a)a falling sea level (120–20 ka) and(b)a rising sea level (20–0 ka).(c)Temporal evo-lution of the horizontal displacements at point F in the forearc and at points P0–P4 located on the plate interface (Figs. 1a, 3a). For ref-erence, the result from the control run (constant sea level) is shown for point P1.
Fig. 4.Stress variations caused by the sea-level changes. Left column shows the change in(a)the vertical stressσz,(b)horizontal stressσx and(c)shear stressτxzduring sea-level fall (120–20 ka). Right column shows the change in(b)the vertical stressσz,(d)horizontal stress
σxand(f)shear stressτxzduring sea-level rise (20–0 ka).
The shear stress changeτxzis highest (0.4 MPa) beneath the coastline and in the vicinity of point P3 (Fig. 4e, f), i.e. in the area that experiences the strongest flexural unbending and subsequent bending in response to the changing water load.
4 Discussion and conclusions
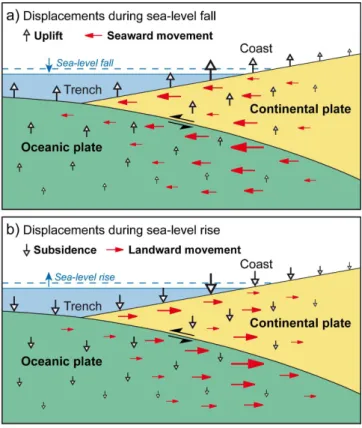
Our model results indicate that sea-level changes during glacial-interglacial cycles affect the displacement and stress field in the forearc, along the plate interface, and in the upper part of the downgoing oceanic plate. During a fall of the sea level, uplift and seaward movements prevail (Fig. 5a); dur-ing sea-level rise, subsidence and landward movements occur (Fig. 5b). The vertical displacements reach the highest val-ues (up to 0.7 m) in the upper 10–15 km of the two plates and decrease rapidly with depth (Fig. 2). Although the horizontal displacements are relatively small (up to 0.12 m), the region
that is affected is larger and located in the forearc beneath the coastline (Fig. 3). In our model, we used a simplified sea-level curve with a linear rise of the sea sea-level over 20 ka, which results in maximum rates of vertical and horizontal dis-placements of 0.035 m ka−1and 0.006 m ka−1, respectively. Taking into account geological evidence indicating that the post-LGM sea-level rise occurred mainly between 15 and 5 ka at a rate of ∼12 m ka−1 (e.g. Peltier and Fairbanks,
2006), this increases the rates of subsidence and landward movement by a factor of two, respectively. For short time intervals in the late Pleistocene, the rate of sea-level rise even reached maximum values of∼30 m ka−1, as shown by
68 T. Li and A. Hampel: Sea-level changes and subduction zones
Fig. 5. Sketch summarizing the vertical and horizontal displace-ments resulting from(a)a falling sea level and(b)a rising sea level (not to scale).
rates of sediment transport and deposition in the oceans have increased considerably (e.g. Church and Slaymaker, 1989; Hebbeln et al., 2007; Covault et al., 2011). The additional loading by sediments would further increase the flexure in-duced by the rising sea level. As shown by studies of the Cascadia and Chilean convergent margins, the postglacial sediment input was probably high enough to affect the style of deformation in the accretionary prisms (Bourgois et al., 2000; Adam et al., 2004).
The displacements caused by unloading and subsequent loading of the oceanic plate and the forearc are associated with changes of the vertical and horizontal stresses (Fig. 4). In the region seaward of the coastline, the vertical stress change is equivalent to the change in the water load and af-fects the entire lithosphere. It diminishes in a narrow tran-sition zone underneath the coast (Fig. 4a, b). The spatial distribution of the vertical stress indicates that the area be-neath the coastline experiences the strongest flexure, which is also reflected in the spatial distribution of the shear stress that is focussed in a bell-shaped area beneath the coast (Fig. 4e, f). Our finding that the region below the coast experiences the strongest variations of vertical and shear stress is con-sistent with the results from semi-analytical flexural mod-elling (Luttrell and Sandwell, 2010), which showed that the flexural stresses induced by eustatic sea-level variations are
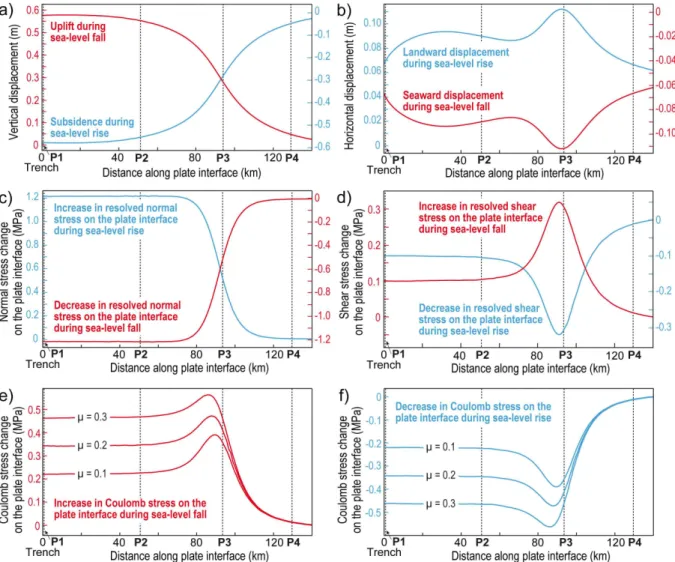
highest near the coast. In contrast to the study by Luttrell and Sandwell (2010), who approximated the Cascadia sub-duction thrust by a plane of constant dip, our model setup al-lows us to analyse the spatial variations in displacement and stress along the convex contact between the bended oceanic plate and the continental plate. The results of this analysis are shown in Fig. 6 for a profile along the plate interface between the trench, i.e. point P1, and point P4 located at a depth of∼20 km. With respect to the vertical displacement,
the profile shows that the sea-level changes cause uplift or subsidence of 0.58 m in the shallow part of the plate inter-face (Fig. 6a). The vertical displacement decreases to almost zero at point P4. In contrast, the horizontal displacement reaches the highest values ∼30 km landward of the trench
and near point P3 (Fig. 6b). During the sea-level fall, the re-solved normal stress on the plate interface decreases by up to 1.2 MPa beneath the submarine part of the forearc, i.e. in the shallow part of the plate interface, whereas it increases during the sea-level rise (Fig. 6c). Similar to the vertical displacement, the changes in normal stress diminish toward point P4. The change in the resolved shear stress on the plate interface has a peak beneath the coastline, where it reaches a value of 0.32 MPa at a depth of∼15 km (Fig. 6d). Beneath
most of the submarine forearc, the change in shear stress is
∼0.1 MPa.
Fig. 6. Profiles along the plate interface showing displacement and stress changes induced by sea-level fall (red curves and scales) and sea-level rise (blue curves and scales). (a)Vertical displacement,(b)horizontal displacement,(c)resolved normal stress on plate interface and(d)resolved shear stress on plate interface. Changes in the Coulomb stress(e)during sea-level fall and(f)during sea-level rise were calculated using different values (0.1, 0.2 and 0.3) for the friction coefficient µ. For location of points P1–P4 see Fig. 1a.
The promotion of earthquakes during sea-level fall and their delay during sea-level rise indicated by our model re-sults may be recorded by sedimentary deposits in the forearc of subduction zones. For instance, at the southern Chilean active margin, turbidites were more frequent during glacial periods than during the Holocene and marine isotope stage (MIS) 5 (Blumberg et al., 2008). Under the assumption that the turbidites were mainly triggered by earthquakes, the authors infer that the recurrence interval of large subduc-tion earthquakes was 100–200 years during glacial periods. In contrast, the turbidite recurrence time was substantially higher during MIS 5 and the Holocene. Although the in-crease in turbidite recurrence time appears to be mainly con-trolled by a decrease in sediment availability (Blumberg et al., 2008), the reduction in Coulomb stress changes induced
by postglacial sea-level rise may also have contributed to the increase in turbidite recurrence time by delaying earthquakes on the plate interface.
70 T. Li and A. Hampel: Sea-level changes and subduction zones
Acknowledgements. We thank Ralf Hetzel for critical comments on an earlier version of the manuscript and Holger Steffen for helpful discussion. We thank Iain Stewart and an anonymous referee for their positive reviews. Funding was provided by the German Research Foundation (DFG) within the framework of an Emmy-Noether fellowship granted to A. Hampel (grant HA 3473/2-1).
Special Issue: “Subduction zones”
Edited by: S. Buiter, F. Funiciello, and J. van Hunen
References
Adam, J., Kl¨aschen, D., Kukowski, N., and Fl¨uh, E.: Upward delamination of Cascadia Basin sediment infill with landward frontal accretion thrusting caused by rapid glacial age material flux, Tectonics, 23, TC3009, doi:10.1029/2002TC001475, 2004. Bard, E., Hamelin, B., Fairbanks, R. G., and Zindler, A.: U-Th ages from mass spectrometry in corals from Barbados: sea level during the past 130 000 years, Nature, 346, 456–458, 1990. Blumberg, S., Lamy, F., Arz, H. W., Echtler, H. P., Wiedicke, M.,
Haug, G. H., and Oncken, O.: Turbiditic trench deposits at the South-Chilean active margin: A Pleistocene–Holocene record of climate and tectonics, Earth Planet. Sci. Lett., 268, 526–539, doi:10.1016/j.epsl.2008.02.007, 2008.
Bourgois, J., Guivel, C., Lagabrielle, Y., Calmus, T., Boulegue, J., and Daux, V.: Glacial-interglacial trench supply variation, spreading-ridge subduction, and feedback controls on the An-dean margin development at the Chile triple junction area (45– 48◦S), J. Geophys. Res., 105, 8355–8386, 2000.
Buiter, S. J. H., Govers, R., and Wortel, M. J. R.: A modelling study of vertical surface displacements at convergent plate mar-gins, Geophys. J. Int. 147, 415–427, 2001.
Chappell, J. and Shackleton, N. J.: Oxygen isotopes and sea level, Nature 324, 137–140, 1986.
Church, M. and Slaymaker, O.: Disequilibrium of Holocene sedi-ment yield in glaciated British Columbia, Nature, 337, 452–454, 1989.
Cochran, E. S., Vidale, J. E., and Tanaka, S.: Earth tides can trigger shallow thrust fault earthquakes, Science, 306, 1164–1166, 2004. Cohen, S. C.: Does rapid change in ice loading modulate strain ac-cumulation and release in glaciated, tectonically active regions? Geophys. Res. Lett., 20, 2123–2126, 1993.
Covault, J. A., Romans, B. W., Graham, S. A., Fildani, A., and Hil-ley, G. E.: Terrestrial source to deep-sea sink sediment budgets at high and low sea levels: Insights from tectonically active South-ern California, Geology, 39, 619–622, doi:10.1130/G31801.1, 2011.
Hampel, A. and Pfiffner, A.: Relative importance of trenchward upper plate motion and friction along the plate interface for the topographic evolution of mountain belts, in: Analogue and Nu-merical Modelling of Crustal-Scale Processes, edited by: Buiter, S. J. H. and Schreurs, G., Geol. Soc. London Spec. Publ., 253, 105–115, 2006.
Hanks, T. C.: Earthquake stress drops, ambient tectonic stresses and stresses that drive plate motions, Pure Appl. Geophys., 115, 441–458, 1977.
Hebbeln, D., Lamy, F., Mohtadi, M., and Echtler, H.: Tracing the impact of glacial-interglacial climate variability on erosion of the southern Andes, Geology, 35, 2, 131–134, 2007.
Hyndman, R. D. and Wang, K.: The rupture zone of Cascadia great earthquakes from current deformation and the thermal regime, J. Geophys. Res., 100, B11, 22133–22154, 1995.
Imbrie, J., Hays, J. D., Martinson, D. G., Mcintyre, A., Mix, A. C., Morley, J. J., Pisias, N. G., Prell, W. L., and Shackleton, N. J.: The orbital theory of Pleistocene climate: Support from a revised chronology of the marine record, in: Milankovitch and Climate, Part 1, edited by: Berger, A. L., Imbrie, J., Hays, J., Kukla, G., and Saltzman, B., Reidel, Boston, 269-305, 1984.
Ivins, E. R. and James, T. S.: Bedrock response to Llan-quihue Holocene and present-day glaciation in southern-most South America, Geophys. Res. Lett., 31, L-24613, doi:10.1029/2004GL021500, 2004.
Kanamori, H. and Anderson, D. L.: Theoretical basis of some empirical relations in seismology, Bull. Seismol. Soc. Am., 65, 1073–1095, 1975.
Kasahara, J.: Tides, earthquakes and volcanoes, Science, 297, 348– 349, 2004.
Luttrell, K. and Sandwell, D.: Ocean loading effects on stress at near shore plate boundary fault systems, J. Geophys. Res., 115, B08411, doi:10.1029/2009JB006541, 2010.
Nasu, N., Kishinouye, F., and Kodaira, T.: Recent seismic activities in the Idu Peninsula (Part I), Bull. Earthquake Res. Inst., Tokyo Imperial Univ., 9, 22–35, 1931.
Peltier, W. R. and Fairbanks, R. G.: Global glacial ice volume and Last Glacial Maximum duration from an extended Barbados sea level record, Quat. Sci. Rev., 25, 3322–3337, 2006.
Sauber, J. and Molnia, B. F.: Glacier ice mass fluctuations and fault instability in tectonically active Southern Alaska, Global Planet. Change., 42, 279–293, 2004.
Sauber, J. and Ruppert, N. A.: Rapid Ice Mass Loss: Does it have an influence on Earthquake Occurrence in Southern Alaska?, in: Active Tectonics and Seismic Potential of Alaska, edited by: Freym¨uller, J. T., Haeussler, P. J., Wesson, R. L., and Ekstr¨om, G., Geophys. Monograph Series, 179, 369-384, 2008.
Sauber, J., Plafker, G., Molnia, B. F., and Bryant, M. A.: Crustal deformation associated with glacial fluctuations in the eastern Chugach Mountains, Alaska, J. Geophys. Res., 105, 8055–8077, 2000.
Scholz, C. H.: The mechanics of earthquakes and faulting, Cam-bridge University Press, second edition, New York, 496 p., 2002. Shlien, S.: Earthquake-tide correlation, Geophys. J. R. Astr. Soc.,
28, 27–34, 1972.
Stern, R. J.: Subduction zones, Rev. Geophysics, 40, 1012, doi:10.1029/2001RG000108, 2002.
Tsuruoka, H., Ohtake, M., and Sato, H.: Statistical test of the tidal triggering of earthquakes: contribution of the ocean tide loading effect, Geophys. J. Int., 122, 183–194, 1995.