Quantifying Transmission Investment in
Malaria Parasites
Megan A. Greischar1,2*, Nicole Mideo2, Andrew F. Read1,3,4, Ottar N. Bjørnstad1,3,4
1Department of Entomology and the Center For Infectious Disease Dynamics, The Pennsylvania State University, University Park, Pennsylvania, United States of America,2Department of Ecology & Evolutionary Biology, University of Toronto, Toronto, Ontario, Canada,3Department of Biology, The Pennsylvania State University, University Park, Pennsylvania, United States of America,4Fogarty International Center, National Institutes of Health, Bethesda, Maryland, United States of America
Abstract
Many microparasites infect new hosts with specialized life stages, requiring a subset of the parasite population to forgo proliferation and develop into transmission forms. Transmis-sion stage production influences infectivity, host exploitation, and the impact of medical interventions like drug treatment. Predicting how parasites will respond to public health efforts on both epidemiological and evolutionary timescales requires understanding trans-mission strategies. These strategies can rarely be observed directly and must typically be inferred from infection dynamics. Using malaria as a case study, we test previously
described methods for inferring transmission stage investment against simulated data gen-erated with a model of within-host infection dynamics, where the true transmission invest-ment is known. We show that existing methods are inadequate and potentially very misleading. The key difficulty lies in separating transmission stages produced by different generations of parasites. We develop a new approach that performs much better on simu-lated data. Applying this approach to real data from mice infected with a singlePlasmodium chabaudistrain, we estimate that transmission investment varies from zero to 20%, with evidence for variable investment over time in some hosts, but not others. These patterns suggest that, even in experimental infections where host genetics and other environmental factors are controlled, parasites may exhibit remarkably different patterns of transmission investment.
Author Summary
Malaria parasites are carried from host to host by blood-feeding insects, a process that requires some portion of the parasite population to develop into transmission forms that cannot replicate within the current host. The fraction of parasites specialized for transmis-sion instead of replication (transmistransmis-sion investment) could change with each cycle of rep-lication in response to changing conditions within the host. Measuring how transmission investment changes through time could help us understand how malaria spreads so effi-ciently through populations of human and other animals. However, transmission
OPEN ACCESS
Citation:Greischar MA, Mideo N, Read AF, Bjørnstad ON (2016) Quantifying Transmission Investment in Malaria Parasites. PLoS Comput Biol 12(2): e1004718. doi:10.1371/journal.pcbi.1004718
Editor:Rustom Antia, Emory University, UNITED STATES
Received:July 9, 2015
Accepted:December 17, 2015
Published:February 18, 2016
Copyright:© 2016 Greischar et al. This is an open access article distributed under the terms of the Creative Commons Attribution License, which permits unrestricted use, distribution, and reproduction in any medium, provided the original author and source are credited.
Data Availability Statement:Equations are provided in the supplement to recreate the data simulated, as is the code for performing the analysis described.
investment is usually impossible to measure directly and instead has to be estimated by comparing the number of transmission forms with total parasite numbers in blood
sam-ples. Here we use a model to simulate data from an infection—so that the true level of
transmission investment is known—and test published methods for estimation. We find
that existing methods do not accurately estimate transmission investment from simulated data, and we propose a new statistical method that works substantially better. When applied to rodent malaria data, our method suggests that transmission investment can vary substantially over the course of infection, with notably different patterns of allocation across hosts.
Introduction
Parasite life cycles involve both proliferation within-hosts and transmission to new hosts.
Many microparasites have evolved specialized transmission forms—including protozoa, fungi
and viruses—giving rise to a tradeoff between proliferation within the host and onward
trans-mission [1]. Since transtrans-mission stage production comes at the cost of within-host replication, it represents a fundamental aspect of parasite fitness and a potential target for disease interven-tion efforts, provided the proximate cues and evoluinterven-tionary drivers of allocainterven-tion patterns can be identified (reviewed in [2]). Information is needed on the range of strategies parasites can employ, what cues in the within-host environment (if any) trigger changes in allocation, and how quickly the parasite population can respond to perturbations, such as drug treatment of the host. None of this is attainable without robust methods to estimate transmission
invest-ment from time series data. Here we use simulated data—where the true pattern of
transmis-sion investment is known—to show that current methods for estimating allocation [3–5] can
be seriously misleading, inferring complicated strategies where none exist. We therefore develop a better inferential method by expanding recent regression methods [6] and apply this method to real data, revealing unexpected diversity in the transmission investment strategies of malaria parasites in a highly-controlled setting of rodent malaria infections.
Malaria parasites (Plasmodiumspecies) replicate within red blood cells of their vertebrate
host, developing into mature stages called schizonts that burst to release merozoites capable of
invading other red blood cells [7].In vitroassays of the human malaria parasiteP. falciparum
suggest that all of the merozoites emerging from a given schizont will be committed either to
the transmission route—invading a red blood cell and developing into a sexual gametocyte that
can be passed onto the vector in a blood meal—or to further in-host proliferation by invading a
red blood cell, maturing into another schizont and subsequently bursting to release more mer-ozoites [8]. Gametocytes are specialized for sexual reproduction in the midgut of the vector and cannot infect red blood cells [9], so that investment in transmission should be costly to
within-host replication [10,11]. Mature gametocytes can be readily distinguished from asexual
forms by molecular methods (e.g., [12,13]) or microscopy (e.g., [8]).
Transmission investment is defined as the fraction of a given cohort of parasites that
com-mit to differentiation into gametocytes [14], a proportion known as the“conversion rate”by
convention [8]. Conversion rates can be measured directlyin vitroby fixing cells in a
mono-layer and observing their development [8] or by using molecular markers to detect gametocyte production from a single cohort of parasites [15]. Critically, these methods are only able to assess transmission investment for a single cohort of parasites and only in the highly-controlled
environment ofin vitroculture. Characterizing changes in allocation over the course of
infec-tion requires time series data, but gametocyte dynamics are driven by parasite proliferainfec-tion
funders had no role in the analysis, decision to publish or the manuscript preparation.
and gametocyte longevity in addition to transmission investment. We use a heuristic model to illustrate that gametocyte numbers may increase or decrease while transmission investment holds steady (Fig 1). Even if transmission investment is consistently 50%, gametocytes may only rarely compose 50% of the parasite population (Fig 1A and 1B). Thus, while it is tempting to draw inferences from relative numbers of gametocytes and asexual stages from a single point in time (e.g., [16]), the presence of gametocytes only confirms that some transmission invest-ment occurred previously and cannot be used to gauge the level of transmission investinvest-ment or how allocation has changed over time.
Accurately estimating transmission investment requires linking gametocytes with their pro-genitor cohort. Many, but not all, malaria species exhibit discrete cohorts of schizonts, which develop synchronously and burst in unison to generate another cohort of infected red blood
cells (reviewed in [17,18]). Synchrony is helpful for quantifying transmission investment
because asexual parasites can be separated into identifiable cohorts, but it is not possible to dis-tinguish newly-matured gametocytes from those produced by previous cohorts (in contrast to
the color-coding used for clarity inFig 1). In addition to being well-synchronized [19], the
problem of gametocyte carryover is likely to be minimized in the rodent malariaP. chabaudi,
where the reported gametocyte half-life is 14 hours [20]. However,P. falciparumproduces
gametocytes that can circulate for more than six days (reviewed in [9]), much longer than the two days required for the asexual life cycle, meaning that gametocytes from several asexual cohorts are likely to be present simultaneously even in a highly synchronized infection. We
focus on the comparatively simple case ofP. chabaudito show that even modest gametocyte
carryover can severely bias estimates of transmission investment.
Current methods for estimating transmission investment
PCR methods have been developed to quantify abundance of both asexual parasites and mature
gametocytes inP. chabaudiinfections [13,21], and a variety of techniques have been developed
to quantify transmission investment from these time series data. A recent study used linear mixed effects models to examine how transmission investment varied with red blood cell avail-ability [22]. Other studies attempt to estimate transmission investment explicitly, because direct estimates are conceptually appealing and easily incorporated into modeling efforts (e.g.,
[18]). Such direct estimates infer transmission investmentcfrom time series of gametocyte
abundance and total parasite numbers, making use of the fact that infected red blood cells take two days to develop into mature gametocytes [23]. The simplest method that accounts for the time lag between transmission investment and gametocyte maturity would be
ct¼
Gtþ2
At
; ð1Þ
whereAtis the total number of red blood cells invaded, by either sexually- or
asexually-com-mitted merozoites at timet, andctis the fraction of invaded cells that develop into mature
gametocytes two days later (Gt+2). This simple estimate requires negligible mortality during the
two day window of development. This method is similar to ones commonly used forP.
falcipa-rum in vitro(e.g., [4]), where early stage gametocytes can be identified and ignoring mortality is likely to be a fair approximation.
In vivo, neglecting mortality is thought to be too unrealistic an assumption, so methods
attempting to correct for mortality have been proposed. Bucklinget al. [3] derived a commonly
used method (e.g., [5,24,25]), assuming that the number of gametocytes at timet+ 2 can be
calculated as
wheremis the burst size (i.e., the number of merozoites emerging from a burst red blood cell)
andsis the proportion of parasites surviving development. Since the asexual cycle takes one
day [26], two cycles of asexual growth occur during gametocyte maturation, so that the number of asexual stages at timet+ 2 is
Atþ2 ¼s 2
ð1 c tÞ
2
m2
At: ð3Þ
Bucklinget al. [3] solve for transmission investment by combining Eqs2and3:
ct¼
Gtþ2 At
ffiffiffiffiffiffiffi Atþ2 At
q
þGtþ2 At
ð4Þ
A subsequent review suggested that the appropriate time lag would be three days, or three cycles of asexual growth, since transmission investment occurs in the cycle prior to gametocyte
development [2]. Thus the parasites that are committed at timetwill burst out and invade new
red blood cells before taking two days to develop into gametocytes, so that transmission
invest-ment should be defined as
ct¼ Gtþ3
At
ffiffiffiffiffiffiffi Atþ3 At
3
q
þGtþ3 At
: ð5Þ
These methods for inferring transmission investment are expected to be sensitive to the assumption that both gametocytes and asexual stages are equally likely to survive development
(i.e., the samesis used in both Eqs2and3). This assumption would be violated by differential
immune clearance [2,3], which is a concern since immunity predominately targets asexual
par-asites (reviewed in [27]). The same issues would apply to an even greater degree inP.
falcipa-rum, where gametocytes take much longer to mature [28].
If differential mortality of gametocytes and asexual stages is a problem, it could be addressed
by detecting gametocyte development earlier. While not yet detectable inP. chabaudi, early
sig-nals of gametocyte development can be detected in the human malariaP. falciparum[12,16].
We simulate data assuming early detection of gametocyte development and find that it does not improve estimates of transmission investment except under highly-restrictive conditions
(S1 Text,S1andS2Figs). Whether time series include mature or immature gametocytes,
cur-rently-described methods fail to account for the carryover of gametocytes produced by previ-ous asexual cohorts. While this bias can be addressed by fitting a detailed mechanistic model to time series data (e.g., from neurosyphilis patients, [29]), we develop an alternative approach requiring fewer strict assumptions about the biology.
newly invaded red blood cells (circles) will develop into gametocytes (gray shading) while in the other half (unshaded), parasites will replicate and each generate four newly invaded red blood cells the following day. (B) In contrast, if the parasite population is declining so that only half the parasites can replace themselves (for example, because red blood cells have been depleted), gametocyte numbers can decrease while the transmission investment remains constant at 50%. (C) Alternately, the gametocytes observed on a given day (e.g.,t,t+ 1) may have been produced by previous cohorts with no ongoing transmission investment (and hence no developing gametocytes) during the time period observed. In this case, gametocyte numbers are declining due to mortality rather than any change in transmission investment during the observation window. We use circles to indicate both replicating parasites and developing gametocytes since those forms are often indistinguishable inP. chabaudi; likewise, crescents indicate both newly-matured and‘old’gametocytes generated by previous cohorts since those cannot be differentiated in eitherP. chabaudiorP. falciparum.
Results & Discussion
Failure of existing methods
We simulated dynamics inP. chabaudi-like infections of mice using a previously described
model [18] that gives current methods the best possible chance of working by incorporating the key assumptions thought to yield reliable estimates of transmission investment. Specifically, we assumed a highly synchronized infection and, at least in initial simulations, no immune clearance. The model does, however, include homeostatic regulation of red blood cell abun-dance, as well as the capability to incorporate immune clearance of infected red blood cells. For the simulations, we assume that the duration of parasite development (both sexual and asexual) is fixed with no variation, so that a high degree of synchrony is maintained [18]. From high-resolution simulated data, we sampled daily counts of total parasite numbers and gametocyte abundance, assuming no sampling error.
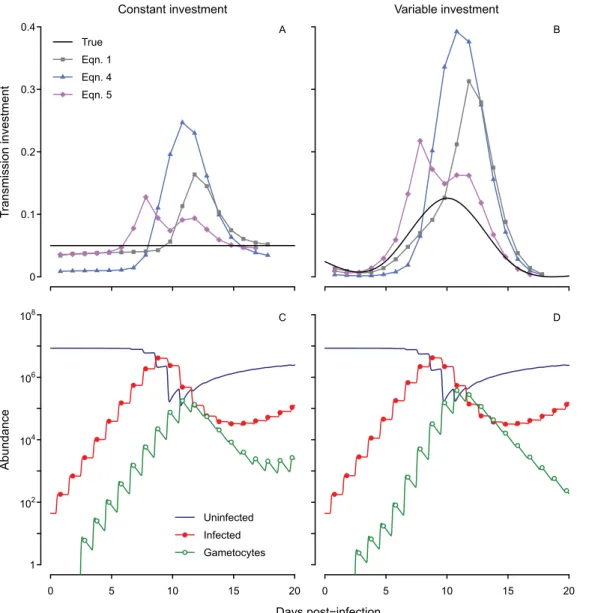
All three inference methods (Eqs1,4and5) return qualitatively incorrect patterns (Fig 2A
and 2B) and cannot distinguish between constant and variable patterns of allocation. Even when the true level of transmission investment is fixed at 5% (in the range reported previously forP. chabaudi, [5]), the estimated value rises as parasite numbers increase, making it appear as though parasites are modulating their investment in response to changing environmental condi-tions. The spurious changes in estimated transmission investment are amplified when we simu-late a variable pattern of investment (Fig 2B and 2D). Whether this investment pattern is plausible (and hence a good choice to test prescribed methods) cannot be evaluated, at least with these methods. The estimated values deviate so much from the true pattern that it is unclear which aspects (if any) of current expectations regarding transmission investment can be relied upon. The limitation typically thought to introduce error—differential mortality of
asex-ual and sexasex-ual forms (e.g., [3])—does not apply here. In the simulated dynamics, developing
sexual stages and asexual stages are subject to the same low background mortality rate, and mature gametocytes persist approximately 20 hours on average (equivalent to a the 14 hour half-life reported by [20]), similar to the 24 hour period required for infected red blood cells to burst. Instead our analysis suggests that the blurring together of synchronized cohorts creates bias. Simulated gametocytes peak each day (Fig 2C and 2D), but abundance does not drop to zero between peaks because gametocyte lifespans are exponentially-distributed. Thus, a mean lifespan of 20 hours equates to 30% of gametocytes persisting from one time point to the next. A major part of the problem lies in incorrectly attributing the observed gametocyte population to a single cohort, a complication emerging from the parasite life cycle (Fig 1). The magnitude of the error depends on the number of gametocytes produced previously; that is, the errors in gametocyte abundance are autocorrelated, a familiar problem in parasitology (reviewed in [30]).
These complexities call into question previous work quantifying transmission investment in
malaria parasites, bothin vivoandin vitro. A recent study found that transmission investment
inP. chabaudiincreased with declining red blood cell numbers, assuming independent residu-als [22]. That approach is likely to generate spurious patterns because it does not address the problem of autocorrelated errors in gametocyte counts. Using our simulated data, we can gen-erate the appearance of a negative correlation between red blood cell numbers and
transmis-sion investment (Fig 2)—even when transmission investment is constant—by failing to
The problem of temporal autocorrelation is likely to be more pronounced inP. falciparum, given the long lifespan of gametocytes (reviewed in [9]). Assessing transmission investment by a single parasite cohort (e.g., by fixing parasites in a monolayer, [8]) circumvents this problem, but other approaches may be needed when more than one parasite cohort is considered. While
culturedP. falciparumparasites appear to alter transmission investment when they are at risk
of drug clearance (using an equation analogous toEq 1, [4]), methods that account for
tempo-ral autocorrelation may reveal a different pattern.
Blurring of gametocyte cohorts may likewise complicate sex ratio estimates, particularly since male gametocytes persist twice as long as females [20]. Our simulations assumed a uni-form mortality rate for all gametocytes, set to yield the mean lifespan of male and female game-tocytes reported in [20], and found that sufficient gamegame-tocytes persisted long enough to bias
Fig 2. Current methods for inference yield spurious oscillations whether the true transmission investment is constant or variable.Estimates of transmission investment by different methods are shown when the actual level is fixed at 5% (solid black line, A) or variable (B). The corresponding dynamics of uninfected and infected red blood cells (dark blue line and red closed circles, respectively) and mature gametocytes (green open circles) are shown below (C, D). Infected red blood cell abundance includes asexual parasites and developing sexual forms, but not mature gametocytes. We assume a mean gametocyte lifespan of about 20 hours, equivalent to the experimentally-derived half-life of 14 hours forP. chabaudigametocytes [20].
the inferred transmission investment. Under more realistic assumptions, male gametocytes would be more likely (and female gametocytes less likely) to persist through multiple time points. Researchers have observed sex ratios less female-biased than expected from theory, and while adaptive explanations have been proposed (e.g., [31]), our results hint that part of the
dis-crepancy may be explained by the longer lifespan of male gametocytes [20,32].
A new method
Since current methods are inaccurate, we develop an alternative approach by elaborating the
recently proposed time series model of in-host malaria dynamics forP. chabaudi[6]. Asexual
growth can be modeled via the effective propagation number,Pe,tfor each cycle of asexual
pro-liferation:
Itþ1¼Pe;tItSt ð6Þ
whereItindicates the total number of infected red blood cells excluding any mature
gameto-cytes, andStis the number of uninfected red blood cells. ThusItrepresents mainly asexual
par-asites, and while counts probably include a small number of immature sexual stages, we assume these to be negligible as before [6].
Using linear regression as described by [6], the time-varying growthPe,tcan be estimated
for each cycle of proliferation within a host. We calculate effective propagation for each
indi-vidual mouse (unlike in [6], which calculates an average across mice) by solvingEq 6for Pe,t.
Effective propagation numbers describe invasion success per infected red blood cell, which encompasses the number of progeny parasites released as well as their chances of contacting and invading susceptible red blood cells ([6], visual explanation in [33]). By incorporating red blood cell dynamics, effective propagation numbers yield better estimates of parasite
prolifera-tion than multiplicaprolifera-tion rates. Expanding onEq 6, the gametocyte dynamics would be
Gtþ3¼ctPe;tItSt ð7Þ
assuming that no gametocytes persisted from previous cycles and wherectis again the
trans-mission investment. Here the time lag is three proliferative cycles (each lasting one day)
because the effective propagation numberPe,tdescribes the invasion success of parasites
sam-pled at timet. Those parasites will give rise to another generation of infected red blood cells at
timet+ 1, of which some fractionctwill have begun the process of sexual differentiation that
will be complete by timet+ 3. Since gametocytes are likely to carry over, we can add those
terms:
Gtþ3¼ctPe;tItStþGtþ2 ð8Þ
withindicating the fraction of previously produced, mature gametocytes persisting to the
cur-rent time point. While the number of mature gametocytes that persist is likely to vary through time, we assume that the distribution of gametocyte lifespans will remain constant. In particu-lar, we assume that, upon attaining maturity, gametocyte lifespans follow an exponential
distri-bution, as has been done in previous work to estimate gametocyte half-lives inP. chabaudi[20].
The fraction of mature gametocytes persisting to a subsequent time point can be estimated as a
single constant,, which serves the dual purpose of describing gametocyte longevity (can be
easily converted to a mean lifespan or half-life) and correcting conversion rates for gametocytes
outside the cohort of interest. This method can be readily extended toP. falciparumand other
species by modifying the time lags required for proliferation (Eq 6) and gametocyte develop-ment (Eq 8). No prior knowledge of gametocyte longevity is required, but if gametocyte
gametocytocidal drugs—then a single constant may not be sufficient to describe gametocyte
survival and multiplevalues may be needed to describe different parts of the time series.
By analogy to susceptible reconstruction in epidemiology (e.g., [34]) we may recastEq 8as a
cumulative recursion in terms of infected and susceptible cells:
Gt¼
Xt
j¼t0þ3 t jc
j 3Pe;j 3Ij 3Sj 3 !
þt t0 2G
t0þ2;t01 ð9Þ
wheret0is thefirst time point when effective propagation can be calculated, provided that
gametocytes were censused att0+ 2. In the simulated data, effective propagation can be
calcu-lated from thefirst day (thus,t0= 1) and:
Gt¼
Xt
j¼4 t jc
j 3Pe;j 3Ij 3Sj 3 !
þt 3
G3 ð10Þ
Mature gametocytes arefirst observed in the simulated data at the third time point, soG3could
be used as a starting point for subsequent time steps. However, in real data there is likely to be some error in the gametocyte countsG3(or more generally,Gt0+2) that would bias thefits to
subsequent time points, so wefit those initial gametocyte counts as an additional parameter in
the model.
Rather than fitting eachctindependently (which would be possible but extremely
parame-ter-wasteful), we calculate the time-varying transmission investment as a smooth curve. Specif-ically, we use a sequence of splines of increasing complexity to describe the pattern of
transmission investment and employ F-tests to determine when more complicated splines are justified by the data. To constrain transmission investment to biologically plausible propor-tions (i.e., between zero and one), we work with the complimentary log-log of the spline and consider five shapes: (1) constant; (2) linear; (3) parabolic; (4) cubic; (5) or a cubic spline with one interior knot. For time-varying transmission investment, any polynomial up to a particular order can be described by a linear combination of the spline basis functions of the same order (e.g., [35]), and the parameters specifying the linear combination can be found by optimizing the fit to observed gametocyte abundance. Splines of greater complexity should always be expected to fit better, and since the models are nested we can compare them by calculated the F-statistic, which follows an F distribution [36]:
F¼ðsseq ssepÞ=ðp qÞ ssep=ðn pÞ
Fp q;n p ð11Þ
wherenis the number of observations used in thefitting,pandqare the number of parameters
used in the more complicated and simpler models (respectively), andsseis corresponding the
sum squared error of the bestfit parameters for the two models. The F-test requires more
observations of gametocyte abundance than parameters in the more complicated model (n>
p). For example, a parabolic transmission investment strategy is specified byfive parameters
including the fraction of gametocytes persisting to the following day () and the initial
gameto-cyte abundance (Gt0+2), so determining whether that pattern offers a significantly betterfit to the data requires at least six days of gametocyte counts along with the corresponding red blood
cell and parasite counts from three days prior. TheRcode for the calculations can be found in
the Supporting Information (S2 Text,S1 Code).
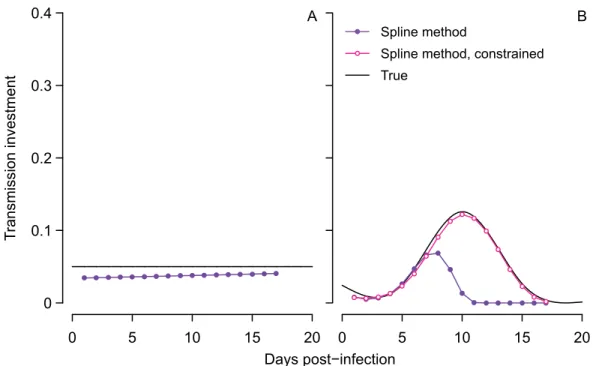
relatively little bias (Fig 3A). Our new method modestly underestimates the true transmission investment because some gametocytes die by the time the infection is sampled. When we cor-rect the gametocyte abundances for this mortality (i.e., by dividing by the proportion expected to survive from maturation at midnight to sampling), the estimated transmission investment is very close to the true value (S3 Fig). The estimated transmission investment tends to increase towards the end of infection because sampling occurs slightly earlier in the life cycle as the
infection wears on (Fig 2,S2 Fig) due to the assumptions that asexual replication requires 24
hours from invasion to bursting and that subsequent merozoite invasion is rapid but not instantaneous. Thus invasion occurs slightly later in each successive cycle, resulting in fewer gametocytes lost by the time the population is sampled. Since this greater number of gameto-cytes cannot be accounted for in the effective propagation number, the spline method increases the estimated transmission investment to achieve a good fit to observed gametocyte abundance. This error is small and likely to be be negligible in reality, assuming that dynamics remain syn-chronized over the sampling period.
We apply the fitting algorithm to data simulated with time-varying transmission investment and find that the estimated curve reflects key features of the true curve (Fig 3B), but
overesti-mates the gametocyte carryover () and hence the impact of early transmission investment
decisions on subsequent gametocyte dynamics. Carryover was initially allowed to vary between zero and 100%, and when we refit the model constraining gametocyte carryover to be less than
35%, the spline matches the true pattern very closely (Fig 3B). Previous experiments withP.
chabaudihave assumed that gametocyte lifespans are exponentially-distributed to arrive at a mean half-life of 14 hours, corresponding to 30% gametocyte carryover [20]. We therefore assumed 30% carryover to simulate time series, and so constraining the algorithm to choose carryover less than 35% improved the model fit. In reality, there is substantial variability
Fig 3. The spline method performs better than previous methods in capturing the true pattern of transmission investment.The true pattern is shown in black for constant (A) and variable (B) investment, while the spline estimate is indicated with closed purple circles for comparison to previous methods in Fig 2A and 2B. The gametocyte carryover () corresponding to those estimated splines was 28% in (A), and 42% in (B), where the true value was 30%. In (B), constraining the gametocyte carryover to be less than 35% improved the spline fit (open pink circles), an improvement that is not possible for previous methods which do not account for carryover.
around the mean gametocyte half-life, especially when male and female gametocytes are con-sidered separately [20], and extrapolating from those confidence intervals suggests that carry-over could range from four to 67%. Further characterization of the distribution of gametocyte
lifespans—including testing whether exponential distributions are a good approximation—
would greatly enhance our ability to infer transmission investment.
As with previous efforts to estimate transmission investment, we make specific assumptions about when sexual differentiation can first be detected. There is still uncertainty about when PCR methods can first detect gametocyte development (reviewed in [2]), and once that issue is resolved, it may be necessary to use different time lags than those specified in Eqs7–9(τ
parameter inS2 Text,S1 Code). Our alternative approach is also subject to the same limitations
that have always applied to estimated transmission investment: the inferred pattern will be biased whenever there is differential mortality of sexual and asexual stages. However, the
effec-tive propagation number,Peis reduced when immunity is constraining asexual proliferation
[6]. Accordingly, making use of simulated data from a model that incorporates a host immune response, we find that our approach is able to cope with immune-mediated clearance of asexual parasites (S4 Fig).
In a first application of our approach, we analyze a published data set from mice infected
with aP. chabaudi[37,38], fitting the model to time series for individual mice. Our new
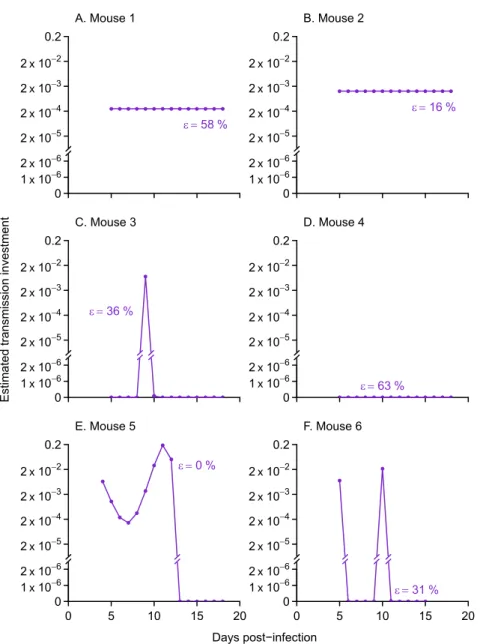
method reveals highly variable patterns of transmission investment across mice (Fig 4). Three mice showed variable transmission investment over the time period sampled, while dynamics in the other three mice were adequately explained with a constant level of investment (observed
and predicted gametocyte counts shown inS5 Fig). Of the mice with constant transmission
investment, some but not all were predicted to have relatively high (though still plausible) levels
of gametocyte carryover (58% and 63% inFig 4A, and 4Dversus 16% in B). Therefore the cases
of constant transmission investment cannot be attributed solely to the model overestimating gametocyte carryover. Mouse 4 (Fig 4D) exhibited no evidence for any transmission invest-ment over the period sampled. Specifically, for mouse 4, the model indicates that the most
par-simonious explanation for the dynamics from day seven onwards—the time period for which
transmission investment can be estimated—is that the observed gametocyte population was
produced by parasite cohorts prior to day five and that some of those gametocytes persisted to subsequent days. No ongoing transmission investment is needed to explain the dwindling
numbers of gametocytes observed (Fig 4D), analogous to the example presented inFig 1C. The
increase in gametocyte numbers from day six to day seven results from a combination of left-over gametocytes produced early in infection and newly-matured gametocytes produced by the day four cohort of parasites, but asexual counts are too low to yield reliable estimates of effec-tive propagation. A key point is that the initial rate of increase in gametocytes in mouse 4 can-not be partitioned into transmission investment and carryover from previous cohorts because reliable estimates are lacking for the rate of proliferation in the progenitor cohort. The infection dynamics in this fourth mouse stand in contrast to the other mice in this treatment group (S6 Fig), including a notably greater level of anemia consistent with the inference that these para-sites were allocating relatively more to proliferation rather than transmission.
Variable patterns of transmission investment have been reported previously, for models fit
to time series ofP. falciparuminfections of human patients [29]. Yet the differences in
trans-mission investment across mice are especially striking given that these infections represent genetically similar hosts inoculated with a uniform dose of the same parasite strain and housed in identical lab conditions. The variance across hosts is unlikely to be caused solely by stochas-tic differences in the initial inoculum size, which would have been accounted for in the
calcula-tion of effective propagacalcula-tion numbers. Previous work onP. chabaudihas shown greater
be driven by differences in the immune response, which, when experimentally perturbed, can substantially alter gametocyte dynamics in mice [40]. Mice may differ in their adaptive immune responses, even to the same parasite strain, as has been shown in humans: naïve
vol-unteers infected with a single strain ofP. falciparumdiverged in their immune responses,
acquiring different sets of antibodies in response to the antigens expressed by parasites [41]. Thus, one possible explanation is that mice quickly diverge in their immune responses, despite being genetically homogenous, leading to large differences in transmission investment across mice.
Fig 4. The spline method shows evidence for both constant and variable patterns of transmission investment in data from six mice.Points indicate the pattern of transmission investment associated with the best fit to logged gametocyte counts (S5 Fig). When the proportion gametocyte carryover () was allowed to vary between zero and one (purple closed dots), three mice showed constant levels of transmission investment (A, B, and D) while the others showed variable patterns (C, E, and F). The corresponding levels of gametocyte carryover are given next to each curve, and all fall below the upper confidence limit reported previously (67%, equivalent to a 41-hour half life, [20]). The observed and predicted gametocyte counts are shown inS5 Fig.
Concluding remarks
Our results suggest that estimating transmission investment is a more challenging problem than has previously been appreciated. We have focused on malaria infections in mice as a (comparatively) straightforward case study, because the system is amenable to experimental manipulation and the parasite life cycle has been extensively characterized. Even when
syn-chronized cohorts of parasites can be identified, as withP. chabaudi, linking those cohorts to
their subsequent transmission stage production is a nontrivial problem. Whenever transmis-sion stages persist longer than a cycle of within-host proliferation—a complication likely to
arise in diverse parasites—errors in transmission stage abundance are non-independent and
more specialized statistical approaches are needed. The approach we develop here addresses this challenge and reveals intriguingly diverse patterns of transmission investment in real infections.
Methods
All calculations were performed usingR(R Project for Statistical Computing,http://r-project.
org/). Unless otherwise noted, we used the model specifications of Greischaret al. [18]. The full details of the expanded age-structured model for gametocyte development is in the online Supporting Information (S1 Text), as is the annotated code for the new method of calculating
transmission investment (S2 Text,S1 Code).
Supporting Information
S1 Text. Early markers for gametocyte development cannot remove bias in current meth-ods.
(PDF)
S2 Text. Annotated code for the new method.
(PDF)
S1 Code. Executable R code for the new method.
(R)
S1 Fig. Early detectionper sedoes not ensure that transmission investment will be correctly estimated.Here we assume that sexual differentiation can be detected as soon as a red blood cell is invaded, and the resulting abundance of infected red blood cells undergoing sexual dif-ferentiation (red) is compared with the total number of infected red blood cells (gray, A). Sam-pled time points are indicated by dots. The inferred transmission investment is shown below (B), taken as the fraction of the total number of infected red blood cells (excluding mature gametocytes) that are undergoing sexual differentiation (that is,IG(t)/(IG(t) +I(t))). The true transmission investment (5%) is shown as a dashed black line.
(EPS)
S2 Fig. Early markers can resolve transmission investment under special conditions.The expression profile of the hypothetical marker during sexual development is shown in red (A, B). Parasites in the latter part of sexual development (i.e., not expressing the marker, gray) were excluded from calculations of transmission investment, along with mature gametocytes. Infection dynamics are shown on a log-scale (C, D), with marker-expressing parasites (early sexuals) shown in red and the total number of immature parasites (both early sexual and
asex-ual forms) indicated by the black curves.“Sampling”of the simulated infection occurred at the
(E, F), calculated as the proportion of marker-expressing parasites to total recently-invaded red blood cells (asexual or marker-expressing sexual). The actual level (5%) is indicated by a dashed line.
(EPS)
S3 Fig. The estimated transmission investment is closer to the true value when we correct for gametocyte mortality.Specifically, we divide gametocyte abundance byexp(-μg0.3),
whereμgis the mortality rate for gametocytes, and 0.3 represents the time lag between
synchro-nous bursting events and sampling. As before, transmission investment was estimated with splines, fitting the model to time series simulated with transmission investment pattern shown in black.
(EPS)
S4 Fig. Estimated transmission investment in the presence of immunity against asexual parasites (purple dots), with the true value shown in black.As before, transmission invest-ment curves of increasing complexity were fit to the simulated time series. Simulations assumed that immune clearance saturates as the number of asexual parasites increases (a= 150,b= 100).
(EPS)
S5 Fig. Model-fitted gametocyte abundance (red curves) compared with observed gameto-cyte counts (black points).These fits correspond to the patterns of transmission investment
shown inFig 4.
(EPS)
S6 Fig. Abundance of red blood cells (blue), infected red blood cells (red) and gametocytes (green) for the six mice used to estimate transmission investment.Mouse 4 showed slightly unusual dynamics, which are delineated with darker colors and broken lines. Data were taken
from untreated infections with drug-resistantP. chabaudiparasites [37,38].
(EPS)
Acknowledgments
We thank Elsa Hansen, David Kennedy, Petra Schneider and Sarah Reece for useful discussion, Thomas Platt and Laura Pollitt for helpful comments on earlier manuscript drafts.
Author Contributions
Wrote the paper: MAG NM AFR ONB. Conceived and designed the study: MAG NM AFR ONB. Performed the study: MAG. Analyzed the model: MAG NM AFR ONB. Contributed analysis tools: MAG ONB.
References
1. Koella JC, Antia R. Optimal pattern of replication and transmission for parasites with two stages in their life cycle. Theoretical Population Biology. 1995; 47:277–291. Available from:http://www.sciencedirect. com/science/article/pii/S004058098571012X. doi:10.1006/tpbi.1995.1012
2. Carter LM, Kafsack BFC, Llinás M, Mideo N, Pollitt LC, Reece SE. Stress and sex in malaria parasites: Why does commitment vary? Evolution, Medicine, and Public Health. 2013 Jun; 2013(1):135–147. doi: 10.1093/emph/eot011PMID:24481194
4. Reece SE, Ali E, Schneider P, Babiker HA. Stress, drugs and the evolution of reproductive restraint in malaria parasites. Proceedings of the Royal Society B: Biological Sciences. 2010 Oct; 277
(1697):3123–3129. Available from:http://www.pubmedcentral.nih.gov/articlerender.fcgi?artid= 2982055&tool = pmcentrez&rendertype = abstract. doi:10.1098/rspb.2010.0564PMID:20484242
5. Pollitt LC, Mideo N, Drew DR, Schneider P, Colegrave N, Reece SE. Competition and the evolution of reproductive restraint in malaria parasites. American Naturalist. 2011 Mar; 177(3):358–367. doi:10. 1086/658175PMID:21460544
6. Metcalf CJE, Graham AL, Huijben S, Barclay VC, Long GH, Grenfell BT, et al. Partitioning regulatory mechanisms of within-host malaria dynamics using the effective propagation number. Science. 2011 Aug; 333(6045):984–988. doi:10.1126/science.1204588PMID:21852493
7. Garnham PCC. Malaria Parasites And Other Haemosporidia. 1st ed. Oxford: Blackwell Scientific Pub-lications; 1966.
8. Bruce MC, Alano P, Duthie S, Carter R. Commitment of the malaria parasitePlasmodium falciparumto sexual and asexual development. Parasitology. 1990 Apr; 100(02):191–200. doi:10.1017/
S0031182000061199PMID:2189114
9. Bousema T, Drakeley C. Epidemiology and infectivity ofPlasmodium falciparumandPlasmodium vivax
gametocytes in relation to malaria control and elimination. Clinical Microbiology Reviews. 2011 Apr; 24 (2):377–410. Available from:http://www.pubmedcentral.nih.gov/articlerender.fcgi?artid=
3122489&tool = pmcentrez&rendertype = abstract. doi:10.1128/CMR.00051-10PMID:21482730
10. Taylor LH, Read AF. Why so few transmission stages? Reproductive restraint by malaria parasites. Parasitology Today. 1997; 13(4):135–140. doi:10.1016/S0169-4758(97)89810-9PMID:15275099
11. Mideo N, Day T. On the evolution of reproductive restraint in malaria. Proceedings of The Royal Society B: Biological Sciences. 2008 May; 275(1639):1217–1224. Available from:http://www.pubmedcentral. nih.gov/articlerender.fcgi?artid=2602685&tool = pmcentrez&rendertype = abstract. doi:10.1098/rspb. 2007.1545PMID:18303001
12. Schneider P, Schoone G, Schallig H, Verhage D, Telgt D, Eling W, et al. Quantification ofPlasmodium falciparumgametocytes in differential stages of development by quantitative nucleic acid sequence-based amplification. Molecular and Biochemical Parasitology. 2004 Sep; 137(1):35–41. doi:10.1016/j. molbiopara.2004.03.018PMID:15279949
13. Drew DR, Reece SE. Development of reverse-transcription PCR techniques to analyse the density and sex ratio of gametocytes in genetically diversePlasmodium chabaudiinfections. Molecular and Bio-chemical Parasitology. 2007 Dec; 156(2):199–209. doi:10.1016/j.molbiopara.2007.08.004PMID: 17889948
14. Reece SE, Ramiro RS, Nussey DH. Plastic parasites: sophisticated strategies for survival and repro-duction? Evolutionary Applications. 2009 Feb; 2(1):11–23. Available from:http://www.pubmedcentral. nih.gov/articlerender.fcgi?artid=2836026&tool = pmcentrez&rendertype = abstract. doi:10.1111/j. 1752-4571.2008.00060.xPMID:20305703
15. Brancucci NMB, Goldowitz I, Buchholz K, Werling K, Marti M. An assay to probePlasmodium falcipa-rumgrowth, transmission stage formation and early gametocyte development. Nature Protocols. 2015; 10(8):1131–1142. doi:10.1038/nprot.2015.072PMID:26134953
16. Eksi S, Morahan BJ, Haile Y, Furuya T, Jiang H, Ali O, et al.Plasmodium falciparumgametocyte devel-opment 1 (Pfgdv1) and gametocytogenesis early gene identification and commitment to sexual devel-opment. PLoS Pathogens. 2012 Jan; 8(10):e1002964. Available from:http://www.pubmedcentral.nih. gov/articlerender.fcgi?artid=3475683&tool = pmcentrez&rendertype = abstract. doi:10.1371/journal. ppat.1002964PMID:23093935
17. Mideo N, Reece SE, Smith AL, Metcalf CJE. The Cinderella Syndrome: Why do malaria-infected cells burst at midnight? Trends in Parasitology. 2013; 29(1):10–16. doi:10.1016/j.pt.2012.10.006PMID: 23253515
18. Greischar MA, Read AF, Bjørnstad ON. Synchrony in malaria infections: how intensifying within-host competition can be adaptive. The American Naturalist. 2014 Nov; 183(2):E36–E48. doi:10.1086/ 674357PMID:24464205
19. O’Donnell AJ, Schneider P, McWatters HG, Reece SE. Fitness costs of disrupting circadian rhythms in malaria parasites. Proceedings of The Royal Society B: Biological Sciences. 2011 Aug; 278
(1717):2429–2436. Available from:http://www.pubmedcentral.nih.gov/articlerender.fcgi?artid= 3125626&tool = pmcentrez&rendertype = abstract. doi:10.1098/rspb.2010.2457PMID:21208950
20. Reece SE, Duncan AB, West SA, Read AF. Sex ratios in the rodent malaria parasite,Plasmodium cha-baudi. Parasitology. 2003 Nov; 127(5):419–425. doi:10.1017/S0031182003004013PMID:14653531
22. Cameron A, Reece SE, Drew DR, Haydon DT, Yates AJ. Plasticity in transmission strategies of the malaria parasite,Plasmodium chabaudi: environmental and genetic effects. Evolutionary Applications. 2012; 6:365–376. doi:10.1111/eva.12005PMID:23467678
23. Gautret P, Miltgen F, Gantier JC, Chabaud AG, Landau I. Enhanced gametocyte formation by Plasmo-dium chabaudiin immature erythrocytes: pattern of production, sequestration, and infectivity to mosqui-toes. Journal of Parasitology. 1996; 82(6):900–906. doi:10.2307/3284196PMID:8973397
24. Mackinnon MJ, Gaffney DJ, Read AF. Virulence in rodent malaria: Host genotype by parasite genotype interactions. Infection, Genetics and Evolution. 2002; 1(4):287–296. doi:10.1016/S1567-1348(02) 00039-4PMID:12798007
25. Billingsley PF, Snook LS, Johnston VJ. Malaria parasite growth is stimulated by mosquito probing. Biol-ogy Letters. 2005; 1(2):185–189. doi:10.1098/rsbl.2004.0260PMID:17148162
26. Landau I, Boulard C. Life Cycles and Morphology. In: Killick-Kendrick R, Peters W, editors. Rodent Malaria. New York: Academic Press Inc.; 1978. p. 53–84.
27. Riley EM, Stewart VA. Immune mechanisms in malaria: new insights in vaccine development. Nature Medicine. 2013 Feb; 19(2):168–178. doi:10.1038/nm.3083PMID:23389617
28. Lensen A, Bril A, van de Vegte M, van Gemert GJ, Eling W, Sauerwein R.Plasmodium falciparum: infectivity of cultured, synchronized gametocytes to mosquitoes. Experimental Parasitology. 1999 Jan; 91(1):101–103. PMID:9920049
29. Eichner M, Diebner HH, Molineaux L, Collins WE, Jeffery GM, Dietz K. Genesis, sequestration and sur-vival ofPlasmodium falciparumgametocytes: Parameter estimates from fitting a model to malariather-apy data. Transactions of the Royal Society of Tropical Medicine and Hygiene. 2001; 95(5):497–501. doi:10.1016/S0035-9203(01)90016-1PMID:11706658
30. Pollitt LC, Reece SE, Mideo N, Nussey DH, Colegrave N. The problem of auto-correlation in parasitol-ogy. PLoS Pathogens. 2012 Jan; 8(4):e1002590. Available from:http://www.pubmedcentral.nih.gov/ articlerender.fcgi?artid=3325192&tool=pmcentrez&rendertype=abstract. doi:10.1371/journal.ppat. 1002590PMID:22511865
31. Gardner A, Reece SE, West SA. Even more extreme fertility insurance and the sex ratios of protozoan blood parasites. Journal of Theoretical Biology. 2003 Aug; 223(4):515–521. doi:10.1016/S0022-5193 (03)00142-5PMID:12875828
32. Shutler D, Read AF. Local mate competition, and extraordinary and ordinary blood parasite sex ratios. Oikos. 1998; 82(3):417–424. doi:10.2307/3546363
33. Greischar MA, Reece SE, Mideo N. The role of models in translating within-host dynamics to parasite evolution. Parasitology. 2015 11;FirstView:1–10. doi:10.1017/S0031182015000815PMID:26399436
34. Bjørnstad ON, Finkenstädt BF, Grenfell BT. Dynamics of measles epidemics: estimating scaling of transmission rates using a time series SIR model. Ecological Monographs. 2002; 72(2):169–184. Avail-able from:http://www.esajournals.org/doi/abs/10.1890/0012-9615(2002)072%5B0169:DOMEES% 5D2.0.CO%3B2. doi:10.1890/0012-9615(2002)072%5B0169:DOMEES%5D2.0.CO;2
35. de Boor C. A practical guide to splines. Marsden JE, Sirovich L, editors. New York: Springer-Verlag New York Inc.; 2001.
36. Faraway JJ. Extending the linear model with R. New York: Chapman & Hall/CRC; 2006.
37. Huijben S, Nelson WA, Wargo AR, Sim DG, Drew DR, Read AF. Chemotherapy, within-host ecology and the fitness of drug-resistant malaria parasites. Evolution. 2010 Oct; 64(10):2952–2968. Available from:http://www.pubmedcentral.nih.gov/articlerender.fcgi?artid=3066636&tool=
pmcentrez&rendertype=abstract. doi:10.1111/j.1558-5646.2010.01068.xPMID:20584075
38. Huijben S, Nelson WA, Wargo AR, Sim DG, Drew DR, Read AF. Data from: Chemotherapy, within-host ecology and the fitness of drug-resistant malaria parasites. Dryad Digital Repository; 2010. doi:10. 5061/dryad.4h0g0
39. Bell AS, de Roode JC, Sim D, Read AF. Within-host competition in genetically diverse malaria infec-tions: parasite virulence and competitive success. Evolution. 2006 Jul; 60(7):1358–1371. doi:10.1554/ 05-611.1PMID:16929653
40. Long GH,Chan BHK, Allen JE, Read AF, Graham AL. Experimental manipulation of immune-mediated disease and its fitness costs for rodent malaria parasites. BMC Evolutionary Biology. 2008 Jan; 8:128. Available from:http://www.pubmedcentral.nih.gov/articlerender.fcgi?artid=2391164&tool=
pmcentrez&rendertype=abstract. doi:10.1186/1471-2148-8-128PMID:18447949
41. Turner L, Wang CW, Lavstsen T, Mwakalinga SB, Sauerwein RW, Hermsen CC, et al. Antibodies against PfEMP1, RIFIN, MSP3 and GLURP are acquired during controlledPlasmodium falciparum