Geographic Distribution of CT, MRI and PET
Devices in Japan: A Longitudinal Analysis
Based on National Census Data
Masatoshi Matsumoto1*, Soichi Koike2, Saori Kashima3, Kazuo Awai4
1Department of Community-Based Medical System, Faculty of Medicine, Hiroshima University, Hiroshima, Japan,2Division of Health Policy and Management, Center for Community Medicine, Jichi Medical University, Tochigi, Japan,3Department of Public Health and Health Policy, Institute of Biomedical & Health Sciences, Hiroshima University, Hiroshima, Japan,4Department of Diagnostic Radiology, Institute of Biomedical & Health Sciences, Hiroshima University, Hiroshima, Japan
Abstract
Background
Japan has the most CT and MRI scanners per unit population in the world; however, the geographic distribution of these technologies is currently unknown. Moreover, nothing is known of the cause-effect relationship between the number of diagnostic imaging devices and their geographic distribution.
Methods
Data on the number of CT, MRI and PET devices and that of their utilizations in all 1829 mu-nicipalities of Japan was generated, based on the Static Survey of Medical Institutions con-ducted by the government. The inter-municipality equity of the number of devices or utilizations was evaluated with Gini coefficient.
Results
Between 2005 and 2011, the number of CT, MRI and PET devices in Japan increased by 47% (8789 to 12945), 19% (5034 to 5990) and 70% (274 to 466), respectively. Gini coeffi-cient of the number of devices was largest for PET and smallest for CT (p for PET-MRI dif-ference<0.001; MRI-CT difference<0.001). For all three modalities, Gini coefficient steadily decreased (p for 2011-2005 difference:<0.001 for CT; 0.003 for MRI; and<0.001 for PET). The number of devices in old models (single-detector CT, MRI<1.5 tesla, and con-ventional PET) decreased, while that in new models (multi-detector CT, MRI1.5 tesla, and PET-CT) increased. Gini coefficient of the old models increased or remained unchanged (increase rate of 9%, 3%, and -1%; p for 2011-2008 difference<0.001, 0.072, and 0.562, re-spectively), while Gini coefficient of the new models decreased (-10%, -9%, and -10%; p for 2011-2008 difference<0.001,<0.001, and<0.001 respectively). Similar results were ob-served in terms of utilizations.
a11111
OPEN ACCESS
Citation:Matsumoto M, Koike S, Kashima S, Awai K
(2015) Geographic Distribution of CT, MRI and PET Devices in Japan: A Longitudinal Analysis Based on National Census Data. PLoS ONE 10(5): e0126036. doi:10.1371/journal.pone.0126036
Academic Editor:Hajo Zeeb, Leibniz Institute for
Prevention Research and Epidemiology (BIPS), GERMANY
Received:December 17, 2014
Accepted:March 27, 2015
Published:May 6, 2015
Copyright:© 2015 Matsumoto et al. This is an open
access article distributed under the terms of the Creative Commons Attribution License, which permits unrestricted use, distribution, and reproduction in any medium, provided the original author and source are credited.
Data Availability Statement:All relevant data are
within the paper and the Supporting Information files.
Funding:This study was supported by Health and
Labour Sciences Research Grants of the Ministry of Health, Labour and Welfare, Tokyo, Japan (H25 -Research on Region Medical - 006). The funder had no role in study design, data collection and analysis, decision to publish, or preparation of the manuscript.
Competing Interests:The authors have declared
Conclusions
The more abundant a modality, the more equal the modality’s distribution. Any increase in the modality made its distribution more equal. The geographic distribution of the diagnostic imaging technology in Japan appears to be affected by spatial competition derived from a market force.
Introduction
Japan currently has the most diagnostic imaging devices in the world. The number of comput-ed tomography (CT) scanners per 100,000 population is 101, which is, by far, the largest among those of the Organisation for Economic Co-operation and Development (OECD) coun-tries (Australia, with 44, is a distant second). The number of magnetic resonance imaging (MRI) scanners per 100,000 in Japan, which is 48, is also the largest among the OECD coun-tries [1]. Despite this knowledge of device numbers, the geographic distribution of these tech-nologies within the country is largely unknown. Few studies on their geographic distribution currently exist for any country, let alone Japan [2], despite the abundance of studies on the adoption of these technologies [3–7].
Theoretically competition shapes the distribution. In a free market, service suppliers pursue the maximization of profit. Hence, the geographic distribution of services is affected by this market force. This is the basis of the spatial competition model [8,9]. More specifically, spatial competition is an economic model in which the quantity of a service resource determines its distribution. In this model, when few service resources or suppliers exist, the distribution is skewed to cities with large populations in which the maximal profit is expected. However, an increase in service resources increases the competition for profit in the large cities. This can re-locate the service resource towards smaller cities, with the result of improved equity in service distribution (the spatial competition effect) [8].
The spatial competition model is an attractive framework for considering the relationship between the amount of medical resources and its geographic distribution. However, the distri-bution of human resources for health, such as physicians, reportedly does not fit the prediction of this hypothesis. Even a substantial increase in the number of physicians did not improve the equity of the urban-rural distribution [10–12].
The distribution of material resources, such as diagnostic imaging devices, however, may be different from that of human resources, because, unlike humans, materials do not have the “preference for urban areas;”this preference is known to have a strong impact on human re-source distribution [13–15]. The extent to which the spatial competition force influences the distribution of material resources, however, is currently unknown.
If spatial competition holds in diagnostic imaging devices, the devices would first be adopted in large cities. With an increase in numbers and subsequent competition in the large cities, they would then spread out to the smaller cities. In Japan, the first CT scanners were available in clinical practices in the 1970s; these were then followed by MRI scanners in the 1980s and positron-emission tomography (PET) scanners in the first decade of the 2000s [16,17]. Thus, PET can be regarded as being in the early state of adoption, MRI in the middle, and CT in the late stage. Thus, it is possible, in Japan, to test whether different modalities in dif-ferent adoption stages illustrate difdif-ferent levels of equity in their distribution.
covered by public health insurance, while most medical institutions, whether they be private or public, are run by profits from their practice [18]. The fee schedule for diagnostic imaging ser-vices is the same across the nation and medical institutions profit from patients’out-of-pocket expenditures and reimbursements from public insurance. Although there are several types of insurers in Japan, the extent of services covered is uniform across the insurers. Thus there is no geographic inequity in the power to create demand for the imaging services. The second reason is because an extensive number of diagnostic imaging devices are traded every year, as the de-vice market is large and mature in Japan. The third reason is that there is no regulation for medical institutions with regard to purchasing medical equipment [17]. As such, any hospital or clinic in any location can purchase or rent imaging devices if it can afford them. In this way, the national and local governments do not put a regional cap on the number of devices. For these reasons, it is assumed that the distribution of diagnostic imaging devices is more likely to be influenced by the market force and demand distribution in Japan, than in other countries.
Consequently, the primary purpose of this investigation is to illustrate the trend in the dis-tribution of diagnostic imaging devices in Japan. The second purpose is to show that the geo-graphic distribution of the devices follows a spatial competition model, by showing the association between the number of CT, MRI and PET scanners and their distributions in Japan.
Materials and Methods
Device data
Japan has three levels of government: municipal, prefectural and national. Data analyzed per-tained to the number and use of CT, MRI and PET scanners in each of Japan’s 1829 municipal-ities (city, town and village). The CT, MRI and PET were chosen because they are
representative of current diagnostic imaging modalities, are commonly used for scanning the entire body, and vary greatly in the timing of being available and in the amount of
devices available.
Unpublicized individual data were obtained from the Static Survey of Medical Institutions that was conducted in 2005, 2008 and 2011. Permission to use the data for research was ob-tained by the Ministry of Health, Labour and Welfare. The Static Survey of Medical Institutions is conducted by the Ministry every three years. All clinics and hospitals in Japan are required, by national law, to report their activities and resources in the survey; the capture rate of the data in the survey was estimated, based on childbirth data, to be 91.8% in 2005, 93.8% in 2008, and 92.3% in 2011 [19]. Data on the number of CT, MRI and PET scanners in each hospital or clinic on October 1 of the year was used. Data on the number of utilizations in September of each year for CT, MRI and PET was also used. CT was classified into multi- and single-detector CT in the 2008 and 2011 survey. MRI was classified into as with<1.5 and1.5 tesla; PET was classified as conventional PET and PET-CT in the 2008 and 2011 data. The information on the device versions was not available in the 2005 dataset. The 2011 survey did not cover all of the facilities in Fukushima and some of the facilities in Miyagi prefecture, because of the Great East Japan Earthquake. For this reason, data in these areas was deleted.
Municipality data
changed the number of municipalities in Japan between 2005 and 2011, and so the 2012 mu-nicipality classification was applied to the 2005, 2008 and 2011 data.
Statistical analysis
To obtain the transition of the number of devices, the number of devices and utilizations (per-formed cases) in the entire country in each year was calculated. To examine the geographic dis-tribution of the devices, the municipalities (n = 1829) were classified into three types:
“metropolis”,“city”, and“town/village”.“Metropolis”includes all of the wards (ku) of the ordi-nance-designated cities (seirei-shitei-toshi) and 23 special wards of Tokyo (n = 193).“City” in-cludes the other cities (shi) (n = 752);“town/village”includes towns (cho) and villages (son) (n = 884). An ordinance-designated city (seirei-shitei-toshi) has a population greater than 500,000, which is expected to reach the 1,000,000 mark in the near future. A city (shi) has a population greater than 50,000. Consequently, the number of devices and their utilizations per 100,000 population in each municipality type was calculated using the data of the total number of devices or utilization and the total population in the group of municipalities.
To evaluate the inter-municipality equity of the number of devices per unit population, the Gini coefficient was calculated. The Gini coefficient is the most popular parameter of income equity. It has been used extensively in the health-related literature, in which the inter-commu-nity, or inter-facility equity of resources, have been evaluated [2,11,21–26]. In this study, we re-gard the imaging device as the“wealth”of the municipality and illustrate the disparity of wealth among the municipalities using the Gini coefficient. In the calculation of the Gini coeffi-cient, all of the 1829 municipalities were ranked by the number of devices per 100,000 popula-tion. Each municipality was plotted onto the plane of coordinates with its x-axis being the cumulative proportion of the population and the y-axis being the cumulative proportion of the devices. The plotted line is the Lorenz curve; the Gini coefficient is the area between the Lorenz curve and the 45 degree line, which is divided by the triangle under the 45 degree line [11,24]. The Gini coefficient ranges from 0 (complete equity) to 1 (complete inequity), according to the variation in the number of devices per 100,000 population among the municipalities. A similar procedure was conducted for the number of utilizations. A significance test was conducted to examine the difference in the Gini coefficient between devices and between years. This was ac-complished by calculating the bootstrapped standard errors for the Gini coefficient [27].
All but one of these statistical analyses were conducted using SPSS version 21 (IBM-SPSS Japan, Tokyo); the calculation of the Gini coefficients and the significance test for their differ-ences were conducted with STATA software (version 12, College Station, TX, USA). All the maps shown in Results were created using ArcGIS version 10.0 (ESRI Japan Inc.).
Ethics Statement
The Ethics Committee of the Graduate School of Medicine and Faculty of Medicine at the Uni-versity of Tokyo has assessed and given permission for this study (assessment number 10128). The Ethics Committee for Epidemiological Research at Hiroshima University agreed to this permission (assessment number 838).
Results
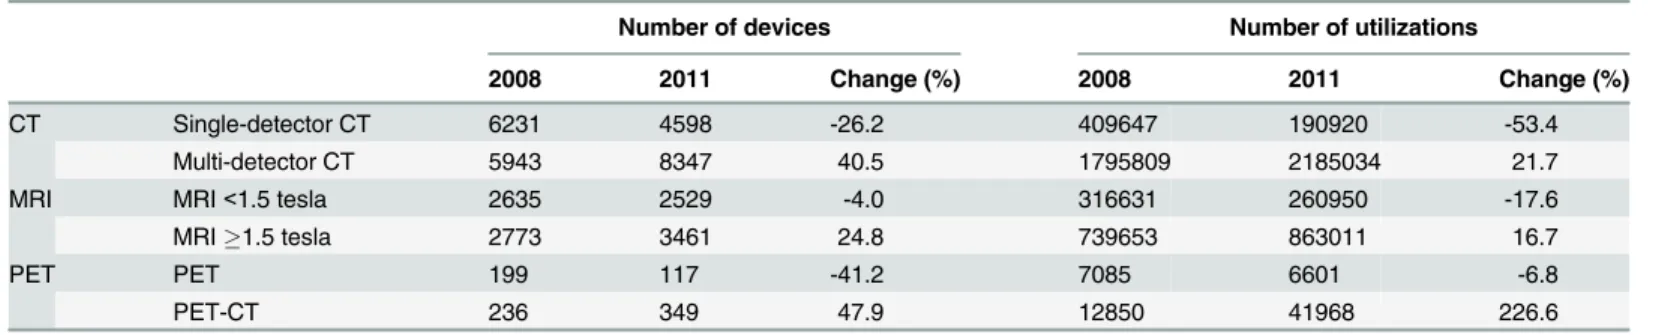
devices, and that of utilizations for older models (i.e. single-detector CT, MRI<1.5 tesla, and
conventional PET), have decreased; those for newer models (i.e. multi-detector CT, MRI1.5 tesla, and PET-CT) increased. This indicates that old models were increasingly replaced by newer ones.
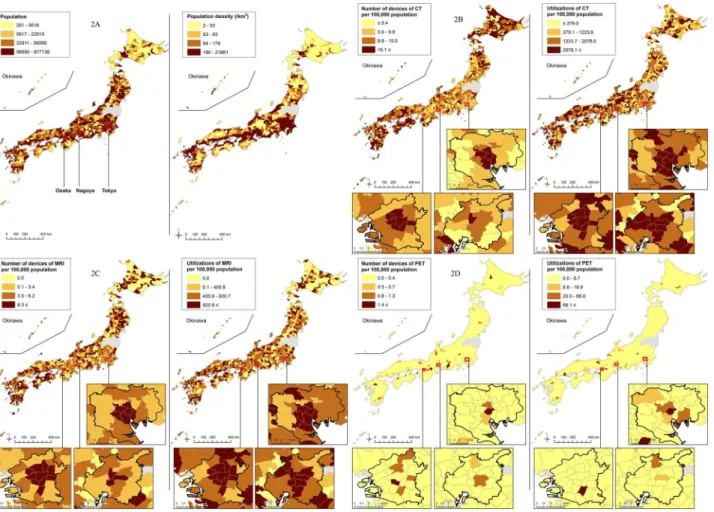
Distributions of the number of devices and utilizations per 100,000 population among the municipalities in 2011 are shown inFig 2. Disparity was observed in the distributions of all three modalities. In particular, PET was concentrated in some limited areas, while most of the municipalities did not possess it.
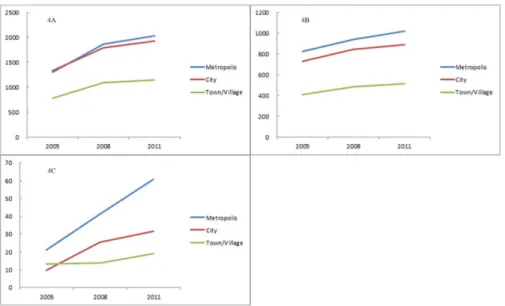
The transition of the number of devices and of utilizations per 100,000 population by mu-nicipality type is illustrated in Figs3and4. CT scanners were widespread among the munici-palities, but the distribution was biased toward smaller municimunici-palities, such as towns and villages, rather than toward metropolises. In contrast, the number of MRI scanners was higher in larger municipalities. The distribution of PET scanners was even further skewed to larger municipalities. The rate of increase of PET scanners was larger in the larger municipalities, while the increase rates of the MRI and CT scanners were not largely different among the mu-nicipality types. Compared with the distributions of devices, those of utilizations of all the three modalities were biased toward larger municipalities, which can also be observed inFig 2 (particularly in expanded metropolises). The rate of increase in PET utilizations was larger in the larger municipalities, while the increase rates of the MRI and CT utilizations were not so different among the municipality types. For both the number of devices and utilizations, dis-parity among the metropolis, city and village was larger in PET than in the CT or MRI.
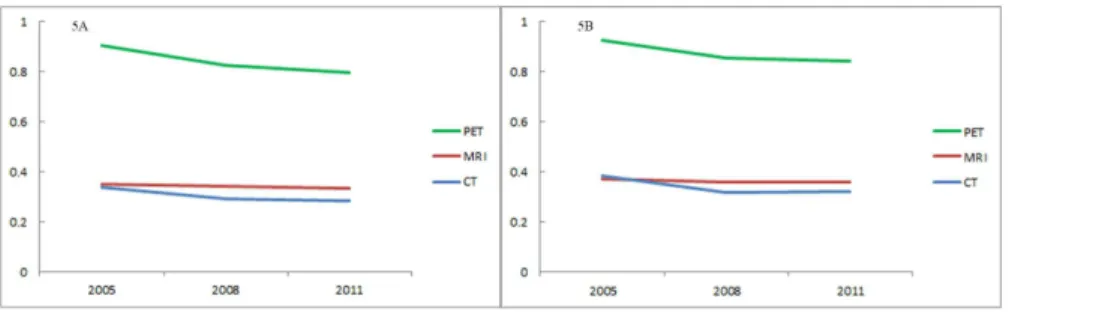
The transition of the Gini coefficient for each modality is shown in Fig5A(device) and5B (utilization). Lorenz curves are shown as supporting information inS1(device) andS2Figs Fig 1. Number of devices (1A) and utilizations (1B) of CT, MRI and PET.The number of utilizations is drawn from September of each year.
doi:10.1371/journal.pone.0126036.g001
Table 1. Number of devices and utilizations classified by device version.
Number of devices Number of utilizations
2008 2011 Change (%) 2008 2011 Change (%)
CT Single-detector CT 6231 4598 -26.2 409647 190920 -53.4
Multi-detector CT 5943 8347 40.5 1795809 2185034 21.7
MRI MRI<1.5 tesla 2635 2529 -4.0 316631 260950 -17.6
MRI1.5 tesla 2773 3461 24.8 739653 863011 16.7
PET PET 199 117 -41.2 7085 6601 -6.8
PET-CT 236 349 47.9 12850 41968 226.6
(utilization). The Gini coefficient of the number of devices was largest in PET and smallest in CT for any year (p for PET-MRI difference in 2008:<0.001; p for MRI-CT difference:<0.001).
This indicates greater equity in the distribution of CT scanners than that of MRI or PET scan-ners. For all three modalities, the Gini coefficient constantly decreased for the six years (p for 2011–2005 difference:<0.001 in CT; 0.003 in MRI; and<0.001 in PET). This means an
in-creasingly equitable distribution in all modalities. The decrease was largest in CT (16%), fol-lowed by PET (12%) and MRI (4%). The Gini coefficient of the number of utilizations illustrated a similar trend. The Gini coefficient of utilizations was largest in PET, followed by MRI and CT (p for PET-MRI difference in 2008<0.001, p for MRI-CT difference<0.001). It
did decrease (p for 2011–2005 difference<0.001 for CT; 0.003 for MRI; and<0.001 for PET)
and its decrease was largest in CT (16%), followed by PET (9%) and MRI (4%).
Fig 6shows the transition of the Gini coefficient of each model with regard to the number of devices. Lorenz curves are shown as supporting information inS3(old) andS4(new models) Figs Both in the old and new models, the Gini coefficient was higher for the model whose num-ber of devices was lower (p for difference between conventional PET and MRI<1.5 tesla <0.001, that between MRI<1.5 tesla and single-detector CT<0.001; that between PET-CT
and MRI1.5 tesla<0.001, that between MRI1.5 tesla and multi-detector CT<0.001). For
Fig 2. Population, population density (2A), number of devices, and number of utilizations of CT (2B), MRI (2C) and PET (2D) in each municipality in 2011.Quartile points of all values were used as cut-offs for color change except for PET in which quartile points of values excluding zero were used.
the three years, the Gini coefficient of old models (single-detector CT, MRI<1.5 tesla, and
con-ventional PET) either increased or remained unchanged (increase rate 9%, 3%, and -1% respec-tively; p for 2011–2008 difference<0.001, 0.072, and 0.562 respectively). In contrast, the Gini
coefficient of new models (multi-detector CT, MRI1.5 tesla, and PET-CT) decreased (in-crease rate -10%, -9%, and -10% respectively; p for 2011–2008 difference<0.001,<0.001, and <0.001 respectively).
Fig 3. Number of devices of CT (3A), MRI (3B), and PET (3C) per 100,000 population, classified by municipality type.“Metropolis”includes all the wards (ku) of the ordinance-designated cities ( seirei-shitei-toshi), as well as 23 special wards of Tokyo (n = 193).“City”includes the other cities (shi) (n = 752);“town/ village”includes towns (cho) and villages (son) (n = 884).
doi:10.1371/journal.pone.0126036.g003
Fig 4. Number of utilizations of CT (4A), MRI (4B), and PET (4C) per 100,000 population, classified by municipality type.
Discussion
The results of this study illustrated that there was substantial disparity in the geographic distri-bution of diagnostic imaging devices in Japan. The more abundant the modality, the more equal its distribution. Increasing the number of devices or utilizations improved the equity of the distribution. Old models, which decreased in number and were less used, showed an in-creasingly unequal distribution, while new models, which increased in number and were used more, were distributed more equally than before.
According to the spatial competition model, a scarce resource, such as PET, highly concen-trates in large cities; this creates a very unequal distribution against the population. In contrast, the distribution of an abundant resource, such as CT, becomes fairly equal against the popula-tion. An increase in the amount of resources raises the equality of its distribution, while a de-crease in resources, just like that of the old models of the devices, reduces the equality. All of these predictions were observed in the results. Thus, the results suggest that the relationship be-tween the amount and the distribution of technology resources is influenced by
spatial competition.
Among all of the types of service resources, the geographic distribution of physicians has been most extensively studied. In Japan, the number of physicians per unit population has in-creased by 70% over the past 30 years. That being said, the equity of their geographic distribu-tion has remained unchanged [10–12,28–30]. A similar trend was observed in the United States [10,31]. The geographic distribution of physicians thus does not appear to follow the spatial competition model. Some of the proposed reasons for this are the physician’s preference for urban areas and urban-rural imbalance of the physician’s background [14,32,33]. Material resources do not have such elements. Thus, the distribution of diagnostic imaging devices is Fig 5. Gini coefficient of the number of devices (5A) and utilizations (5B).
doi:10.1371/journal.pone.0126036.g005
Fig 6. Gini coefficient of the number of older devices (6A) and newer devices (6B).
supposed to be influenced more directly by market forces than that of human resources. Hospi-tals and clinics in Japan, whether located in urban or rural areas, can possess diagnostic imag-ing devices if there is sufficient demand and if the institutions can afford to rent or buy them. This factor would separate the distribution pattern between human and material resources.
As illustrated in Figs3and4, the distribution of CT devices was skewed to rural municipali-ties, while that of CT utilizations was biased towards urban municipalities. This gap may be caused by the unique health care environment in Japan. Japanese health care is a combination of public and private institutions. The proportion of public institutions is higher in the rural areas, than in the urban areas [34]. Public medical institutions are run by profit from their practice, as well as with a local or national governmental budget. In addition, public and private medical institutions in rural areas can purchase equipment with the help of state subsidies. Thus, a rural medical institution is probably more likely to possess expensive diagnostic imag-ing devices than an urban institution if the expected profits gained from usimag-ing the devices are the same [35]. This can increase the number of imaging devices in rural areas, particularly de-vices usable at primary care facilities, such as CT, while their utilizations are relatively small.
Limitations
The financial protection policy for rural medical institutions potentially influenced the snap-shot distribution of the devices in each year. This can lead to an overestimation of the spatial competition effect at each time point by biasing the distribution toward rural areas. In this sense, a comparison of the Gini coefficients among CT, MRI and PET at a certain time needs attention. However, the longitudinal change of the equity of the distribution, in response to the change in the amount of the devices, which is the primary reason for the existence of spatial competition, is not affected by this policy.
The rural protection policy could also be reflected in the distribution pattern of the subtypes of the modalities. As shown in the results, the number of new models of CT, MRI and PET in-creased and spread increasingly to small municipalities, while the number of old models de-creased and their distributions gravitated towards large municipalities. This suggests that the replacement of old models with new ones, or the installation of new models in addition to con-ventional ones, are more common in rural than in urban areas in Japan.
MRI, and PET, in particular, cannot be placed in rural facilities without full-time radiolo-gists, because the use of this equipment requires highly specialized knowledge. In Japan, most institutes with PET scanners only perform18F-Fluorodeoxyglucose (18F-FDG)-PET examina-tions and use18F-FDG compounds delivered from commercially available PET laboratories. Because the half-life period of18F-FDG is about 110 minutes, institutions using delivery
18F-FDG compounds must be located close to the PET laboratories. When comparing the
equi-ty of the distribution among CT, MRI and PET, both the spatial competition effect and these factors should be taken into account.
The number of utilizations in this study is for only one month, which is less reliable than the annual number. In addition, the CT data in the Static Survey of Medical Institutions in 2005 is not that of all types of CT, but only that of helical CT. Thus, it needs attention when 2005 CT data is compared with CT data in other years. However, by 2005, most of the conven-tional CT scanners were presumably replaced by the helical model in Japan. Thus, we consider that the difference between our data and the real number of CT scanners was small.
may be overestimated, as compared with that of CT and MRI. In addition, the Gini coefficient can only be interpreted relatively, because there is no clear definition of a low or high value.
Conclusions
A reasonable allocation of medical resources, based on the distribution of demand, is one focus of political interventions. The uneven distribution of human resources, such as physicians, is a worldwide problem. Consequently, numerous policies, sometimes using state power and a sub-stantial budget, have been implemented to address this issue [33,37,38]. Although advanced medical equipment, such as MRI and PET, should be allowed to be concentrated in large cities because of its scarcity, devices which are regarded in Japan as tools for primary care, such as X-ray machines and CT, need to be distributed equally. The distribution of diagnostic imaging devices seems to be directly influenced by the invisible hand of the market, and thus is more likely to be optimized by an increase in numbers as compared with the distribution of human resource. Hence, we recommend, with regard to devices that need to be distributed fairly, that political priority be placed on securing resources in the right quantities, instead of in the alloca-tion of resources.
Supporting Information
S1 Fig. Lorenz curves of the number of CT, MRI, and PET devices. (TIF)
S2 Fig. Lorenz curves of the number of CT, MRI, and PET utilizations. (TIF)
S3 Fig. Lorenz curves of the number of single-detector CT, MRI<1.5 tesla, and
convention-al PET devices. (TIF)
S4 Fig. Lorenz curves of the number of multi-detector CT, MRI1.5 tesla, and PET-CT de-vices.
(TIF)
Author Contributions
Conceived and designed the experiments: MM SKo SKa KA. Analyzed the data: MM SKa. Wrote the paper: MM SKo SKa KA.
References
1. The Organisation for Economic Co-operation and Development (2014) OECD Health Statistics 2014. Available:http://www.oecd.org/els/health-systems/health-data.htm. Accessed Nov 11, 2014.
2. He D, Yu H, Chen Y (2013) Equity in the distribution of CT and MRI in China: a panel analysis. Int J Eq-uity Health 12: 39. doi:10.1186/1475-9276-12-39PMID:23742755
3. Hillman AL, Schwartz JS (1985) The adoption and diffusion of CT and MRI in the United States. A com-parative analysis. Med Care 23: 1283–1294. PMID:3906295
4. Korogi Y, Takahashi M (1997) Cost containment and diffusion of MRI: oil and water?. Japanese experi-ence. Eur Radiol 7 Suppl 5: 256–258. PMID:9370555
5. Oh EH, Imanaka Y, Evans E (2005) Determinants of the diffusion of computed tomography and mag-netic resonance imaging. Int J Technol Assess Health Care 21: 73–80. PMID:15736517
6. Hutubessy RC, Hanvoravongchai P, Edejer TT, Asian MRISG (2002) Diffusion and utilization of mag-netic resonance imaging in Asia. Int J Technol Assess Health Care 18: 690–704. PMID:12391959
8. Newhouse JP (1990) Geographic access to physician services. Annu Rev Public Health 11: 207–230. PMID:2191659
9. Newhouse J, Williams A, Bennett B, Schwartz W (1982) Does the geographical distribution of physi-cians reflect market failure? Bell J Econ 13: 493–506.
10. Matsumoto M, Inoue K, Bowman R, Noguchi S, Toyokawa S, Kajii E. (2010) Geographical distributions of physicians in Japan and US: Impact of healthcare system on physician dispersal pattern. Health Poli-cy 96: 255–261. doi:10.1016/j.healthpol.2010.02.012PMID:20236722
11. Kobayashi Y, Takaki H (1992) Geographic distribution of physicians in Japan. Lancet 340: 1391–1393. PMID:1360099
12. Toyabe S (2009) Trend in geographic distribution of physicians in Japan. Int J Equity Health 8: 5. doi: 10.1186/1475-9276-8-5PMID:19257879
13. Laven GA, Beilby JJ, Wilkinson D, McElroy HJ (2003) Factors associated with rural practice among Australian-trained general practitioners. Med J Aust 179: 75–79. PMID:12864716
14. Matsumoto M, Inoue K, Kajii E (2008) Characteristics of medical students with rural origin: Implications for selective admission policies. Health Policy 87: 194–202. doi:10.1016/j.healthpol.2007.12.006 PMID:18243398
15. Matsumoto M, Okayama M, Inoue K, Kajii E (2005) Factors associated with rural doctors' intention to continue a rural career: a survey of 3072 doctors in Japan. Aust J Rural Health 13: 219–225. PMID: 16048463
16. Japan Medical imaging and Radiological Systems Industries Association (2001) History of medical de-vices. Available:http://www.jira-net.or.jp/vm/aetas.html. Accessed Dec 4, 2014.
17. Niki R (1985) The wide distribution of CT scanners in Japan. Soc Sci Med 21: 1131–1137. PMID: 4081816
18. Ikegami N, Yoo BK, Hashimoto H, Matsumoto M, Ogata H, Babazono A, et al. (2011) Japanese univer-sal health coverage: evolution, achievements, and challenges. Lancet 378: 1106–1115. doi:10.1016/ S0140-6736(11)60828-3PMID:21885107
19. Matsumoto M, Koike S, Matsubara S, Kashima S, Ide H, Yasunaga H (2014) Selection and concentra-tion of obstetric facilities in Japan: Longitudinal study based on naconcentra-tional census data. J Obstet Gynae-col Res. doi:10.1111/jog.12663. [Epub ahead of print]
20. Statistics Bureau, Ministry of Internal Affairs and Communications (2013) Statistical Observations of Shi,Ku,Machi,Mura 2013. Available:http://www.e-stat.go.jp/SG1/estat/List.do?bid=
000001048449&cycode=0. Accessed Nov 11, 2014.
21. De Maio FG (2007) Income inequality measures. J Epidemiol Community Health 61: 849–852. PMID: 17873219
22. Horev T, Pesis-Katz I, Mukamel DB (2004) Trends in geographic disparities in allocation of health care resources in the US. Health Policy 68: 223–232. PMID:15063021
23. Shinjo D, Aramaki T (2012) Geographic distribution of healthcare resources, healthcare service provi-sion, and patient flow in Japan: a cross sectional study. Soc Sci Med 75: 1954–1963. doi:10.1016/j. socscimed.2012.07.032PMID:22920275
24. Brown MC (1994) Using Gini-style indices to evaluate the spatial patterns of health practitioners: theo-retical considerations and an application based on Alberta data. Soc Sci Med 38: 1243–1256. PMID: 8016689
25. Hann M, Gravelle H (2004) The maldistribution of general practitioners in England and Wales: 1974–
2003. Br J Gen Pract 54: 894–898. PMID:15588532
26. Schwanke Khilji SU, Rudge JW, Drake T, Chavez I, Borin K, Touch S, et al. (2013) Distribution of se-lected healthcare resources for influenza pandemic response in Cambodia. Int J Equity Health 12: 82. doi:10.1186/1475-9276-12-82PMID:24090286
27. Biewen M (2002) Bootsrap inference for inequality, mobility and poverty measurement. Journal of Econometrics 108: 317–342.
28. Tanihara S, Kobayashi Y, Une H, Kawachi I (2011) Urbanization and physician maldistribution: a longi-tudinal study in Japan. BMC Health Serv Res 11: 260. doi:10.1186/1472-6963-11-260PMID: 21982582
29. Inoue K, Matsumoto M, Toyokawa S, Kobayashi Y (2009) Transition of physician distribution (1980–
2002) in Japan and factors predicting future rural practice. Rural Remote Health 9: 1070. PMID: 19463042
31. Ricketts TC, Randolph R (2007) Urban-rural flows of physicians. J Rural Health 23: 277–285. PMID: 17868233
32. Takayashiki A, Okayama M, Mise J, Kajii E (2003) The birthplaces of medical students and their inten-tions of rural practice (Igakusei no syusshinchi to syourai no hekichikinmu kibou.). Primary Care 26 (supple): 142.
33. World Health Organization (2010) Increasing access to health workers in remote and rural areas through improved retention: global policy recommendations. Geneva: WHO. PMID:23741785
34. Ikegami N, Campbell JC (1996) The art of balance in health policy: maintaining Japan's low-cost, egali-tarian system. Tokyo: Chuko-shinsyo. doi:10.1586/erp.09.18PMID:19527091
35. Matsumoto M, Okayama M, Inoue K, Kajii E (2004) High-tech rural clinics and hospitals in Japan: a comparison to the Japanese average. Aust J Rural Health 12: 215–219. PMID:15588266
36. Ellison GT (2002) Letting the Gini out of the bottle? Challenges facing the relative income hypothesis. Soc Sci Med 54: 561–576. PMID:11858212
37. Barnighausen T, Bloom DE (2009) Financial incentives for return of service in underserved areas: a systematic review. BMC Health Serv Res 9: 86. doi:10.1186/1472-6963-9-86PMID:19480656