Lifeform: An Explanation of Prejudices
of Young People
ISTVAN MURANYI
1University of Debrecen, Institute of Political Science and Sociology, Department of Sociology
VESA PUURONEN
2University of Eastern Finland, Department of Social Sciences
DENIS ZUEV
3Max Plank Institute for Social Anthropology, Siberian Studies Centre
Abstract
In the present article we intend to point out the relationship between prejudice and national concepts in different national contexts among students. We tried to justify that the explanation based on the view of prejudices by Fuchs and Case - according to whom prejudice is not an attitude but a way of life – is valid in different national contexts. For this reason the procedure was applied in our survey in order to validate the conception in three (Hungarian, Finnish, Russian) different cultural-political contexts, and also to use it as a reference model in determining the explanation of prejudice. The second aim was to reveal the structural relationships between the national attitudes of the model and attitudes towards minority groups.
Keywords:Prejudice, National Attitude, Lifeform, Survey Research, Comparative Analysis
Introduction
A number of research shows that strong prejudices towards minority groups are characteristic to young people living in disadvantageous socio-cultural life-environment (Murányi, 2005). Could that explain that prejudice is mainly typical for those young people whose cultural, family and living circumstances are in one way or another marginalized or characterized by some kind of social disadvantage? In a former study (Murányi-Szabó, 2007) we tried to answer this question with the help of the explanation based on the conception of prejudices introduced by Fuchs and Case (1989). According to Fuchs and Case “... prejudice is not an attitude, but a way of life” (1989, p. 302), i.e. embedded in the entire life situation. It can be connected to the concept of ritual density. High ritual density is a result of continuous interactions within unchanged group boundaries, characterized by shared experiences and restricted linguistic codes. Most interactions in closed groups are performed according to similar patterns. Low ritual density is a result of interactions within open group boundaries. High ritual density is a more presuming prejudice, while low ritual density is a resulting tolerance. The variety of group memberships and the
1 Postal Address: H-4010 Debrecen, Egyetem tér 1. Hungary, Email Address: muranyi@chello.hu
differences between group norms encourage group members to choose alternative interpretations or participate in interactions according to various |”rites” (Fuchs-Case, 1989).
The data of the previous study were collected in a survey carried out in 2005 with five thousand respondents, all high-school students from four Hungarian counties and the capital (Budapest). In the study the attempt was made to find an empirical explanation along Fuchs’s and Case’s conception about why socially disadvantaged students attending lower prestige high schools are more prejudiced than young people belonging to other social groups. We noticed that the questionnaire was suitable for the examination of connections between ritual density and prejudice. One group of variables was related to prejudice (acceptance and rejection of members of peer minority groups, the importance of problems relating to minorities) and the other group of variables was related to lifestyle (media consumption, association activity, family communication, free time activities). We proved that the bias of students is manifested in rejection of their minority peers, as well as their standpoint regarding to the importance of minority issues as an organic part of their way of life, which depends on their social position. The differences in prejudices between the groups, characterized by different ritual density, show that basic norms and values are acquired by an individual being a member of different collectivities. The respective group membership is a central part of the overall socialization process, thus it is understood as a sequence of interactions.
In 2008 we had an opportunity to approach the question in the framework of an international comparative research. We tried to justify that Fuchs’s and Case’s conception is valid in different national contexts and different age-groups. For this reason the procedure (the same questionnaire, though adapted to national circumstances) was applied in our survey in order to validate the conception in three (Hungarian, Finnish, Russian) different cultural-political contexts on the one hand and also to use it as a reference model in determining the explanation of prejudice on the other hand.
In addition to the mentioned task we expanded the original (Hungarian high-school students’ survey, 2005) questionnaire with a new viewpoint. We wanted to examine the structure of attitudes organized around the notion of the nation and explore the relationship between national sentiments and attitudes towards minority groups. The model of H. Dekker and D. Malová (1995) stands out among the few empirical investigations which focused on nationalism as a political orientation. According to their approach national attitudes can be conceptualized as a set of attitudes towards one’s people and country, differing in strength and affect. Nationalism is merely one of the component attitudes of the set. Empirical research has shown that the component attitudes of the model (national feeling, national liking, national pride, national preference, national superiority and nationalism) are discrete sentiments organized into a cumulative hierarchy. The concept of nationalism, that is used in this paper was developed by Dekker (1996) and his colleagues. They argued that in the field of nationalism research the most important obstacles are the poorly defined concepts, and they showed that the concept of nationalism is used in the literature to cover four main categories, often in a rather confusing way. In some contexts nationalism means a political ideology or a political movement, in other contexts it indicates the process of nation building, and finally it stands for a particular political orientation of individuals. Focusing on the political orientation of individuals they pointed out that the concept of nationalism is frequently considered to be identical for a number of different national orientations (such as national consciousness or national feeling, national identity, loyalty to the nation, patriotism) and it is also used as an “umbrella concept” intermingling separate dimensions (such as belief in kinship or blood-tie, the desire for separation, the wish for pure or homogenous nations, ethnocentrism and so on).
Table 1: The structure of national attitudes
The attitudes are arranged into a cumulative hierarchy, that is, they indicate separate and hierarchically arranged stages of attitude development in the context of the nation. Each stage requires its fulfillment before the next can be developed that embeds all the lower levels. The model had been empirically tested and verified on student samples in the Netherlands, in Slovakia, in Hungary and in the Basque Autonomous Community in Spain (Kelemen, 1992; Dekker et al., 2003; Murányi, 2005). The results confirm both the existence of the hypothesized six attitudes and their structural relationships.
The aim of the present article is twofold. First, we set out to test the Dekker-Malova model and Fuchs’s and Case’s conception on different national contexts. The second aim is to reveal the structural relationships between the above-mentioned national attitudes of the model and attitudes towards minority groups. Considering the size and characteristics of the sample, our research is essentially a diagnostic-like pilot study. In the first part of the article, we briefly introduce some main characteristics of the countries according to prejudice, we outline the method and the indicators of the survey. The second part contains the data analysis.
Characteristics of prejudice in the three countries
Hungary
After the change of political system we can concisely approach the prejudice of the Hungarian society with results of sociological and social psychological research (Muranyi, 2005). Researchers apply a negative judgment to the concept of prejudice which is based on the majority-minority relation. This judgment is directed towards ethnic, deviant, national and strange out-groups. The research proves that the deviant groups and the Gypsies are the least sympathetic out-groups for the majority. During the research on the sample of adults the impact of socio-cultural factors was studied. The result of this research showed that education level and cultural background have a principal influence on the anti-Gypsy attitudes. There is a consensus about the direction of the education influence: higher education leads to less prejudice. In addition to the impact of social indicators, the territorial distribution of minorities is also an important analysis viewpoint (Enyedi-Erős, 1999; Enyedi et al., 2002).
In the nineties The Civic culture of Teenagers in Hungary was one of the most important researches among the young people (Szabó & Örkény, 1998). The empirical basis of the analysis comes from a representative survey which was carried out in 1996 among graduate year students in more than 100 secondary schools. The aim of this research was to explore what kind of emotions, recognition, stereotypes or attitudes they have towards the nation, nationhood and minorities. One of the questions was whether the students would have accepted or rejected another student as a peer in the same bench in the classroom. The range of options was as follows: Arabs, Gypsies, Romanians, Transylvanian Hungarians, Chinese, Russians, Slovaks, Germans and Jews. The respondents had to decide that from this repertoire of ethnic backgrounds which peer they would feel the least comfortable with. One third of the students would accept having a peer of one of the ethnic groups listed above sitting next to them. The proportions of ones who would not accept a peer of any of these ethnic groups sitting next to them was rather low.
Finland
Recently only one national study4 was concerned with prejudices of young people in Finland (Virrankoski,
2001). The main results of the study were: the proportion of those who had quite strong ethnic prejudices had risen in Finland during the 1990s from 15 per cent to 27 per cent of the respondents. The prejudices were more dominating in the schools where there were no immigrant students than in the schools where students had contacts with immigrant peers. Most girls and about 50 per cent of boys supported the idea that there should be more discussion about racism in schools during the lessons. 20 per cent of the boys and 4 per cent of the girls accepted the extreme nationalist and racist ideology of skinheads, who were a major anti-immigrant subculture among young Finns in the 1990s. 70 per cent of girls and about 50 per cent of boys totally disapproved of the skinhead ideology and actions.
In those studies (Jaakkola, 1999; 2009) which have investigated attitudes of Finns (whole population) towards immigrants, young people have not been studied separately. The studies reveal some age specific differences of attitudes among Finnish people older than 14 years old. The main results of these studies have been that generally the attitudes of Finns have become less prejudice oriented (instead they have become more tolerant). The higher the socioeconomic status of the respondents the more tolerant they are. The more a person has contacts with immigrants/ foreigners the more tolerant she/he is. There is a quite sharp division between tolerant and prejudiced young people, on one hand young men (15-29 years of age) are the least tolerant people in Finland. In addition, young women are also more prejudiced than the women of older cohorts. But on the other hand, the most tolerant people are the young people. Thus young people have more extreme opinions than older people. There was also remarkable difference between the attitudes of people living in urban and rural areas. Urban people were more tolerant than rural people. The ethnic hierarchy of minorities living in Finland was the following: most preferred immigrants are Estonians, then in order followed: Chinese, Polish, Russian, and Somali immigrants. The order has been the same during the last 20 years. Russians have been in previous studies as disliked as Somalis. In the last study Russians are more liked than Somalis but far below all other groups.
Russia
The relevance of studies regarding ethnic relations and discrimination as experienced by young people in modern Russia is undisputed. Some researchers highlight the necessity of investigating
xenophobia and prejudice formation especially in the context of the patriotism education program in Russia (Borusyak, 2004).
There have been several large scale sociological surveys, where young people were the object of study and which were aimed at investigation of everyday racism (Puuronen et al., 2007) and ethnic relations. The studies tend to concentrate on Moscow youth (Borusyak, 2004; Podrostky, 2007) the city with the highest hate crime rate in Russia (according to the data collected by the human rights agency SOVA in 2007). One significant comparative survey (Puuronen et al. 2007) examined everyday racism and discrimination in four Russian cities — Petrozavodsk, St. Petersburg, Kazan and Krasnoyarsk. Thus the results of the survey are valuable for grasping the attitudes of young people from economically and culturally diverse regions in Russia.
Since Russians are the ethnic majority in the Russian Federation one may think that it is most relevant to speak of prejudice as a lifeform in terms of prejudices of Russians against other ethnic groups. However, this is not so, as in Russia not all the Federal subjects have Russians as the ethnic majority (for instance the Republics of Tuwa, Dagestan, Tatarstan). And secondly, there is a strong level of prejudice on the level of local and non-local relations, which is best demonstrated by prejudice of the young Moscow residents against the newcomers from other regions - especially students (Borusyak, 2004).
One of the consequences of the disintegration of the Soviet Empire has been the growth of immigration from some of the former republics of the Soviet Union and neighboring countries (e.g. China). One of the side-processes of immigration to Russia is illegal immigration, which according to the rough estimates accounts for 4.5 million people annually (Krassinets et al., 2000). Therefore anti-immigrant issues are central in the ultranationalist rhetoric and are the issue for the political mobilization of the youth. It is evident, that the ultranationalist rhetoric is undergoing transformations. Dominant anti-Semitic discourse is becoming substituted by the anti-immigrant discourse, which has supporters both in the political organizations of the youth, supported by the government, and in the social movement organizations, which act as the anti-system political actors (such as the Movement Against Illegal Immigration, DPNI).
One area, which is highly relevant to the studies of prejudice as a lifeform is the role of the Internet. The studies on the use of the Internet by the various ultranationalist organizations and web-communities (Aitamurto, 2007; Rock, 2005; Zuev, forthcoming) demonstrate that the Internet is the channel of communication between the marginalized social movement organizations, the Russian New Right intellectuals, the ultranationalist Parliament deputies and the youth subcultures. The significance of Internet as an alternative channel for communication in Russia is tremendous because the space for the political activism of the groups, which instead of collaborating challenge the state, is diminishing (Lonkila 2008; forthcoming). Ultra-nationalism opposes the current leadership, political and social structure. It puts the opposition under constant pressure from the state and the only accessible channel of communication about preparation of upcoming meetings, rallies or marches is the Internet. The Internet has become the front stage of information struggle between the anti-immigrant and human rights organizations, as well as the place of the more extreme forms of communication between the extreme-right web community and anti-fascist web community.
Research methodology
cent of the sample. The gender representation was not balanced - the sample consisted of 80 per cent females and 20 per cent males. (Because of the non-representative sampling, we could not carry out examinations of statistical hypothesis between the three samples).
Indicators of prejudice
In this paper (and during the research) we use a minority definition, which is closest to the approach of Tajfel: „[minority is] a category of people... at the receiving end of certain attitudes and treatment from the »outside«” (Tajfel, 1981). We measured prejudice in three dimensions.
Prejudice (social distance) towards national-ethnic groups. One of the questions was whether students feel disturbed by students who are members of different national or ethnic groups. In Russia Gypsies are the most victimized ethnic group together with the Chechens (Zuev, 2007), so these two groups were excluded as the point was to find out the degree of acceptance/rejection of other groups and having these two groups would influence greatly the distribution of the responses. However we examined the same number of national and ethnic groups in the three different subsamples (Hungarian, Russian, Finnish) therefore we could compare the results.
Table 2: „ What would your opinion be if your university mate was a member of the following
groups?” (Should disturb answers, percentages)
I would be disturbed,
if he/she were… Hungarian Finnish Russian
Gypsy 30 12
-Romanian 11 2
-Jewish 8 1 9
Chinese 9 0 11
Serbian 7 1
-Congolese 6 2
-Arabic 4 7 10
Russian 4 5 1
Slovak 9 0
-German 2 0 7
Croatian 1 1
-Finnish 0 0 3
Minority living of boundaries 0 0
-Chuvash - - 11
Tatar - - 11
Azerbainaijan - - 26
Belorussian - - 4
Ukrainian - - 7
Armenian - - 14
African - - 4
Table 3: Average of prejudice towards national-ethnic groups in the sub-samples (How many groups disturbing an average)
Russian 1.18
Hungarian 0.91
Finnish 0.29
Total 0.78
Considering the prejudice towards national-ethnic groups Table 3 shows that the Finnish students seem to be least prejudiced, and in contrast, Russian students are the most prejudiced. (In spite of the fact that Gypsies and Chechens were excluded in the Russian research).
Acceptance of minority groups. The survey questionnaire contained four items related to majority attitudes towards the minority groups. The four items contained concerns with minority – without naming specific groups. For answering these questions, a four-point scale – ranging from 1 (not at all important) to 4 (very important) was used. First, we constructed 5 a one hundred
point scale (0: very important, 100: not at all) in each item and composed – using simple addition and averaging - a contracted variable with these four recoded variables (Cronbach’ s alpha for this scale was 0.824).
Table 4: Scale of the importance of juridical and moral aspects of acceptance of the minority groups
(0-100 scale: 0: very important, 100: not at all important, means)
„Are the followings issues important for you?” Mean of scale
protection of minorities 42
ethnic rights 40
accepting differences 22
fighting against racism 23
Mean of combined scale 32
All of the four problems (acceptance of difference, anti-racism, protection of minorities, minority rights) with values less than fifty points show that the four problems are rather important for the students. It is very interesting that the protection of minorities was less important than fighting against racism.
Table 5: Means of minority’s acceptance scale in the sub-samples
(0-100 scale, means)
Hungarian Finnish Russian
protection of minorities 44 28 54
ethnic rights 41 25 55
accepting differences 35 7 26
fighting against racism 29 16 26
Mean of combined scale 37 19 40
Moral acceptance of the minority groups is higher than juridical acceptance, a fact that holds particularly true amongst Russian respondents. The explanation to this may be rooted in the understanding of the law and rights in the Russian context. The law and legislature are still not seen as powerful tools of regulation of human action as the personal, informal action and attitude.
Acceptance of ethnic groups. Students were given four items and asked to tell whether they agreed or disagreed with the statements included. Like in the previous prejudice dimensions, we constructed a one hundred point scale (0: totally disagree, 100: totally agree) in each of the four items and prepared a composed index with four recoded variables (Cronbach’ s alpha for this scale was 0.643).
Table 6: Agreement with statements regarding ethnic groups
(0-100 scale, 0: totally disagree, 100: totally agree; means)
The rights of certain ethnic groups in our country should be limited. 30 All means are acceptable to protect the interests of one’s own ethnic group. 21 Marriages of people belonging to different ethnic groups are not acceptable because they
result in the degeneration of the nation. 15
True friendship is possible only with the people from the same ethnic group. 10
Table 7: Means of ethnic group’s acceptance scale in the sub-samples
(0-100 scale, means)
Russian 29
Hungarian 22
Finnish 7
Total 19
In this case similarly to considering the two previous types of prejudice the Finns proved to be the least prejudiced ones.
On account of the three prejudice dimensions to be comparable we standardized the three contacted variables (social distance, acceptance of minority groups and acceptance of ethnic groups). In the next part we will characterize the prejudice of young people by using a new variable which was composed by the addition and averaging of the standardized three variables.
Table 8: Means of standardized prejudice variables in the sub-samples
(means)
Prejudice towards national-ethnic
groups
Acceptance of minority
groups
Acceptance of ethnic groups
Combined prejudice
Russian 0.231 0.372 0.501 0.373
Hungarian 0.071 0.232 0.138 0.146
Finnish - 0.291 -0.584 -0.615 - 0.508
The means of the scores show that the three types of prejudice are greater than the average among Hungarians and Russians, while it is lower than the average among Finnish students.
Indicators of lifeform
connected to everyday interactions. They improve the possibility of communication, so probably they characterize low ritual density.
The first group of variables (watching television news, watching political-public television programs, reading newspaper) contributes to the recognition of dissimilarity from own social-cultural pattern.
We constructed three computed variables based on a similar logic. Since the examined media (television news, political-public television programs, newspaper) was different in the three countries,6 we made in each sub-sample a cluster analysis (quick-cluster) with answers to the
three questions („How often do you watch the following television news? How often do you watch the following political-public television programs? How often do you read the following newspapers?”).
If the respondent belonged to the “Frequent consuming” group (cluster), the value of the computed variable was 1. If the respondent belonged to the “Rare consuming” group the value of computed variable was 0. For answering the first two questions a four-point scale – ranging from 1 (never) to 4 (often) - was used. For answering the third question a five point scale – ranging from 1 (never) to 5 (each day) – was used.7
Russian respondents are characterized by the lowest media consumption related to politics and news. This suggests that lifestyles of the Russian youth and their peers in terms of information consumption and media influence are quite different. It may be assumed that post-soviet legacy still has repercussions on the lifestyle of young people from Russia. One could also attribute the low level of media consumption to the structure of the subsample which is dominated by female respondents, and measures in the survey are not fully expressing the media interests of the female population. One of the important points that should be made here is the control of the TV by the government and the practical absence of any plurality of voices on TV - this feature of TV makes the medium to be ignored. Newspapers are also not a popular form of media for the Russian youth, if the news are watched they would be watched on the Web.
The second group of variables contains association activity and church attendance. The association activity can serve as source of different world concepts and world interpretations. The primary socialization is very important, therefore we have also taken into account the fact of the family member’s association activities.8
Considering the frequency distribution of the answers, we grouped answers given to the question (“How often do you attend church or a religious event?”) according to the following: rarely (never, only in case of family events); often (only in occasion of notable ecclesiastical holidays;
6 Television news: 1. In the Hungarian survey: M1/M2, Duna TV, Hír TV, TV2, RTL Klub, Helyi TV, BBC, Sky Europe, CNN, TV5. 2. In the Finnish survey: TV1, TV2, MTV3, Nelonen, FST5, PaikallisTV, BBC, Sky Europe, CNN, TV5. 3. In the Russian survey:
ервый, , , фонтово -9, К-6, Культура, 7канал, и- и- иЕвроньюс(Euronews), овостив нтернете.
4. In the Irish survey: RTE1, RTE2, BBC, TV3, TG4, SKY, CNN.
Political-public television programs: 1. In the Hungarian survey: Este, A szólás szabadsága, Kérdések órája, Politikai barométer, Jó estét, Magyarország, Aktív, Fókuszban, Heti hetes. 2. In the Finnish survey: Ykkösen aamutv, Huomenta Suomi, A-studio, Inhimillinen tekijä Priima, Arto Nyberg, 45 minuuttia, Spotlight. 3. In the Russian survey: ремена, Кбарьеру! остскриптум, еальная
политика, оментистины, орядокслов, Человеки акон, еделя.
Newspaper: 1. In the Hungarian survey: Blikk, Magyar Hírlap, Magyar Nemzet, Metro újság, Népszabadság, Népszava, helyi, megyei napilap. In the Finnish survey: Helsingin Sanomat, Savon Sanomat, Karjalainen, Kansan Uutiset, Nykypäivä, Vihreä lanka, Uutispäivä Demari, Suomenmaa. 3. In the Russian survey: звестия, оссийская азета, КоммерсантЪ., ечернийКрасноярск,
осковскийКомсомолец, ргументыиФакты, Комсомольская равда.
7 h e result of cluster-analysis (quick-cluster) according to
- watching television news (percentages): Hungarian (often: 60, rarely:40); Finnish (often: 43, rarely: 57); Russian (often: 38, rarely:62). - watching political-public television programs (percentages): Hungarian (often: 47, rarely: 53); Finnish (often: 37, rarely: 63); Russian (often: 27, rarely: 74).
time by time, each year several times; several times on a monthly basis; once a week or several times a week).9
At the same time, one can say that entrance to religious life plays greater role in the life of the Russian youth and this can be attributed to the influence of the church in the Russian internal politics. Church attendance is higher which is also characteristic of the post-soviet youth. However, social solidarity or group boundaries are no longer based on the common religious practice (Fuchs and Case p.308). The level of association activity is low, and it can be explained by the post-soviet tendency of to be less involved in any formal, official associations or clubs, but instead have informal, subcultural grounds for solidarity.
The last group of variables contains two types of communication: within the family and with friends. They also contribute to plural world interpretations. The same thirty topics10 were in the
questionnaires of the five data surveys, so we were able to make two similarly computed variables with answers to both questions (“How often do you talk about the following topics with your tighter family (who you live with)?”, ”How do you talk about the following topics with your friends?”) Firstly we made separate cluster analyses (quick-cluster) with answers to the two questions. According to the logic used earlier we made combined variables using the results of cluster analysis: the value of the variable is 1 (or 0) if the respondent belongs to the “often” (or “rarely”) cluster.11 (The
appendix contains the detailed results of the cluster–analyses).
Results on which communication type is more prevalent show that Russian respondents tend to attach more importance to communication with friends rather than with family. Thus influence of family on the plural world interpretation for the Russian youth may be not as great as that of the friends.
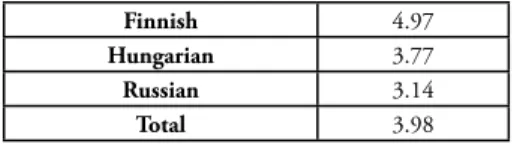
Finally, we made the lifeform variable with a simple addition of nine variables which characterize the lifeform based on three dimensions (media consumption, association activity and communication). The values of combined lifeform variable are between 0 – 9 points, the mean score of the scale for the whole sample is: 3.98.
Table 9: Means of lifeform variable in the sub-samples
(means)
Finnish 4.97
Hungarian 3.77
Russian 3.14
Total 3.98
The averages of the scores show that the lifeform is greater than the average among Finns, while it is lower than the average among Hungarians and Russians. In consideration of Fuch’s and Case’s conception the bigger average of lifeform indicates the lower level of ritual density. (The bigger media consumption, association activity and communication means - a lower ritual density.) For this we can say that the Finnish students are characterized by low ritual density and the Russian
9 Church attendance in the sub-samples (percentages). Hungarian (often: 38, rarely: 62); Finnish (often: 29, rarely: 71); Russian (often: 34, rarely: 66).
10 h e topics: operation of the authorities; relationship with the other sex; taxation; domestic-policy life; stars, famous men; crime; civil associations; home husbandry, money; health, illness, hygienics; ethnic minorities; ideological questions; school life; school accomplishment; environmental pollution; foreign policy events; hungarian/ i nnish/ russian ethnicity; culture of dif erent countries; artistic creations; a holiday or a trip; dressing, appearance; political parties; politicians; lifestyle of relatives; sport; poverty; musical taste, musicians, groups; science, technique; television programmes; religion; parents’ job, job tensions.
students are described by a rather high ritual density while the level of Hungarian students is approximately on the average.
Structural model of national attitudes
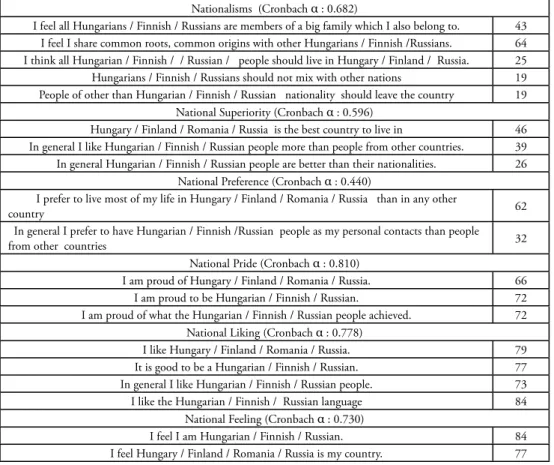
In our study the nationalism scale was constructed by selecting and translating 19 relevant items from the 1995 Dutch survey and also from the questionnaire used in Slovakia in 1995/1996, and in Hungary. The survey confirmed that the scale was suitable for our total sample as well – we had results as in the previous studies. The whole national attitude scale proved to be highly reliable (Cronbach - alpha = 0.894 for all nineteen items) as well as most of the subscales, yielding Cronbach - alphas ranging from 0.826 to 0.556 with the exception of the National Preference scale with a low alpha of 0.440.
Table 10: The scale of national attitudes
(0-100 scale, 0: totally disagree, 100: totally agree, means)
Nationalisms (Cronbach α : 0.682)
I feel all Hungarians / Finnish / Russians are members of a big family which I also belong to. 43 I feel I share common roots, common origins with other Hungarians / Finnish /Russians. 64 I think all Hungarian / Finnish / / Russian / people should live in Hungary / Finland / Russia. 25 Hungarians / Finnish / Russians should not mix with other nations 19 People of other than Hungarian / Finnish / Russian nationality should leave the country 19
National Superiority (Cronbach α : 0.596)
Hungary / Finland / Romania / Russia is the best country to live in 46 In general I like Hungarian / Finnish / Russian people more than people from other countries. 39 In general Hungarian / Finnish / Russian people are better than their nationalities. 26
National Preference (Cronbach α : 0.440)
I prefer to live most of my life in Hungary / Finland / Romania / Russia than in any other
country 62
In general I prefer to have Hungarian / Finnish /Russian people as my personal contacts than people
from other countries 32
National Pride (Cronbach α : 0.810)
I am proud of Hungary / Finland / Romania / Russia. 66
I am proud to be Hungarian / Finnish / Russian. 72
I am proud of what the Hungarian / Finnish / Russian people achieved. 72 National Liking (Cronbach α : 0.778)
I like Hungary / Finland / Romania / Russia. 79
It is good to be a Hungarian / Finnish / Russian. 77
In general I like Hungarian / Finnish / Russian people. 73
I like the Hungarian / Finnish / Russian language 84
National Feeling (Cronbach α : 0.730)
I feel I am Hungarian / Finnish / Russian. 84
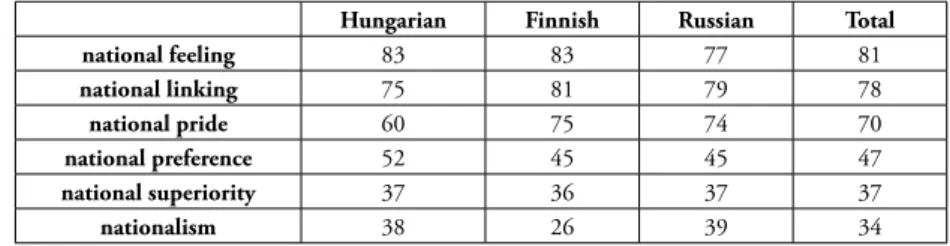
Table 11: Support for the six attitudes in the sub-samples (0-100 scale, 0: totally disagree, 100: totally agree, means)
Hungarian Finnish Russian Total
national feeling 83 83 77 81
national linking 75 81 79 78
national pride 60 75 74 70
national preference 52 45 45 47
national superiority 37 36 37 37
nationalism 38 26 39 34
These results - proving that the model works in several countries and languages regardless of the fact that various items have essentially different connotations in the different national contexts - further contribute to the strength and the validity of the model. The particular patterns of support shown in the various items received in different countries are comparable but significant local variances do show up.
The results show indeed a gradual decline of support for the attitudes positioned higher in the hierarchy except for the first two levels - national feeling and national linking - where the distance is smaller.
We investigated the correlations between the subscales. The correlations were in the moderate range, varying from 0.351 to 0.811, only none of them exceeding 0.800, which justified the separate but interrelated treatment of the subscales.
Table 12: Correlation coefficient matrix of the national attitude subscales
national feeling
national liking
national pride
national preference
national superiority national liking 0.735
national pride 0.636 0.818
national preference 0.455 0.343 0.345
national superiority 0.400 0.408 0.430 0.592
nationalism 0.370 0.384 0.374 0.486 0.639
Table 13: The mean of dissimilarity matrix of the national attitude subscales (means)
national feeling
national liking
national pride
national preference
national superiority national liking 2.6
national pride 10.9 8.3
national preference 33.5 30.8 22.5
national superiority 44.0 41.3 33.0 10.4
nationalism 46.7 44.1 35.7 13.1 2.6
To sum up, we have successfully validated the Dekker-Malova model of nationalism on an international sample. Despite the differences in the amount of support expressed in relation to some of the items of the scale in different countries the model in itself proved to be applicable on a sample of five countries, exhibiting similar structural characteristics as those formulated in the original theory.
The relation between prejudice and ritual density
Finally, we will examine the relationship between prejudice and ritual density. We will be able to justify empirically the Fuchs and Case theory, if ritual density separating groups characterizes significantly different intensities of prejudice.
In the first step we constructed a variable of two values. One of the values of the new variable is equal to 1 (if ritual density combined ranging from 0 to 2) and the other value is equal to 2 (if combined ritual density ranging from 7 to 9). So we can describe the complete sample with two dissimilar (low and high) ritual density groups.
Table 14: The prejudice of groups according to ritual density
(means of standardized variables)
Combined prejudice
Prejudice towards national-ethnic
groups
Acceptance of minority
groups
Acceptance of ethnic groups
Low ritual density group 0.091 0.051 0.146 0.084
High ritual density group - 0.148 - 0.174 - 0.213 - 0.147
The score averages of prejudice variables verify our expectation: the degree of prejudice is the smallest in the low ritual density group, while it is the largest in the high ritual density group. It is true that the difference is significant in the case of contracted prejudice, but the tendency is also evident at the other three variables.
Table 15: The prejudice of groups according to ritual density in the sub-samples (means of standardized variables)
Hungarian Finnish Russian Low ritual density group 0.078 -0.518 0.411
High ritual density group 0.296 -0.481 0.224
We presume that it is an interesting question to consider what the relationship between national attitudes and prejudice is. The correlation coefficients indicate that the whole of the nationalism subscale has a positive relationship with prejudice. The first three stages – from national feeling to national pride – have low relationship with prejudice while the top three levels – from national preference to nationalism – show highly positive correlations. It is valid to the complete sample and also to the sub-samples: prejudice grows with the increase of the national attitude.
Table 16: The correlation between national attitudes and (combined) prejudice
(Pearson - correlation coefficients)
Hungarian Finnish Russian Total national feeling 0.145 0.169 0.022 0.044
national linking 0.137 0.069 0.001 0.024
national pride 0.168 0.213 0.084 0.072
national preference 0.358 0.298 0.208 0.261
national superiority 0.485 0.413 0.416 0.387
Nationalism 0.624 0.361 0.433 0.564
In a wider context this study also raises the question - far beyond the scope of the present work - whether we can postulate national affiliation or national identity which is neutral in affect and is unrelated to prejudices towards minorities.
Conclusion
References
1. Aitamurto, K. (2007). Conceptualizations of fascism and anti-fascism on Rodnoverie Internet forums. In M. Vanhalla-Aniszewski & L. Siilin (Eds.), Voices and Values of Young People – representations in Russian Media. Aleksanteri Series 6. Helsinki University.
2. Borusyak L. (2004) Patriotism as xenophobia. Vestnik Obshestvennogo mnenia, 6 (74).
3. Dekker, H., & Malová, D. (1995). The concept of nationalism. In M. Cross (Ed.), Nationalism, ethnic conflict and conceptions of citizenship and democracy in Western and Eastern Europe. Volume 1: Theories and concepts (pp. 15-56).Utrecht University, European Research Center on Migration and Ethnic Relations.
4. Dekker, H., & Malova, M. (1997). Nationalism and its explanations. Paper presented at the first Dutch-Hungarian Conference on Interethnic Relations. Wassenaar: NIAS.
5. Dekker, H., Malová, D., and Theulings, R. (1996). What makes a Slovak a nationalist? A case study. In Farnen, R.F., Dekker, H., Meyenberg, R. and German, D.B. (Eds.), Democracy, socialization and conflicting loyalties in East and West. Cross-national and comparative perspectives (pp. 139-164).New York: St. Martin’s.
6. Dekker, H., Malová, D., & Hoogendoorn, S. (2003). Nationalism and Its Explanations. Political Psychology, 24(2), pp. 345-376.
7. Enyedi, Zs., & Erős, F. (Eds.). Authoritarianism and prejudice. Central European
perspectives. Budapest: Osiris.
8. Enyedi, Zs., Erős, F., & Fábián, Z. (2002). Authoritarianism and prejudice in
present-day Hungary. In K. Phalet & A. Örkény (Eds.): Ethnic minorities and inter-ethnic
relations in context: A Dutch-Hungarian comparison (pp. 201-216). Ashgate: Aldershot.
9. Fabian, Z., Enyedi, Zs., & Sik, E. (2004). Is Prejudice Growing in Hungary? In: T. Kolosi, I. Gy. Tóth, & Gy. Vukovich, (Eds.), Social Report 2004 (pp. 363-385). Budapest: TÁRKI.
10. Fuchs, S., & Case, C. (1989). Prejudice as Lifeform, Sociological Inquiry, 59(3), pp. 301-317.
11. Jaakkola, M. (1999). Maahanmuutto ja etniset asenteet. Suomalaisten suhtautuminen maahanmuuttajiin 1987-1999 [Immigration and Ethnic Attitudes. The attitudes of
Finns towards immigrants 1987-1999.]Helsinki: Työministeriö.
12. Jaakkola, M. (2009): Maahanmuuttajat suomalaisten näkökulmasta. Asennemuutokset 1987-2007. [Immigrants from the Point of View of Finns. Changes of Attitudes 1987-2007].
13. Kelemen, Á. (1992). Nemzeti érzelmek és a kisebbségek iránti attitűdök a mai Magyarországon. [National sentiments and attitudes towards minorities in the present Hungary]. Szociológiai Szemle, 2, pp. 77-101.
15. McGreil, M. (1996). Prejudice in Ireland revisited. Based on a National Survey of Intergroup Attitudes in the Republic of Ireland. Dublin, Survey and Research Unit, St Patrick’s College
16. Murányi, I. (2005). Identitás és előítélet [Identity and prejudice]. Budapest: ÚMK.
17. Murányi, I., & Szabó, I. (2007). Középiskolások előítéletességének egy lehetséges magyarázata: az életforma. [Lifestyle, as one possible explanation for high-school students’ prejudices]. Educatio, 16(1), pp. 38-49.
18. Puuronen V., Safin R., Salagajev A., Sotkasiira T. & Turijanski I. (2007): Venalaisten nuorten rasismi. Finnish Review of East European Studies, 4, pp. 3-13.
19. Rock, S. (2004). Racism and Xenophobia in Virtual Russia. In: Walden, R. (Ed.), Racism and Human Rights (pp. 101-124). Leiden: Martinus Nijhoff Publisher.
20. Szabó, I., & Örkény, A. (1998). Tizenévesek állampolgári kultúrája [Civic culture of Teenagers]. Budapest: Minoritás Alapítvány.
21. Tajfel, H. (1981). Human groups and social categories. Cambridge, London, New York: Cambridge University Press.
22. Virrankoski, O. (2001): Maa kallis isien. Tutkimus peruskoulun päättävien oppilaiden isänmaallisuudesta, suvaitsevaisuudesta ja etnisistä ennakkoluuloista [Beloved Country of Forefathers. A study of patriotism, tolerance and ethnic prejudices of last year students of compulsory schools]. Turku: Kirja-Aurora.
23. Zuev, D. (forthcoming) Russian ultranationalist movement in the Internet.