RESEARCH ARTICLE
Aberrant Gene Expression in Humans
Yong Zeng1,2☯, Gang Wang2☯, Ence Yang2, Guoli Ji1,3, Candice L. Brinkmeyer-Langford2, James J. Cai2,4*
1Department of Automation, Xiamen University, Xiamen, Fujian, China,2Department of Veterinary Integrative Biosciences, Texas A&M University, College Station, Texas, United States of America
3Innovation Center for Cell Biology, Xiamen University, Xiamen, Fujian, China,4Interdisciplinary Program in Genetics, Texas A&M University, College Station, Texas, United States of America
☯These authors contributed equally to this work. *jcai@tamu.edu
Abstract
Gene expression as an intermediate molecular phenotype has been a focus of research in-terest. In particular, studies of expression quantitative trait loci (eQTL) have offered promise for understanding gene regulation through the discovery of genetic variants that explain var-iation in gene expression levels. Existing eQTL methods are designed for assessing the ef-fects of common variants, but not rare variants. Here, we address the problem by
establishing a novel analytical framework for evaluating the effects of rare or private variants on gene expression. Our method starts from the identification of outlier individuals that show markedly different gene expression from the majority of a population, and then reveals the contributions of private SNPs to the aberrant gene expression in these outliers. Using population-scale mRNA sequencing data, we identify outlier individuals using a multivariate approach. We find that outlier individuals are more readily detected with respect to gene sets that include genes involved in cellular regulation and signal transduction, and less likely to be detected with respect to the gene sets with genes involved in metabolic pathways and other fundamental molecular functions. Analysis of polymorphic data suggests that private SNPs of outlier individuals are enriched in the enhancer and promoter regions of corre-sponding aberrantly-expressed genes, suggesting a specific regulatory role of private SNPs, while the commonly-occurring regulatory genetic variants (i.e., eQTL SNPs) show lit-tle evidence of involvement. Additional data suggest that non-genetic factors may also un-derlie aberrant gene expression. Taken together, our findings advance a novel viewpoint relevant to situations wherein common eQTLs fail to predict gene expression when herita-ble, rare inter-individual variation exists. The analytical framework we describe, taking into consideration the reality of differential phenotypic robustness, may be valuable for investi-gating complex traits and conditions.
Author Summary
The uniqueness of individuals is due to differences in the combination of genetic, epigenet-ic and environmental determinants. Understanding the genetepigenet-ic basis of phenotypepigenet-ic
PLOS Genetics | DOI:10.1371/journal.pgen.1004942 January 24, 2015 1 / 20
OPEN ACCESS
Citation:Zeng Y, Wang G, Yang E, Ji G, Brinkmeyer-Langford CL, Cai JJ (2015) Aberrant Gene Expression in Humans. PLoS Genet 11(1): e1004942. doi:10.1371/journal.pgen.1004942
Editor:Stephen B. Montgomery, Stanford University, UNITED STATES
Received:June 1, 2014
Accepted:December 9, 2014
Published:January 24, 2015
Copyright:© 2015 Zeng et al. This is an open access article distributed under the terms of the Creative Commons Attribution License, which permits unrestricted use, distribution, and reproduction in any medium, provided the original author and source are credited.
Data Availability Statement:All relevant data are within the paper and its Supporting Information files.
variation is a key objective in genetics. Gene expression has been considered as an interme-diate phenotype, and the association between gene expression and commonly-occurring genetic variants in the general population has been convincingly established. However, there are few methods to assess the impact of rare genetic variants, such as private SNPs, on gene expression. Here we describe a systematic approach, based on the theory of multi-variate outlier detection, to identify individuals that show unusual or aberrant gene expres-sion, relative the rest of the study cohort. Through characterizing detected outliers and corresponding gene sets, we are able to identify which gene sets tend to be aberrantly ex-pressed and which individuals show deviant gene expression within a population. One of our major findings is that private SNPs may contribute to aberrant expression in outlier individuals. These private SNPs are more frequently located in the enhancer and promoter regions of genes that are aberrantly expressed, suggesting a possible regulatory function of these SNPs. Overall, our results provide new insight into the determinants of inter-individ-ual variation, which have not been evaluated by large population-level cohort studies.
Introduction
The advent of high-throughput genotyping and sequencing technologies enables a comprehen-sive characterization of the genomic and transcriptomic landscapes of each individual.
Deci-phering the massive data points associated with individuals presents a major challenge [1,2].
Over the last couple of years, eQTL analyses have provided in-depth insights into the effect of
genetic variation on regulating gene expression [3–6]. More recently, research has also focused
on the contribution of genetic variation on the variance of gene expression [7–9].
The analytical frameworks adopted by most eQTL studies have historically been based on population-level test statistics, which are powerful for establishing associations between com-monly-occurring genetic variations and gene expression. However, few frameworks or statistics are available for assessing the impacts of rare genetic variants to gene expression (except, for
example, [10]). The problem is further exacerbated by the fact that individual gene expression
is a function of both genetic and non-genetic (such as epigenetic and environmental) factors, as well as their combined action. Our failure to detect the effects of rare variants with large ef-fects in biological samples, along with the inherent difficulty in dissecting the complex factors influencing gene expression will hinder efforts to define and prioritize relevant variants and impede the development of improved personalized diagnostic and therapeutic options.
Here, we envision an alternative approach based on the theory of multivariate outliers to ad-dress these technical challenges. More specifically, we measure how any two individuals differ in their expression profiles and quantify these differences with respect to a set of genes between individuals. Based on the expression differences, we detect outlier individuals whose expression profiles are so divergent from those of others in the population that the divergence cannot be explained by random sampling variation alone. Many methods of outlier detection have been developed. The most commonly used of these methods, such as those based on the estimation of the location and scatter of the data points or the quantiles of the data, are more applicable to univariate than multivariate settings. In practice, however, phenotypic traits are associated with changes of multiple genes in biological pathways and molecular networks, more often than single gene alterations. Reliably identifying outliers in such a multivariate setting is a
chal-lenging problem—unlike the simpler case of univariate outlier detection, simple graphical
diag-nostic tools like the boxplot often lack statistical power when the analysis of more than one
dimension is attempted [11].
Aberrant Gene Expression in Humans
PLOS Genetics | DOI:10.1371/journal.pgen.1004942 January 24, 2015 2 / 20
of Higher Education of China (Nos. 20120121120038 and 20130121130004), and the Fundamental Research Funds for the Central Universities in China (Xiamen University: Nos. 2013121025, 201412G009, and CBX2014007). The TwinUK study was funded by the Wellcome Trust; European Community’s Seventh Framework Programme (FP7/2007–2013). The study also received support from the National Institute for Health Research (NIHR) Clinical Research Facility at Guy’s & St Thomas’NHS Foundation Trust and NIHR Biomedical Research Centre based at Guy’s and St Thomas’NHS Foundation Trust and King’s College London. SNP Genotyping was performed by The Wellcome Trust Sanger Institute and National Eye Institute via NIH/CIDR. The funders had no role in study design, data collection and analysis, decision to publish, or preparation of the manuscript.
To this end, we adapted the multivariate outlier method that allows simultaneous evaluation of expression data with respect to many dimensions derived from multiple genes. With this
method, even though there is no natural ordering of multivariate data on which“extremeness”
of an observation can be ascertained, outliers showing markedly different data profile can be detected. Using a framework based on this approach, we specifically address the following re-search questions: Are there any differences between the functional properties of genes tending to (or tending not to) be aberrantly expressed? Is aberrant expression population-specific? What are the roles of genetic and non-genetic factors in aberrant expression? Do common or rare genetic variants contribute to aberrant expression? Our overall results clearly demonstrate that outliers, while often considered as error or noise, do carry important biologically-relevant information. Thus, the careful characterization of the genetic bases underlying the markedly different expression profiles of outlier samples is both worthwhile and necessary. Accurate de-scription of inter-individual expression differences requires the incorporation of the effects of both common and rare regulatory genetic variants.
Results
Study overview
The main results of our study comprise three parts. The first part concerns the identification of sets of functionally related genes whose expression discrepancies among individuals are signifi-cantly greater (or smaller) than those of random gene sets. The second part concerns the iden-tification of outlier individuals whose expression profiles with respect to gene sets are
significantly divergent from those of others in the population. The third part concerns the un-covered evidence that private SNPs contribute to aberrant expression in outlier individuals.
Data analysis in the first two parts relied on a metric of statistical distance that can quantify the dissimilarities between individuals in the expression levels of gene sets, rather than single
gene. To this purpose, we adaptedMahalanobis distance(MD), a multivariate metric that can
be used to measure the dissimilarity between two vectors [12]. Key features of MD are
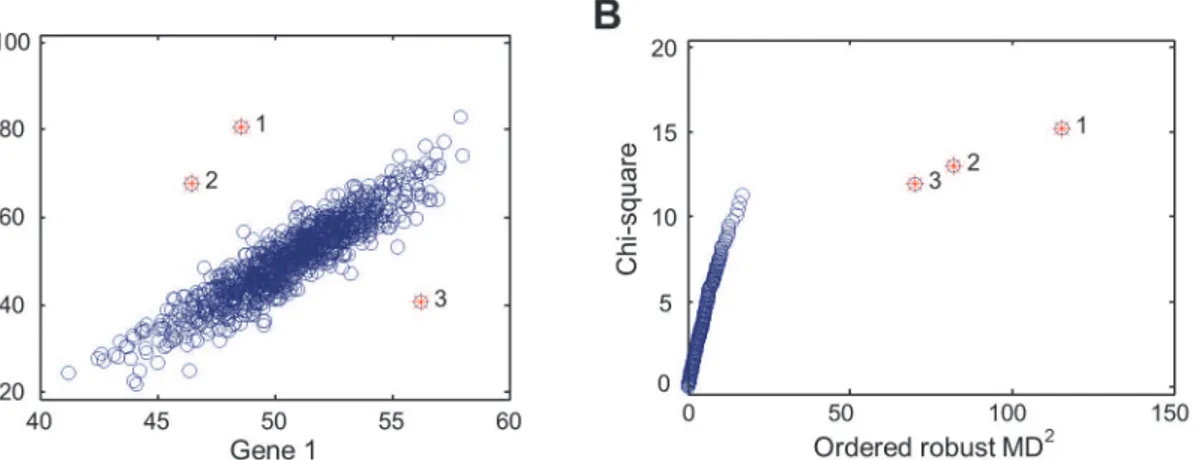
illustrat-ed inFig. 1, which shows a hypothetical example of MD, compared to the simple Euclidean
dis-tance. Here, the expression levels of two genes are correlated and the Euclidean distance is not an appropriate measure of distance between data points (or individuals). MD, on the other hand, accounts for the correlation through estimating the covariance matrix from the observa-tions, making MD a more appropriate distance statistic. With a given gene set (e.g., the two
genes of the hypothetical example), we can calculate MDiforNindividuals under
consider-ation (i= 1 toN). Each MDiis the multivariate distance from the individualito the population
mean, with the correlation between expression profiles of individuals captured by the
inter-in-dividual expression covariance. InFig. 1A, the top three data points with largest MDiare
la-beled with 1, 2, and 3, while the Euclidean distances from these data points to the population
mean are not the largest. With MDiof each individual, we can calculate thesum of squared
MDi(SSMD). SSMD summarizes the overall distribution of MDiacross individuals for the
gene set. The squaring operation puts more weight on larger MDivalues of outlier individuals.
Gene sets with larger SSMD are more likely to contain genes that are aberrantly expressed by outlier individuals. Thus, comparing SSMD values of gene sets, we can identify sets of genes that tend to (or tend not to be) aberrantly expressed (i.e., Part 1 of the main results).
The outlier individuals can be identified with ordered MDi. To do so, we used the tool for
multivariate outlier recognition, chi-square plot [13]. As seen inFig. 1B, the three data points
with the largest MDiare recognized as outliers. These data points, as shown inFig. 1A, are the
most remote observations with the largest MDito the population mean. None of the three data
points would otherwise be identified as outliers by using Euclidean distance. More important, Aberrant Gene Expression in Humans
none of them would otherwise be identified as outliers if we used any univariate approach. This is because that, when the two genes are considered separately, the expression levels of
ei-ther gene in the three individuals are in the“normal”range. Finally the purpose of identifying
outlier individuals is to study the genetic basis of aberrant expression of genes in outliers. That is to say, once the outlier individuals are identified, the genetic variation associated with outlier individuals can be further analyzed to see what kinds of genetic variation contribute to aberrant expression (i.e., Part 2 of the main results).
Gene sets (L-SSMD) that tend to be aberrantly expressed
We started by identifying gene sets that are more likely to be aberrantly expressed. We obtained the expression data matrix of 10,231 protein-coding genes in 326 lymphoblastoid cell lines
(LCLs) of European descent (EUR) from the Geuvadis project RNA-seq study [3]. We used
SSMD to measure the total deviation of expression profiles from all individuals to the popula-tion mean for gene sets. We computed SSMD for all gene sets with fewer than 150 expressed
genes in the Molecular Signatures Database (MSigDB) [14] and the GWAS catalog [15].
We identified 31 MSigDB gene sets whose SSMD values were significantly larger than those of random control gene sets that contain the same number of genes randomly selected from all
expressed genes (Bonferroni correctedP<0.01, permutation test) (Table 1). These 31 gene
sets, containing 1,855 distinct genes that are more likely to be aberrantly expressed in defined
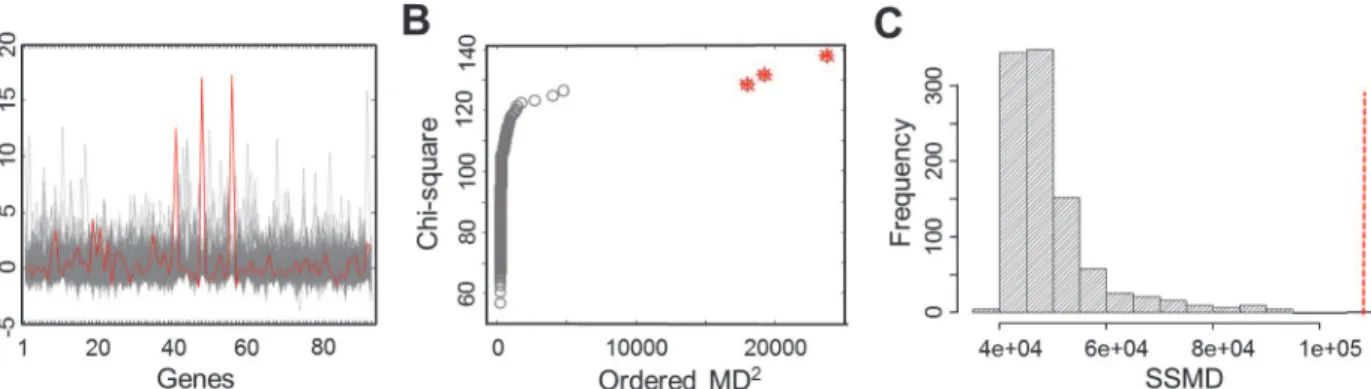
outlier individuals. We named these gene sets and genes L-SSMD gene sets and genes.Fig. 2
shows one of L-SSMD gene sets,G-protein coupled receptor activity, which contains 94 genes.
In addition, eight GWAS catalog gene sets showed relatively large SSMD (P<0.001,
permuta-tion test), though not significant following Bonferroni correcpermuta-tion. These sets included genes implicated in adverse responses to chemotherapy, conduct disorder, fasting insulin-related traits, metabolite levels, obesity, retinal vascular caliber, temperament, or thyroid hormone
lev-els (S1Table).
Outlier individuals in L-SSMD gene sets
To identify outlier individuals, we applied chi-square plot to examine MD values of all individ-uals with respect to each of the 31 L-SSMD gene sets. We identified 17 distinct outliers in total, 11 of which were found in more than one gene set, and almost all gene sets had more than one
Figure 1. MD-based multivariate outlier detection.(A) Scatter plot for the expression levels of two hypothetical genes. Three outliers indicated with red stars have the largest MD values to the population mean. (B) The chi-square plot showing the relative position and order of the three outlier data points, compared to those of non-outlier data points.
doi:10.1371/journal.pgen.1004942.g001
Aberrant Gene Expression in Humans
Table 1. Gene sets that tend to be aberrantly expressed in LCLs of European descent.
Gene set # of genes
C2: curated gene sets (Chemical and genetic perturbations, Reactome gene sets)
1. AIGNER_ZEB1_TARGETS Genes up-regulated in MDA-MB-231 cells (breast cancer) after knockdown of ZEB1 [GeneID = 6935] by RNAi
28 / 35
2. CAFFAREL_RESPONSE_TO_THC_8HR_3_UP Genes up-regulated in EVSA-T cells (breast cancer) treated with 3 micromolar THC (delta-9-tetrahydrocannabinol) [PubChem = 6610319] for 8 h.
5 / 5
3. GAUSSMANN_MLL_AF4_FUSION_TARGETS_E_UP Up-regulated genes from the set E (Fig. 5a): specific signature shared by cells expressing either MLL-AF4 [GeneID = 4297;4299] or AF4-MLL fusion proteins alone, and those expressing both fusion proteins.
76 / 97
4. HOFMANN_MYELODYSPLASTIC_SYNDROM_RISK_UP Genes up-regulated in bone marrow hematopoietic stem cells (HSC, CD34+ [GeneID = 947]) from patients with high risk of myelodysplastic syndrom (MDS) compared to the low risk patients.
19 / 24
5. IWANAGA_CARCINOGENESIS_BY_KRAS_UP Cluster 3: genes up-regulated in lung tissue samples from mice with tumor-bearing genotypes (activated KRAS [GeneID = 3845] alone or together with inactivated PTEN [GeneID = 5728]).
141 / 170
6. LEIN_CHOROID_PLEXUS_MARKERS Genes enriched in choroid plexus cells in the brain identified through correlation-based searches seeded with the choroid plexus cell-type specific gene expression patterns.
79 /103
7. LIEN_BREAST_CARCINOMA_METAPLASTIC_VS_DUCTAL_DN Genes down-regulated between two breast carcinoma subtypes: metaplastic (MCB) and ductal (DCB).
77 / 114
8. LIU_PROSTATE_CANCER_UP Genes up-regulated in prostate cancer samples. 79 / 96
9. MASRI_RESISTANCE_TO_TAMOXIFEN_AND_AROMATASE_INHIBITORS_UP Genes up-regulated in derivatives of MCF-7aro cells (breast cancer) that developed resistance to tamoxifen [PubChem = 5376] or inhibitors of aromatase (CYP19A1) [GeneID = 1588].
11 / 20
10. MIKKELSEN_MEF_ICP_WITH_H3K27ME3 Genes with intermediate-CpG-density promoters (ICP) bearing the tri-methylation mark at H3K27 (H3K27me3) in MEF cells (embryonic
fibroblasts).
115 / 206
11. PEPPER_CHRONIC_LYMPHOCYTIC_LEUKEMIA_DN Genes down-regulated in CD38+ [GeneID = 952] CLL (chronic lymphocytic leukemia) cells.
11 / 21
12. POTTI_ETOPOSIDE_SENSITIVITY Genes predicting sensitivity to etoposide [PubChem = 36462]. 37 / 43 13. QI_PLASMACYTOMA_DN Down-regulated genes that best disciminate plasmablastic plasmacytoma
from plasmacytic plasmacytoma tumors.
85 / 100
14. REACTOME_CGMP_EFFECTS Genes involved in cGMP effects 15 / 19
15. REACTOME_LIGAND_GATED_ION_CHANNEL_TRANSPORT Genes involved in Ligand-gated ion channel transport 6 / 21 16. VANHARANTA_UTERINE_FIBROID_UP Genes up-regulated in uterinefibroids vs normal myometrium samples. 39 / 45 17. WU_CELL_MIGRATION Genes associated with migration rate of 40 human bladder cancer cells. 143 / 184 C3: motif gene sets (microRNA targets)
18. TCCAGAG, MIR-518C Targets of MicroRNA TCCAGAG, MIR-518C 132 / 148
C4: computational gene sets (cancer modules, cancer gene neighborhoods)
19. MODULE_122 Genes in the cancer module 122 111 / 141
20. MODULE_215 Genes in the cancer module 215 3 / 15
21. MODULE_274 Genes in the cancer module 274 44 / 82
22. MORF_BCL2L11 Neighborhood of BCL2L11 123 / 188
23. MORF_MYL3 Neighborhood of MYL3 44 / 71
(Continued)
Table 1. (Continued)
Gene set # of genes
C5: GO gene sets (GO biological process, GO molecular function)
24. EXTRACELLULAR_LIGAND_GATED_ION_CHANNEL_ACTIVITY Genes annotated by the GO term GO:0005230. Catalysis of the
transmembrane transfer of an ion by a channel that opens when a specific extracellular ligand has been bound by the channel complex or one of its constituent parts.
14 / 22
25. G_PROTEIN_COUPLED_RECEPTOR_ACTIVITY Genes annotated by the GO term GO:0004930. A receptor that binds an extracellular ligand and transmits the signal to a heterotrimeric G-protein complex. These receptors are characteristically seven-transmembrane receptors and are made up of hetero- or homodimers.
94 / 191
26. TRANSMISSION_OF_NERVE_IMPULSE Genes annotated by the GO term GO:0019226. The sequential electrochemical polarization and depolarization that travels across the membrane of a nerve cell (neuron) in response to stimulation.
108 / 189
C6: oncogenic signatures
27. MEL18_DN.V1_DN Genes down-regulated in DAOY cells (medulloblastoma) upon knockdown of PCGF2 [GeneID = 7703] gene by RNAi.
104 / 148
C7: immunologic signatures
28. GSE19825_NAIVE_VS_DAY3_EFF_CD8_TCELL_UP Genes up-regulated in comparison of naive CD8 T cells versus effector CD8 T cells.
128 / 200
29. GSE19825_NAIVE_VS_IL2RALOW_DAY3_EFF_CD8_TCELL_UP Genes up-regulated in comparison of naive CD8 T cells versus effector CD8 IL2RA [GeneID = 3559] low T cells at.
133 / 200
30. GSE3982_NKCELL_VS_TH2_UP Genes up-regulated in comparison of NK cells versus Th2 cells. 136 / 200 31. GSE8515_CTRL_VS_IL6_4H_STIM_MAC_DN Genes down-regulated in comparison of untreated macrophages versus
those treated with IL6 [GeneID = 3569].
144 / 200
The names of gene sets and MSigDB subclasses are given. Number (#) of genes shows the number of genes included in SSMD computation and the number of genes in the original gene set.
doi:10.1371/journal.pgen.1004942.t001
Aberrant
Gene
Express
ion
in
Humans
PLOS
Genetic
s
|DOI:10.13
71/journal.
pgen.10049
42
January
24,
2015
6/2
outlier. The distributions of outliers in the gene sets are given inS1 Fig Fig. 2shows that three outliers were detected in the L-SSMD gene set, G-protein coupled receptor activity, using chi-square plot.
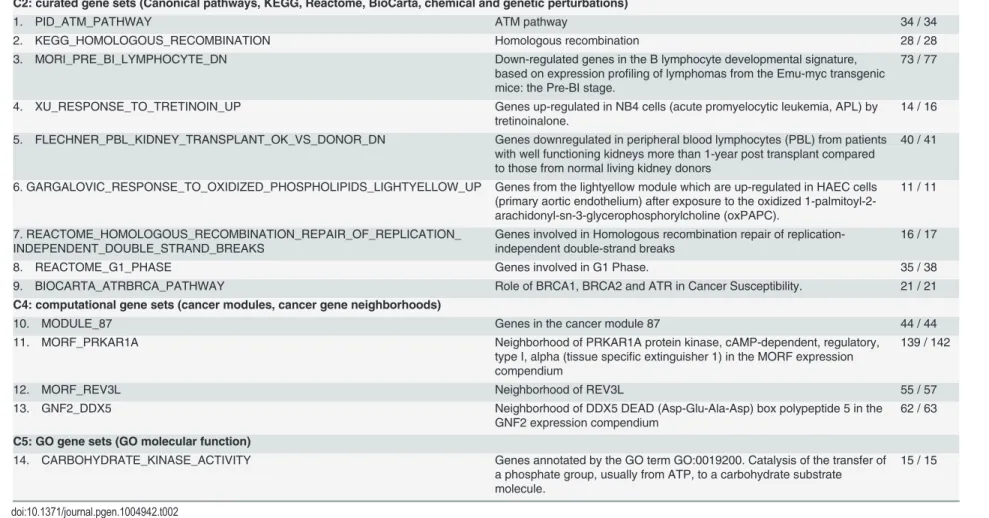
Gene sets (S-SSMD) that tend not to be aberrantly expressed
Fourteen gene sets with significantly smaller SSMD (S-SSMD) were identified (Bonferroni
cor-rectedP<0.01,Table 2). The S-SSMD genes (n= 534) in the 14 S-SSMD gene sets are involved
in homologous recombination repair of replication-independent double-strand breaks, cataly-sis of the transfer of a phosphate group to a carbohydrate substrate molecule, or cell cycle con-trol. GWAS gene sets implicated in alcohol dependence and metabolic syndrome showed
significantly smaller SSMD than random gene set (S1 Table).
Validation of L- and S-SSMD gene sets
We evaluated the power of SSMD as a statistic describing the propensity of a gene set for
aber-rant expression. We considered the influences of the sample size (n) and the size of gene set
(m). In cases where the SSMD are insensitive tonorm, the power would be maintained when
normchanges. However, we found that the power dropped substantially whenndropped
from 326 to 300 or whenmdropped from 37 to 31, suggesting that SSMD is sensitive to bothn
andm(Fig. 3A, B). This might be due to that only a small number of genes in the gene set
test-ed that were expresstest-ed aberrantly in few individuals, and the power analyses formandnwere
based on the sub-sampling of genes and individual samples, respectively (Materials and Methods).
Nevertheless, owning to the sensitivities, it was necessary to validate our results of identified
L- and S-SSMD gene sets, which were obtained using the Geuvadis LCL expression data [3].
We validated our results by taking into consideration three factors: (1) the robustness against the influence of data normalization methods, (2) the replicability against technical variability, and (3) the reproducibility against independent expression data of different tissues.
The“original”Geuvadis expression data we used to identify L- and S-SSMD gene sets had
been normalized by using the algorithm of probabilistic estimation of expression residuals
(PEER) [16,17]. We first showed that the PEER normalization algorithm did not change our
results. To do so, we downloaded the“raw”Geuvadis expression data quantified in reads per
Figure 2. Gene expression profiles and outlier detection in the gene set, G-protein coupled receptor activity.(A) The expression profiles of 326 EUR samples for 94 genes in the gene set. The expression profile of the outlier individual with the largest SSMD is outlined in red. (B) The chi-square plot showing three outliers, as highlighted with the star symbol. (C) The null distribution of SSMD established from 1,000 permutations of 94 randomly selected genes. The red vertical line indicates the observed value of SSMD computed for the original gene set.
doi:10.1371/journal.pgen.1004942.g002
Aberrant Gene Expression in Humans
Table 2. Gene sets that tend not to be aberrantly expressed in LCLs of European descent.
Gene set # of genes
C2: curated gene sets (Canonical pathways, KEGG, Reactome, BioCarta, chemical and genetic perturbations)
1. PID_ATM_PATHWAY ATM pathway 34 / 34
2. KEGG_HOMOLOGOUS_RECOMBINATION Homologous recombination 28 / 28
3. MORI_PRE_BI_LYMPHOCYTE_DN Down-regulated genes in the B lymphocyte developmental signature, based on expression profiling of lymphomas from the Emu-myc transgenic mice: the Pre-BI stage.
73 / 77
4. XU_RESPONSE_TO_TRETINOIN_UP Genes up-regulated in NB4 cells (acute promyelocytic leukemia, APL) by tretinoinalone.
14 / 16
5. FLECHNER_PBL_KIDNEY_TRANSPLANT_OK_VS_DONOR_DN Genes downregulated in peripheral blood lymphocytes (PBL) from patients with well functioning kidneys more than 1-year post transplant compared to those from normal living kidney donors
40 / 41
6. GARGALOVIC_RESPONSE_TO_OXIDIZED_PHOSPHOLIPIDS_LIGHTYELLOW_UP Genes from the lightyellow module which are up-regulated in HAEC cells (primary aortic endothelium) after exposure to the oxidized 1-palmitoyl-2-arachidonyl-sn-3-glycerophosphorylcholine (oxPAPC).
11 / 11
7. REACTOME_HOMOLOGOUS_RECOMBINATION_REPAIR_OF_REPLICATION_ INDEPENDENT_DOUBLE_STRAND_BREAKS
Genes involved in Homologous recombination repair of replication-independent double-strand breaks
16 / 17
8. REACTOME_G1_PHASE Genes involved in G1 Phase. 35 / 38
9. BIOCARTA_ATRBRCA_PATHWAY Role of BRCA1, BRCA2 and ATR in Cancer Susceptibility. 21 / 21 C4: computational gene sets (cancer modules, cancer gene neighborhoods)
10. MODULE_87 Genes in the cancer module 87 44 / 44
11. MORF_PRKAR1A Neighborhood of PRKAR1A protein kinase, cAMP-dependent, regulatory, type I, alpha (tissue specific extinguisher 1) in the MORF expression compendium
139 / 142
12. MORF_REV3L Neighborhood of REV3L 55 / 57
13. GNF2_DDX5 Neighborhood of DDX5 DEAD (Asp-Glu-Ala-Asp) box polypeptide 5 in the GNF2 expression compendium
62 / 63
C5: GO gene sets (GO molecular function)
14. CARBOHYDRATE_KINASE_ACTIVITY Genes annotated by the GO term GO:0019200. Catalysis of the transfer of a phosphate group, usually from ATP, to a carbohydrate substrate molecule.
15 / 15
doi:10.1371/journal.pgen.1004942.t002
Aberrant
Gene
Express
ion
in
Humans
PLOS
Genetic
s
|DOI:10.13
71/journal.
pgen.10049
42
January
24,
2015
8/2
kilobase per million (RPKM) without PEER normalization. Two replicate sets of raw RPKM data were available for most of the Geuvadis samples. We therefore used each set independent-ly to test the significance of SSMD for L- and S-SSMD gene sets against random control sets. The procedure was similar to what we used for establishing the original L- and S-SSMD gene sets. Briefly, for each L- or S-SSMD gene set, we tested whether the SSMD computed with raw RPKM data tended to be larger or smaller than that of random gene sets. The observed SSMD was compared against SSMD values computed from 1,000 replicates of randomly selected genes and the significance was evaluated by examining how many times the observed SSMD was larger or smaller than random SSMD. As expected, with the original (PEER normalized) expression data, all 31 L-SSMD gene sets had a larger SSMD than sets of randomly selected genes, while all 14 S-SSMD gene sets had a smaller SSMD. The same patterns were recovered
with the raw RPKM expression data (Fig. 3C). These results indicated that our results for L- or
S-SSMD gene sets were robust against the normalization methods and the technical variability. In addition, we used independent gene expression data from tissues different from LCL to validate our results. We obtained the expression data of whole blood and muscle (in 156 and 138 samples, respectively) from the pilot study of the Genotype-Tissue Expression project
(GTEx) [18]. We re-computed SSMD using the GTEx data and conducted the same validation
tests. With GTEx data, the frequency of observed SSMD greater than random SSMD was sig-nificantly higher for L-SSMD gene sets than S-SSMD gene sets (Kolmogorov-Smirnov [K-S]
test,P= 1.02e-5 and 9.9e-4, for whole blood and muscle, respectively,Fig. 3C). These results
suggested that gene sets tending to have larger observed SSMD in LCL were more likely to have larger SSMD in the other two tested tissues, or vice versa. The consistency in the direction of SSMD patterns validates the biological significance of L- and S-SSMD gene sets.
Differences in aberrant expression between Europeans and Africans
Next we examined which gene sets show strong population-specific SSMD. For a given gene
set, we first computed MDiwith the gene expression data for all 402 samples of both European
(EUR,n= 326) and African (AFR,n= 76) ancestries. We then use these MDito compute
SSMDEURandSSMDAFRfor EUR and AFR samples, respectively, and calculated the difference
in SSMD between them:diffSSMDEUR-YRI=SSMDEUR-SSMDAFR. To assess the significance,
we computeddiffSSMDrandby randomly assigning samples without regard to their identities of
original populations. For each gene set, we computed 1,000 permutations ofdiffSSMDrandto
Figure 3. Power of SSMD test and validation of significant L- and S-SSMD gene sets.(A) The change of power as a function of sample size. (B) The change of power as a function of the size of a gene set. (C) Validation of significant L- and S-SSMD gene sets using different expression data. Original: Geuvadis LCL expression data normalized using PEER (i.e., data used for the main results); Rep1: first set of replication of Geuvadis LCL expression data without PEER normalization; Rep2: second set of replication of Geuvadis LCL expression data without PEER normalization; Whole blood: GTEx whole blood expression data; and Muscle: GTEx muscle expression data. The boxplot shows the frequency of observed SSMD is greater than the control SSMD of 1,000 random replicates.
doi:10.1371/journal.pgen.1004942.g003
Aberrant Gene Expression in Humans
obtain the null distribution of expecteddiffSSMDEUR-YRI. We compared the value of
diffSSM-DEUR-YRIwith the null distribution to obtain its significance.
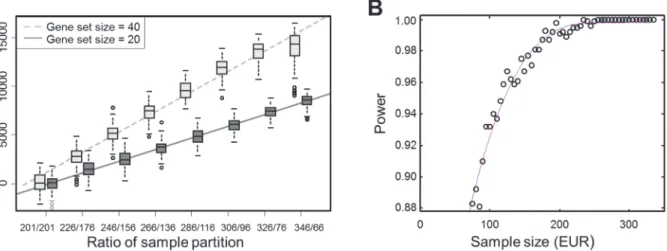
We used two random sets of genes (n= 20 and 40) to show that the values ofdiffSSMDwere
proportional to gene set size and changed linearly with the ratio by which the total samples
were partitioned into two sub-groups (Fig. 4A). In the test, we ignored the EUR and AFR
an-cestries of samples. We randomly shuffled the 402 samples, partitioned them to two
sub-groups with different ratios (such as, 201/201 or 326/76), and computed thediffSSMDbetween
the two sub-groups. We repeated this 1,000 times per ratio to obtain null distributions of
diffSSMD. We found that, regardless of gene set size, when samples were partitioned into
groups of equal size (i.e., 201/201), the averagediffSSMDwas close to zero. When samples were
partitioned unequally, the average value ofdiffSSMDincreased with the degree of inequality in
a linear manner. When the ratio of partition was fixed (e.g., 326/76, the actual sample ratio of
EUR and AFR), the averagediffSSMDreflected the size of the gene set (e.g., twice as large for
the 40-gene set as the 20-gene set). When both the ratio of partition and the gene set was fixed,
as we did in the real test for each gene set, the values of nulldiffSSMDfluctuated only due to
the random assignment of samples into the two sub-groups. Similarly, in our significance test fordiffSSMDEUR-YRI, both the gene set size and the ratio of partition (=326/76) were fixed, and
the null distribution ofdiffSSMD,diffSSMDrand, was constructed from 1,000 random repeats of
the partition of shuffled samples. An observeddiffSSMDEUR-YRIwas considered to be
signifi-cant when it was greater or smaller than all values ofdiffSSMDrand.
In total, 231 gene sets showed significantly smallerdiffSSMDEUR-YRIthandiffSSMDrandin
our analysis (S2 Table). For these gene sets, the differences betweenSSMDEURandSSMDAFR
were relatively smaller than those differences calculated when EUR and AFR individuals were
randomly assigned. This was likely caused by the relatively largeSSMDAFRin real data. In
other words, AFR samples were more likely to produce disproportionally larger SSMD than EUR samples.
In contrast, only four gene sets showed the opposite pattern—that is, for these genes,
diffSSMDEUR-YRIwas significantly larger thandiffSSMDrand. Genes in these four sets included:
(1) genes involved in the process preventing the degeneration of the photoreceptor
Figure 4. Change ofdiffSSMDas a function of the ratio between partitioned samples and the power ofdiffSSMDtest under varying sample size.
(A) The change ofdiffSSMDas a function of the size ratio of partitioned samples. The results with respect to two gene sets of size 20 and 40 are shown. For each ratio of partition, the distribution ofdiffSSMDrandwere constructed from 100 randomly shuffled samples. (B) The change of the power of thediffSSMD test between EUR and AFR populations for the population-specific effect as a function of the size of EUR samples. The red line is fitted by using polynomial regression with the cubic model.
doi:10.1371/journal.pgen.1004942.g004
Aberrant Gene Expression in Humans
(a specialized cell type that is sensitive to light), (2) genes down-regulated in prostate tumor (a tumor with distinct signatures differentiate between African-American and
European-American patients [19]), (3) genes associated with malignant fibrous histiocytoma tumors, and
(4) genes up-regulated in colon tissue upon the knockout ofMBD2, a methyl-CpG binding
protein that mediates the methylation signal.
Finally, the power analysis fordiffSSMDEUR-YRIwas conducted using the first gene set
among the four with significantly largerdiffSSMDEUR-YRI. The result suggested that the
differ-ence in sample size between EUR and AFR had little impact on the sensitivity of asserting that
the tested gene set was significant. As shown inFig. 4B, when the EUR were subsampled from
326 to 76 (the sample size of AFR), the power ofdiffSSMDonly slightly decreased.
Genetic and non-genetic factors contributing to aberrant expression
To evaluate the contributions of genetic or non-genetic factors in causing aberrant expression, we utilized three statistical metrics to characterize L- and S-SSMD genes and compared the properties of the two groups of genes (Materials and Methods). The three metrics are: (1) the discordant gene expression, measured as the relative mean difference in gene expression,
be-tween twin pairs, considering both monozygotic (MZ) and dizygotic (DZ) twins [9]; (2) the
narrow-sense heritability (h2) of gene expression [20]; and (3) the coefficient of variation (CV)
of single-cell gene expression [21].
The discordant expression between twin pairs in L-SSMD genes is greater than that in
S-SSMD genes (P= 2.8e-15 between MZ pairs and 3.0e-34 between DZ pairs; K-S test,Fig. 5A).
The more pronounced discordant expression between MZ pairs for L-SSMD genes, compared to S-SSMD genes, is likely due to the effect of environmental factors. L-SSMD genes may have increased sensitivity to environmental factors. On the other hand, regardless of L- or S-SSMD genes, the discordant expression is always greater between DZ pairs than between MZ pairs. This suggests that genetic diversity increases the level of discordance in gene expression. The
difference is more pronounced for L-SSMD genes (P= 5.6e-23 and 5.4e-6 for L- and S-SSMD
genes, respectively;S3 Table).
L-SSMD genes tend to have a smallerh2than S-SSMD genes (P= 3.6e-5, K-S test,Fig. 5B).
Similar results were obtained with differenth2estimates (e.g., those using data from another
twin cohort [22] and those using data from unrelated individuals [23]). Furthermore, L-SSMD
genes showed greater expression variability at the single-cell level than S-SSMD (P= 7.7e-21,
Figure 5. Differences in expression discordance, heritability and variability between L- and S-SSMD genes.(A) Normalized mean discordant expression (measure as the relative mean difference, RMD) per gene. (B) Heritability of gene expression. (C) Coefficient of variation of single-cell expression.
doi:10.1371/journal.pgen.1004942.g005
Aberrant Gene Expression in Humans
K-S test,Fig. 5C). Forty genes were found to be shared between L-SSMD and S-SSMD groups. Excluding these overlapping genes did not qualitatively change any results described above.
Common regulatory variation is not responsible for aberrant expression
To evaluate the contribution of eQTLs to aberrant expression, we obtained 419,983cis-acting
eQTL SNPs (eSNPs) associated with 13,703 genes from a previous study [3]. We found that
20.3% of L-SSMD genes and 19.3% of S-SSMD genes havecis-eSNP(s). That is to say, there is
no difference incis-eSNP existence between L- and S-SSMD genes (P= 0.67, Fisher’s exact
test). Due to the prevalence of eSNPs, this result was not unexpected.
Next we set out to examine whether outlier individuals are more likely to have an eQTL ge-notype that might explain their outlier status. In particular, we calculated the gege-notype-scaled
effect size (β=jβjgenotype, where genotype = {0,1,2}, to take into account of the direction of
the effect) for allcis-eSNPs of associated genes in L-SSMD gene sets for outlier individuals.
Multiple eSNPs in the same genes were treated independently and the values of
genotype-scaled effect sizes calculated were pooled together asβoutlier. We did the same calculation for
the same sets of genes for all non-outlier individuals and obtainedβnon-outlier.
We hypothesized that ifcis-eSNPs cause the outlier’s gene expression level to deviate away
from the population mean, then the genotype-scaled effect size of these eSNPs in outlier viduals should be less likely to be zero and more likely to be larger than that of non-outlier
indi-viduals. However, we found that 45.3% ofβoutlier(n= 24,649, pooling from 63 outlier-gene
pairs, i.e., pairs of outlier individual and gene in corresponding gene sets) and 46.2% of
βnon-outlier(n= 3,329,296, pooling from 309 outlier-gene pairs) were zeros. There was no
differ-ence between the two fractions (P= 0.086,χ2test). Considering that this result might be
affect-ed by the uncontrollaffect-ed linkage disequilibrium between eSNPs, we re-performaffect-ed the analysis using only the most significant eSNP per gene. With such a single-eSNP setting, we found that
9.49% ofβoutlier(n= 875, pooling from 63 outlier-gene pairs) and 10.58% ofβnon-outlier
(n= 118,965, pooling from 309 outlier-gene pairs) were zeros. Again, there was no difference
between the two fractions (P= 0.3448,χ2test). Furthermore, with only the most significantcis
-eSNP per gene, we found that the distribution of nonzeroβoutlierwas similar to that of nonzero
βnon-outlier(K-S test,P= 0.67,Fig. 6).
These results suggest that eSNPs, as commonly-occurring regulatory genetic variants, may not be responsible for aberrant expression of genes under their regulation.
Private variants may be responsible for aberrant expression
We resorted to examining whether private SNPs are responsible for aberrant expression. We tested whether private SNPs are enriched in regulatory regions of L-SSMD genes in outlier in-dividuals. The SNP density was calculated by pooling SNPs, which are private to each outlier
individual, in 1Mbcis-regulatory regions of L-SSMD genes. Based on the ENCODE
annota-tions [24], the regulatory regions were divided into seven subclasses, namely, E (predicted
en-hancer), TSS (predicted promoter region including TSS), T (predicted transcribed region), PF (predicted promoter flanking region), CTCF (CTCF-enriched element), R (predicted repressed
or low-activity region), and WE (predicted weak enhancer or open chromatincis-regulatory
element).
We found that the density of private SNPs in E regions of L-SSMD genes in outlier individuals was significantly higher than that in the same E regions in non-outlier individuals
(P<0.001, one-tailedttest). The density was also significantly higher than that derived from
three additional control settings, including the reconstructed E regions from the locations 10 Mb away from genes, and randomly selected L-SSMD or S-SSMD genes (Materials and
Aberrant Gene Expression in Humans
Methods). In summary, we randomly selected individuals or genes in a total of four different manners to construct the control scenario, from which the private SNP density was calculated and compared with the observed density. The most salient finding was that for the E regions, the observed density of private SNPs in L-SSMD genes was significantly higher than any of the
controls (Table 3). In addition, we also found that, for TSS, the density is significantly higher
than three controls (P<0.001, one-tailedttest). These results are consistent with the findings
of a previous study, which also focused on the effects of rare variant on causing outlier
expres-sion [25]. The rest of the region classes showed less significant enrichment or similar levels of
the density (Table 3). For illustrative purpose, two private SNPs, rs189458147 and
rs117086221, located in E region ofPMAIP1and TSS region ofNEIL1are depicted (S2 Fig).
Discussion
We have used MD as a measure of distance between two points in the space defined by two or
more correlated variables to quantify the deviation of individuals’gene-set expression to the
population mean. This quantity allowed us to identify outliers. The sum of the quantity across individuals (i.e., SSMD) allowed us to assess how likely a gene set is to be aberrantly expressed in outlier individuals. As expected, genes involved in fundamental molecular functions and metabolic pathways are unlikely to be aberrantly expressed, showing a small SSMD. In con-trast, genes in the gene sets with large SSMD tend to be involved in regulation of cellular
pro-cesses and modulation of signal transduction (seeTable 1). Notably, three gene sets with large
SSMD have GO definitions: (1) extracellular ligand gated ion channel activity, (2) G-protein coupled receptor activity, and (3) transmission of nerve impulse. G-protein coupled receptors constitute a large protein family of receptors that sense molecules outside the cell and activate inside signal transduction pathways, implicated in various human diseases and development
processes [26–28].
Widespread genetic regulatory variants have been uncovered by eQTL analyses. Most eQTLs are detected based on linear regression between genotype and gene expression level.
Figure 6. Distributions of nonzero effect sizeβofcis-eSNPs of L-SSMD genes in outlier and non-outlier individuals.The effect sizeβis genotype-weighted (i.e.,β=jβj*genotype, where genotype={0,1,2}).
doi:10.1371/journal.pgen.1004942.g006
Aberrant Gene Expression in Humans
The inherent limitation of this method is that only commonly-occurring regulatory genetic
variants will be discovered. Our analysis ofcis-acting eQTLs in gene sets suggests that the
ob-served patterns of expression are unlikely to be related to commonly-occurring regulatory ge-netic variation. The fact that eQTLs are less likely to be responsible for aberrant expression of genes under their regulation underscores the technical limitation of the eQTL method in deal-ing with gene expression regulation in outliers.
Instead we discovered that private SNPs are likely to be responsible for aberrant expression. Our results suggest that private SNPs are significantly enriched in enhancer and promoter
re-gions of aberrantly-expressed genes. This is in agreement with the findings of [25], in which
Montgomery and colleagues reported the identification of the signal of rare SNPs underlying large changes in gene expression by calculating whether individuals with outlier array expres-sion values are enriched for rare genetic variants. They used Z-score as a measurement of how far the observed value is from the mean of the sample. They found that individuals with gene
expression Z-score2 have an excess of rare variants within 100 kb of the transcription start
site. The signal was found to be statistically significant for rare variants landing in highly
con-served sites [25]. Taken together, results from both studies suggest that rare or private SNPs
contribute to the large changes in gene expression. Awareness of this effect is important as it means that a rare genetic variant, even only seen in an individual genome, could potentially be regulating the expression of the phenotype to an extreme extent relative to the population mean. This makes sense because the recent explosion of human population size has created
abundances of rare variants [29]. These variants, segregating in single individuals or only in
small groups of people, have not been subject to the test of natural selection, and thus can po-tentially have stronger functional consequences. They may underlie aberrant gene expression and may also underlie susceptibility to complex diseases. Therefore, the individual bearing pri-vate SNPs causing aberrant gene expression might be an interesting model of phenotypes rele-vant to the function of the aberrantly-expressed gene. Otherwise, on the population level, the variants may bear little relevance to the phenotypes.
Intrinsic properties of gene sets are defined not only by descriptive functions of genes they include but also several measurable genetic metrics. Combined use of these metrics has
Table 3. Density of private SNPs in ENCODE regulatory regions of L-SSMD genes.
Density of private SNP (per million bp)
Abbreviation Description Observed (#/Mb) Control 1 Control 2 Control 3 Control 4
E Predicted enhancer 2.07 (308/149) 1.54* 1.41* 1.76* 1.73*
TSS Predicted promoter region including transcription start site 1.91 (408/214) 1.51* 1.23* 1.45* 1.82
CTCF CTCF enriched element 1.89 (213/113) 1.71* 1.34* 1.56* 1.79
T Predicted transcribed region 2.00 (4184/2092) 1.79* 1.52* 1.83 1.92
PF Predicted promoterflanking region 1.79 (94/53) 1.46* 1.33* 1.69 1.96
R Predicted repressed or low activity region 1.88 (10152/5400) 1.72* 1.45* 1.68* 1.79 WE Predicted weak enhancer or open chromatincisregulatory
element
1.93 (102/53) 1.59* 1.63* 2.15 2.00
UNCL Unclassified region 1.64 (833/508) 1.41* 0.84* 1.53 1.60
The symbol*indicates the SNP density in the corresponding control regions is significantly lower than that in the test regions of the outlier. The significance is assessed by one-tailed t test at the level ofP= 0.001. Control 1: randomly selected non-outlier individuals to replace outlier individuals. Control 2: randomly selected genomic region that locate 10 Mb away from L-SSMD genes. Control 3: select randomly shuffled L-SSMD genes to the same amount of original gene set. Control 4: select randomly shuffled S-SSMD genes to the same amount of original gene set.
doi:10.1371/journal.pgen.1004942.t003
Aberrant Gene Expression in Humans
demonstrated the contribution of both genetic and environmental factors to aberrant expres-sion. First, twin data facilitated the dissection of the contributions of genetic and non-genetic factors. The discordance in gene expression is expected to be larger between pairs of dizygotic (DZ) twins than between pairs of monozygotic (MZ) twins, as the phenotypic difference be-tween DZ pairs may result from both genetic and environmental effects. We indeed observed the difference between MZ and DZ in discordant expression as expected, and to the same ex-tent for both genes tending to and tending not to be aberrantly expressed. This result suggests that genetic diversity increases overall expression variability. More importantly, we found that the discordant expression in MZ pairs for genes tending to be aberrantly expressed is greater than that for genes that tend not to be aberrantly expressed. This result suggests that under the same genetic background, aberrantly expressed genes are more likely to be sensitive to the change of environmental factors than non-aberrantly expressed genes. Second, heritability is a dimensionless measure of the weight of genetic factors in explaining the phenotypic variation
among individuals [30–32]. We showed that genes with small SSMD have a higher
narrow-sense heritability of gene expression than genes with large SSMD. Third, we detected that genes tending to be aberrantly expressed have a higher expression variability at the single-cell level than genes tending not to be aberrantly expressed. This result suggests that intrinsic single-cell expression contributes to aberrant expression.
In summary, we leveraged the 1,000 genomes RNA-seq data to identify aberrant gene ex-pression in humans, and described a multivariate framework for detecting aberrantly-express-ed gene sets and outlier individuals, offering a new way of measuring inter-individual variation in gene expression. This novel perspective on how to measure differences in gene expression between individual human subjects may provide important clues into the mechanisms of human adaptation, and may also be helpful for the arising field of personalized medicine.
Materials and Methods
Geuvadis RNA-seq data
We downloaded gene expression data produced by the Geuvadis project RNA-seq study [3]
from the website of EBI ArrayExpress via accessions E-GEUV-1 and E-GEUV-3. The samples included 462 unrelated human LCLs from the EUR (CEU, FIN, GBR, TSI) and YRI popula-tions, most of which had been sequenced in the 1000 Genome Project Phase 1. The expression data were normalized by using the algorithm of probabilistic estimation of expression residuals
(PEER) [3,17,33]. To minimize the impact of unspecific sources on measurement of
individu-al’s expression, principal component analysis (PCA) was applied to the full expression matrix.
Based on the PCA results, 19 EUR individuals with unusual global expression profiles relative to the rest of individuals in the population were excluded due to potential technical artifacts (S3 Fig). We also excluded individuals whose genotype information was unavailable in the 1000 Genome Project Phase 1, resulting in a total of 402 remaining samples (326 EUR and 76 AFR).
Annotated gene sets
Gene sets were downloaded from MSigDB v4.0 [14]. The MSigDB gene sets had been divided
into seven groups: C1—positional gene sets (n= 326), C2—Curated gene set (n= 4,722),
C3—motif gene (n= 836), C4—Computational gene sets (n= 858), C5—GO gene sets
(n= 1,454), C6—oncogenic signatures (n= 189), and C7—immunologic signatures
(n= 1,910). The annotated gene sets of the NHGRI GWAS Catalog [15] were obtained from
http://www.genome.gov/gwastudies(accessed April 2014).
Aberrant Gene Expression in Humans
Robust MD calculation
To calculate MD, the correlation between the expression profiles of individuals was captured
by theinter-individual expression covariance,Covab. For expressionEbetween any two
individ-ualsaandb,Covabis computed as:
Covab¼
Xm
k¼1ðEak maÞðEbk mbÞ
m 1 ;
wheremis the number of genes in the gene set under study, andµaandµbare the mean gene
expression values for individualsaandb, respectively. Given all pair-wise comparisons of
indi-viduals we obtained the inter-individual covariance matrixCov. We employed the minimum
covariance determinant (MCD) estimator [34] to compute a robust version ofCov, as
imple-mented in the Matlab toolbox LIBRA [35]. We then computed the MD for each individual as
MDi¼
ffiffiffiffiffiffiffiffiffiffiffiffiffiffiffiffiffiffiffiffiffiffiffiffiffiffiffiffiffiffiffiffiffiffiffiffiffiffiffiffiffiffiffiffiffiffiffiffi
ðEi m~Þ
T
Cov 1ðE i m~Þ
q
;
wherem~ismlength vector of the per-gene mean values across all individuals.
The statisticSSMD¼XMD2
iwas calculated for each set. To approximate the empirical
null distributions for SSMD, we applied resampling for gene sets with different numbers of
genes, ranging from 2 to 150. For a given number of genesm, we randomly sampledmgenes
from the full expression matrix without replacement, and then computed SSMD for the resam-pled gene set. The procedure was repeated 1,000 times for all gene sets. More permutations
were performed for significant gene sets until the desired Bonferroni correction levelP= 0.01
was either achieved or rejected. The resampling process breaks correlation structure between genes, hence providing a background distribution of expected random distribution of SSMD. We compared the SSMD in the observed gene set to equally-sized sets drawn at random from all assayed genes.
The chi-square plot was plotted as theIranked MD value against the values ofχ2(p,m),
wherep= (i-0.5)/Iandmis the number of genes in the gene set. The right panel ofFig. 1is the
chi-square plot that supports the multivariate outliers identified [13]. A chi-square plot draws
the empirical distribution function of the square of the MD against theχ2distribution with
de-gree of freedom equal tom. A break in the tail of theχ2distribution is an indicator for outliers
[36], given that the square of the MD is approximately distributed as aχ2distribution [13,37].
Power analysis for SSMD test
To evaluate the sensitivity of SSMD as a statistic for detecting L-SSMD gene set, power analyses were conducted. One selected L-SSMD gene set, POTTI_ETOPOSIDE_SENSITIVITY, was
used as the test set. The impacts of sample size (n) and the size of gene set (m) were considered.
The selected L-SSMD gene set contained 37 genes, that is,m= 37, while the sample sizen=
326. The original expression data matrix was subsampled by lowering eithernorm. For each
subsamplednormvalue, 100 random replicates of expression data matrix were constructed.
The SSMD was computed for each subsampled replicate and the significance of the observed SSMD was assessed by permutation tests, as described above for detecting L-SSMD gene sets.
The more sensitive is SSMD tonorm, the less would subsampled replicates remain significant
as an L-SSMD.
Aberrant Gene Expression in Humans
Discordant expression, heritability, and single-cell gene expression
To compute the discordant expression of genes between twin pairs, twinsUK gene expression
data from the study of [22] were acquired. The discordant expression, i.e., the expression
differ-ences between each pair of twins, was measured as done previously [9]. Briefly, for each gene,
the relative mean difference (RMD) in expression between MZ twin pairs and between DZ
twin pairs was computed. For a pair of MZ twins,i, for example, the RMD was computed
usingRMDi¼
jyMZ1
i yiMZ2j
2yi , whereyiis the arithmetic mean of the levels of gene expression for
that MZ twin pair (designated asyMZ1
i andy
MZ2
i ). For each gene, the data from all MZ or DZ
twin pairs were pooled to compute the mean RMD per gene,1
n
X
RMDi, wherenis the
num-ber of twin pairs. The computed mean RMD per gene was normalized by the value computed in the same way but with the expression data reconstructed by randomly assigning the
identi-ties of twin pairs. The values of narrow-sense heritability (h2) of gene expression were obtained
from the study of [20]. The different estimates ofh2were also obtained from the studies of [22]
and [23]. The single-cell gene expression levels measured in 42 LCLs were acquired from the
study of [21].
Effect size of common eSNPs
The absolute value of slope coefficient (jβj) of the linear regression model was used as the
mea-sure of the effect size of each eSNP. The gene expression levels across individuals were
normal-ized using Z-score to make the values ofβuncorrelated with the total gene expression levels.
The sign ofβwas ignored because it is only relative against the genotypes of each eSNP, which
were denoted by 0 for homozygous major alleles, 1 for heterozygous alleles, and 2 for
homozy-gous minor alleles. Instead, an eSNP’s effect direction was determined by whether the eSNP
causes gene expression to shift away from or towards the mean gene expression for the majori-ty of individuals in the populations. In this sense, the notation of genomajori-types (0,1,2) provided
the information of effect direction for eSNP. If an individual’s eSNP genotype is 0, then the
ef-fect of the eSNP is to maintain the same expression level for the eSNP-regulated gene between outlier individuals and the majority of individuals in the population; on the other hand, if the
eSNP’s genotype is 1 or 2, then the effect of the eSNP is to either increase or decrease
(depend-ing on the sign of the slope) the expression of the gene by one or two times ofjβjthan that of
genotype 0. Therefore, the effect size was weighted by the genotype:β=jβjgenotype. The
ge-notype-scaled effect size was used in the comparison of the combined eSNP effects between outlier and non-outlier individuals.
Density of private SNPs in regulatory regions of L-SSMD genes
Both heterozygous and homozygous private SNPs, with allele frequency of 1/(2N) and 1/N,
re-spectively, for each individual (whereNis the number of individuals), were counted. Thecis
-regions of tested genes were split into seven subclasses of regulatory -regions, according to the
combined chromatin state segmentation of the ENCODE GM12878 sample [24]. The density
of private SNPs in each subclass of the regions was assessed for enrichment significance by comparing the observed density with that of randomly generated control regions. To provide comprehensive controls, four different means were used to construct control regions: (1) ran-domly selected non-outlier individuals to replace outlier individuals, (2) ranran-domly selected ge-nomic regions located 10 Mb away from L-SSMD genes, (3) randomly selected shuffled L-SSMD genes in the same amount of original gene set, and (4) shuffled S-SSMD genes in the same amount of original gene sets.
Aberrant Gene Expression in Humans
Supporting Information
S1 Fig. Distribution of outliers in corresponding gene sets.The 63 outliers (involving 17 dis-tinct individuals) with respect to the 31 L-SSMD gene sets, detected by using chi-square plot, are highlighted with shaded box. The indexes of L-SSMD gene sets are given and their names
are given inTable 1of the main text.
(PDF)
S2 Fig. Private SNPs located in ENCODE E (predicted enhancer) and TSS (predicted tran-scribed region) regions of corresponding L-SSMD genes. (A)Rs117086221 is located in the
TSS region of geneNEIL1in the individual NA12154.(B)Rs189458147 locates in the potential
E region of genePMAIP1in the individual HG00122.
(PDF)
S3 Fig. PCA with global gene expression data assists the removal of outliers. (A)A total of 19 outliers removed. They are: HG00099, HG00329, HG00125, NA12004, NA07051, HG00358, NA12399, HG00280, NA20502, NA07346, NA20792, NA12340, NA12716, NA12342, NA12842, NA20785, NA12044, NA12058, and NA07347 from populations of GBR, FIN, GBR, CEU, CEU, FIN, CEU, FIN, TSI, CEU, TSI, CEU, CEU, CEU, CEU, TSI, CEU,
CEU, and CEU, respectively.(B)PCA result after the outliers are removed.
(PDF)
S1 Table. GWAS gene sets that tend to be aberrantly expressed in LCLs of European de-scent.
(PDF)
S2 Table. Gene sets with significantdiffSSMD = SSMDEUR-SSMDYRI. (PDF)
S3 Table.P-values of Kolmogorov-Smirnov test for the normalized relative mean difference (RMD) between“L-SSMD”and“S-SSMD”genes in monozygotic (MZ) and dizygotic (DZ) twins.
(PDF)
Acknowledgments
We gratefully acknowledge the critical reviews by three anonymous reviewers on an earlier ver-sion of the manuscript and the helpful comments by Dr. Stephen Montgomery. We also ac-knowledge the Texas A&M University Supercomputing Facility and the Whole Systems Genomics Initiative (WSGI) Compute Cluster for providing computing resources and system administration support.
Author Contributions
Conceived and designed the experiments: CLBL JJC. Performed the experiments: YZ GW EY GJ. Analyzed the data: YZ GW EY GJ. Contributed reagents/materials/analysis tools: YZ GW EY GJ. Wrote the paper: YZ GW CLBL JJC.
References
1. Kilpinen H, Barrett JC (2013) How next-generation sequencing is transforming complex disease genet-ics. Trends Genet 29: 23–30. doi:10.1016/j.tig.2012.10.001PMID:23103023
2. Cirulli ET, Goldstein DB (2010) Uncovering the roles of rare variants in common disease through whole-genome sequencing. Nat Rev Genet 11: 415–425. doi:10.1038/nrg2779PMID:20479773
Aberrant Gene Expression in Humans
3. Lappalainen T, Sammeth M, Friedlander MR, t Hoen PA, Monlong J, et al. (2013) Transcriptome and genome sequencing uncovers functional variation in humans. Nature 501: 506–511. doi:10.1038/
nature12531PMID:24037378
4. Fairfax BP, Makino S, Radhakrishnan J, Plant K, Leslie S, et al. (2012) Genetics of gene expression in primary immune cells identifies cell type-specific master regulators and roles of HLA alleles. Nat Genet 44: 502–510. doi:10.1038/ng.2205PMID:22446964
5. Stranger BE, Nica AC, Forrest MS, Dimas A, Bird CP, et al. (2007) Population genomics of human gene expression. Nat Genet 39: 1217–1224. doi:10.1038/ng2142PMID:17873874
6. Montgomery SB, Sammeth M, Gutierrez-Arcelus M, Lach RP, Ingle C, et al. (2010) Transcriptome ge-netics using second generation sequencing in a Caucasian population. Nature 464: 773–777. doi:10.
1038/nature08903PMID:20220756
7. Brown AA, Buil A, Vinuela A, Lappalainen T, Zheng HF, et al. (2014) Genetic interactions affecting human gene expression identified by variance association mapping. Elife 3: e01381. doi:10.7554/ eLife.01381PMID:24771767
8. Hulse AM, Cai JJ (2013) Genetic variants contribute to gene expression variability in humans. Genetics 193: 95–108. doi:10.1534/genetics.112.146779PMID:23150607
9. Wang G, Yang E, Brinkmeyer-Langford CL, Cai JJ (2014) Additive, epistatic, and environmental effects through the lens of expression variability QTL in a twin cohort. Genetics 196: 413–425. doi:10.1534/
genetics.113.157503PMID:24298061
10. Li X, Battle A, Karczewski KJ, Zappala Z, Knowles DA, et al. (2014) Transcriptome sequencing of a large human family identifies the impact of rare noncoding variants. Am J Hum Genet 95: 245–256.
doi:10.1016/j.ajhg.2014.08.004PMID:25192044
11. Zani S, Riani M, Corbellini A (1998) Robust bivariate boxplots and multiple outlier detection. Computa-tional Statistics & Data Analysis 28: 257–270. doi:10.1016/S0167-9473(98)00040-1
12. Mahalanobis PC (1936) On the generalised distance in statistics. Proc Nat Inst Sci India (Calcutta) 2: 49–55.
13. Garrett RG (1989) The Chi-Square Plot - a Tool for Multivariate Outlier Recognition. Journal of Geo-chemical Exploration 32: 319–341. doi:10.1016/0375-6742(89)90071-X
14. Subramanian A, Tamayo P, Mootha VK, Mukherjee S, Ebert BL, et al. (2005) Gene set enrichment analysis: a knowledge-based approach for interpreting genome-wide expression profiles. Proc Natl Acad Sci U S A 102: 15545–15550. doi:10.1073/pnas.0506580102PMID:16199517
15. Welter D, MacArthur J, Morales J, Burdett T, Hall P, et al. (2014) The NHGRI GWAS Catalog, a curated resource of SNP-trait associations. Nucleic Acids Res 42: D1001–1006. doi:10.1093/nar/gkt1229
PMID:24316577
16. Stranger BE, Montgomery SB, Dimas AS, Parts L, Stegle O, et al. (2012) Patterns of cis regulatory vari-ation in diverse human populvari-ations. PLoS Genet 8: e1002639. doi:10.1371/journal.pgen.1002639 PMID:22532805
17. Leek JT, Storey JD (2007) Capturing heterogeneity in gene expression studies by surrogate variable analysis. PLoS Genet 3: 1724–1735. doi:10.1371/journal.pgen.0030161PMID:17907809
18. GTEx_Consortium (2013) The Genotype-Tissue Expression (GTEx) project. Nat Genet 45: 580–585.
doi:10.1038/ng.2653PMID:23715323
19. Wallace TA, Prueitt RL, Yi M, Howe TM, Gillespie JW, et al. (2008) Tumor immunobiological differences in prostate cancer between African-American and European-American men. Cancer Res 68: 927–936.
doi:10.1158/0008-5472.CAN-07-2608PMID:18245496
20. Wright FA, Sullivan PF, Brooks AI, Zou F, Sun W, et al. (2014) Heritability and genomics of gene ex-pression in peripheral blood. Nat Genet.
21. Marinov GK, Williams BA, McCue K, Schroth GP, Gertz J, et al. (2014) From single-cell to cell-pool tran-scriptomes: stochasticity in gene expression and RNA splicing. Genome Res 24: 496–510. doi:10.
1101/gr.161034.113PMID:24299736
22. Grundberg E, Small KS, Hedman AK, Nica AC, Buil A, et al. (2012) Mapping cis- and trans-regulatory effects across multiple tissues in twins. Nat Genet 44: 1084–1089. doi:10.1038/ng.2394PMID:
22941192
23. Yang S, Liu Y, Jiang N, Chen J, Leach L, et al. (2014) Genome-wide eQTLs and heritability for gene ex-pression traits in unrelated individuals. BMC Genomics 15: 13. doi:10.1186/1471-2164-15-13PMID: 24405759
24. Hoffman MM, Ernst J, Wilder SP, Kundaje A, Harris RS, et al. (2013) Integrative annotation of chroma-tin elements from ENCODE data. Nucleic Acids Research 41: 827–841. doi:10.1093/nar/gks1284
PMID:23221638
Aberrant Gene Expression in Humans
25. Montgomery SB, Lappalainen T, Gutierrez-Arcelus M, Dermitzakis ET (2011) Rare and common regu-latory variation in population-scale sequenced human genomes. PLoS Genet 7: e1002144. doi:10. 1371/journal.pgen.1002144PMID:21811411
26. Jayasinghe BS, Volz DC (2012) Aberrant ligand-induced activation of G protein-coupled estrogen re-ceptor 1 (GPER) results in developmental malformations during vertebrate embryogenesis. Toxicol Sci 125: 262–273. doi:10.1093/toxsci/kfr269PMID:21984484
27. Lacroix A, Bourdeau I, Lampron A, Mazzuco TL, Tremblay J, et al. (2010) Aberrant G-protein coupled receptor expression in relation to adrenocortical overfunction. Clin Endocrinol (Oxf) 73: 1–15.PMID:
19719763
28. Spiegel AM, Weinstein LS (2004) Inherited diseases involving g proteins and g protein-coupled recep-tors. Annu Rev Med 55: 27–39. doi:10.1146/annurev.med.55.091902.103843PMID:14746508 29. Keinan A, Clark AG (2012) Recent explosive human population growth has resulted in an excess of
rare genetic variants. Science 336: 740–743. doi:10.1126/science.1217283PMID:22582263 30. Visscher PM, Hill WG, Wray NR (2008) Heritability in the genomics era - concepts and misconceptions.
Nature Reviews Genetics 9: 255–266. doi:10.1038/nrg2322PMID:18319743
31. Price AL, Helgason A, Thorleifsson G, McCarroll SA, Kong A, et al. (2011) Single-tissue and cross-tis-sue heritability of gene expression via identity-by-descent in related or unrelated individuals. PLoS Genet 7: e1001317. doi:10.1371/journal.pgen.1001317PMID:21383966
32. Zaitlen N, Kraft P (2012) Heritability in the genome-wide association era. Hum Genet 131: 1655–1664.
doi:10.1007/s00439-012-1199-6PMID:22821350
33. Stegle O, Parts L, Piipari M, Winn J, Durbin R (2012) Using probabilistic estimation of expression resid-uals (PEER) to obtain increased power and interpretability of gene expression analyses. Nature Proto-cols 7: 500–507. doi:10.1038/nprot.2011.457PMID:22343431
34. Rousseeuw PJ (1984) Least Median of Squares Regression. Journal of the American Statistical Asso-ciation 79: 871–880. doi:10.1080/01621459.1984.10477105
35. Verboven S, Hubert M (2005) LIBRA: a MATLAB library for robust analysis. Chemometrics and Intelli-gent Laboratory Systems 75: 127–136. doi:10.1016/j.chemolab.2004.06.003
36. Rousseeuw PJ, Vanzomeren BC (1990) Unmasking Multivariate Outliers and Leverage Points. Journal of the American Statistical Association 85: 633–639. doi:10.2307/2289999
37. Filzmoser P, Maronna R, Werner M (2008) Outlier identification in high dimensions. Computational Sta-tistics & Data Analysis 52: 1694–1711. doi:10.1016/j.csda.2007.05.018
Aberrant Gene Expression in Humans