Expression in Sickle Cell Diseases
Shao-Yin Chen1,2, Yulei Wang3, Marilyn J. Telen4, Jen-Tsan Chi1,2*
1The Institute for Genome Sciences and Policy, Duke University School of Medicine, Durham, North Carolina, United States of America,2Department of Molecular Genetics and Microbiology, Duke University School of Medicine, Durham, North Carolina, United States of America,3Applied Biosystems, Foster City, California, United States of America,4Division of Hematology, Department of Medicine, Duke University School of Medicine, Durham, North Carolina, United States of America
Abstract
Background:Since mature erythrocytes are terminally differentiated cells without nuclei and organelles, it is commonly thought that they do not contain nucleic acids. In this study, we have re-examined this issue by analyzing the transcriptome of a purified population of human mature erythrocytes from individuals with normal hemoglobin (HbAA) and homozygous sickle cell disease (HbSS).
Methods and Findings:Using a combination of microarray analysis, real-time RT-PCR and Northern blots, we found that mature erythrocytes, while lacking ribosomal and large-sized RNAs, contain abundant and diverse microRNAs. MicroRNA expression of erythrocytes was different from that of reticulocytes and leukocytes, and contributed the majority of the microRNA expression in whole blood. When we used microRNA microarrays to analyze erythrocytes from HbAA and HbSS individuals, we noted a dramatic difference in their microRNA expression pattern. We found that miR-320 played an important role for the down-regulation of its target gene, CD71 during reticulocyte terminal differentiation. Further investigation revealed that poor expression of miR-320 in HbSS cells was associated with their defective downregulation CD71 during terminal differentiation.
Conclusions:In summary, we have discovered significant microRNA expression in human mature erythrocytes, which is dramatically altered in HbSS erythrocytes and their defect in terminal differentiation. Thus, the global analysis of microRNA expression in circulating erythrocytes can provide mechanistic insights into the disease phenotypes of erythrocyte diseases.
Citation:Chen S-Y, Wang Y, Telen MJ, Chi J-T (2008) The Genomic Analysis of Erythrocyte microRNA Expression in Sickle Cell Diseases. PLoS ONE 3(6): e2360. doi:10.1371/journal.pone.0002360
Editor:Baohong Zhang, East Carolina University, United States of America
ReceivedDecember 8, 2007;AcceptedApril 24, 2008;PublishedJune 4, 2008
Copyright:ß2008 Chen et al. This is an open-access article distributed under the terms of the Creative Commons Attribution License, which permits unrestricted use, distribution, and reproduction in any medium, provided the original author and source are credited.
Funding:The authors have no support or funding to report.
Competing Interests:The authors have declared that no competing interests exist.
* E-mail: [email protected]
Introduction
Erythrocytes constitute more than 90% of the cell population in the peripheral blood and are responsible for efficient gas exchange in the human body. Mature erythrocytes are the end-products of a highly regulated differentiation process that involves the gradual loss of cellular organelles, a decline in nucleic acid content, and a step-wise acquisition of erythrocyte characteristics [1]. One striking feature of erythroid differentiation is that the nuclei are extruded from cells as they differentiate into reticulocytes, the immediate precursor of mature erythrocytes. While cytoplasmic RNA and translation activities are still detectable in CD71+ reticulocytes, they fall below the detection limit as cells terminally differentiate to become CD71- mature erythrocytes [2]. Since hemoglobin makes up the majority of erythrocyte cellular proteins, these cells are frequently thought to serve merely as inert and passive containers of hemoglobins. However, their more dynamic nature was suggested by the recent finding that erythrocytes can mount cellular signaling and trigger functional responses during physiological and pathological stresses [3,4]. This suggests that erythrocytes have a more sophisticated intracellular environment than previously appreciated.
Given the potential limitations of sensitivity and size bias for these traditional means of isolating and characterizing erythrocyte RNA, it remained possible that erythrocytes may contain RNA species not previously identified. Here, we provide several lines of evidence that human mature erythrocytes, although lacking in ribosomal and large-sized RNAs, contain diverse and abundant microRNAs. Our findings confirm the results of a recent study on small RNA expression inPlasmodium falciparumthat found several microRNA species in peripheral erythrocytes [8]. Importantly, the discovery of these microRNAs allowed us to use microarrays to compare their expression in mature erythrocytes from normal (HbAA) and homozygous sickle cell (HbSS) individuals and to identify a link between the dysregulation of microRNA and the pathogenesis of sickle cell disease (SCD).
Results
Purification of Human Mature Erythrocytes
To test for the possibility that mature erythrocytes contain previously undetected RNAs, we developed a protocol to obtain a pure population of mature erythrocytes by removing other blood cells through a series of purification procedures (Fig 1A). Blood collected from healthy volunteers first went through a PALL
PurecellNeo filter to remove most leukocytes and was then placed in a Ficoll-hypaque density gradient to separate erythrocytes from leukocytes and platelets. Finally, any remaining leukocytes (CD45+) and reticulocytes (CD71+) in the packed erythrocyte pellets were removed by magnetic immuno-depletion with AutoMacs.
The purity of the erythrocytes obtained by this method was assessed with lineage-specific markers. Purified cells were 99.8% positive for the erythrocyte marker CD235a, while negative for leukocyte (CD45, CD16) and reticulocyte (CD71) markers (Fig 1B). These results correlated well with molecular evidence for leukocyte depletion, in that no CD45 mRNA was detected by RT-PCR (Fig 1C). The absence of reticulocytes in our erythrocyte preparations was validated by the absence of positive cells when stained with new methylene blue (Fig 1D) as well as routine reticulocyte analysis in the clinical laboratory. Taken together, these results show that we were able to obtain highly purified mature erythrocytes without significant contamination of leukocytes and reticulocytes.
Identification and genomic characterization of erythrocyte microRNAs
To ensure that RNAs of all sizes were recovered from erythrocytes, we chose an RNA purification method designed for microRNA isolation, capable of capturing RNAs as small as
Figure 1. The purification of human mature erythrocytes.(A) The purification scheme used to obtain mature erythrocytes and reticulocytes from human blood. Assessment of the purified mature erythrocytes was then performed by examining the surface expression of indicated lineage markers on whole blood (before purification–blue line) and purified erythrocytes (after purification–red line) with FACS–CD16, CD45, CD71 and CD235a (B). (C) RT-PCR assay to evaluate the abundance of indicated transcripts (CD45, tRNA and beta-hemoglobin) in the RNA from purified erythrocytes (RBC), peripheral blood mononuclear cells (PBMC) and whole blood. (D) New methylene blue stain of the CD71- erythrocytes (left) and CD71+reticulocytes (right) from two independent isolations.
ten nucleotides (nt). By this means of RNA purification, we obtained low but reproducible levels of RNAs from all mature erythrocyte samples (N = 21). The RNA yields ranged from 5– 10mg RNAs from 10 ml of whole blood; by back-calculation, considering the cell numbers and cell purification yield, with the assumption of equal RNAs in all erythrocytes, the RNA content was approximately 2–361024pg/cell. This RNA content is similar to platelets (361024pg/cell), but significantly lower than nucleated cells (5–9 pg/cell) [9]. To rule out the possibility that the RNAs were from contaminating reticulocytes, we adopted an alternative approach to separate reticulocytes from erythrocytes with an arabinogalactan density gradient [10]. With this independent approach of isolating mature erythrocytes, we obtained a similar level of erythrocyte RNA.
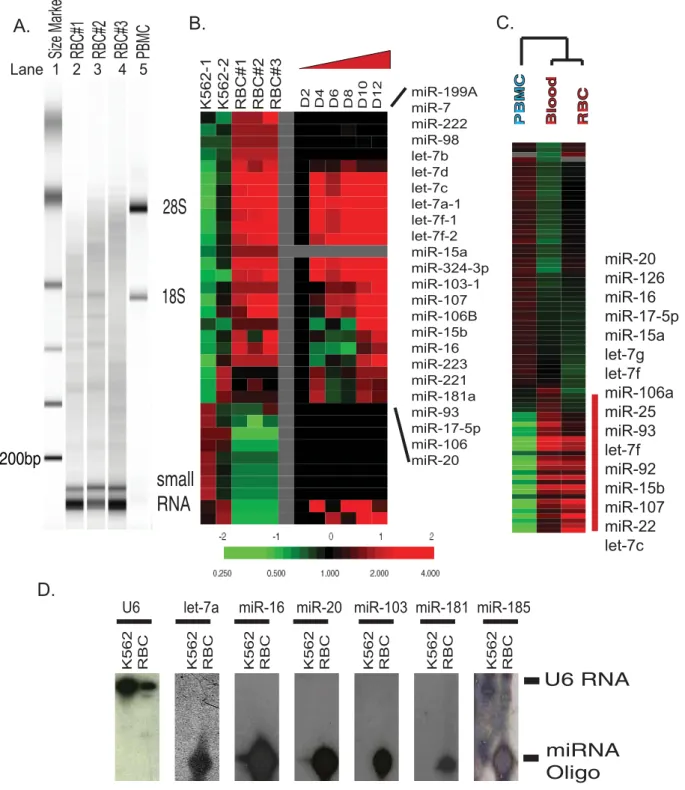
We then used an Agilent bioanalyzer to compare the size distribution of erythrocyte RNAs with leukocyte RNAs (Fig 2A). Erythrocyte RNAs (Fig 2A, lane 2–4) did not contain the two distinct ribosomal bands (28S and 18S) observed in simultaneously prepared peripheral blood mononuclear cells (PBMC) (Fig 2A, lane 5). Instead, erythrocyte RNAs was highly enriched for small-sized RNAs of less than 200 base pairs, which were also present in leukocyte RNAs but at a much lower level. These small-sized RNAs were sensitive to treatment with RNAse and NaOH, while resistant to DNAse treatment. The observed size range of erythrocyte RNAs could represent several RNA species, including microRNA, snoRNA, tRNA and degraded mRNAs. MicroRNAs are evolutionarily conserved, small, non-coding RNA molecules that play important regulatory roles in various biological processes [11]. To assess the possibility that the small-sized RNAs contained microRNAs, we utilized a spotted microRNA microarray platform containing DNA oligonucleotides representing 196 human micro-RNAs [12] to interrogate the microRNA contents of mature erythrocytes and K562, an erythroleukemia cell line which expresses many genes typical of an earlier stage of erythroid differentiation. Equal amounts (40 ng) of fractionated RNAs from three separately purified erythrocyte and two K562 samples were labeled for microarray analysis. As shown in Fig 2A, the hybridization result revealed abundant and diverse microRNAs within the erythrocyte RNAs and 87 microRNAs whose expression varied between erythrocyte and K562 more than 3 fold in at least two samples. When compared with K562 cells, mature erythrocytes specifically expressed several microRNAs, including several microRNAs in the let-7 family and several microRNAs (miR-181A, miR-223, miR-15, miR-16) that have been shown to play a role in the lineage differentiation in the hematopoietic system [13].
To examine changes in microRNA expression levels during the process of erythroid differentiation, we compared our array results with microRNA expression in the differentiating hematopoietic CD34+ cells described in the supplemental data of a study on cancer microRNA expression [14]. Even though the CD34+cells did not reach the stage of reticulocytes at the end of this in vitro differentiation process, most of the erythrocyte-specific micro-RNAs found in our array analysis were upregulated during the early stages of erythroid differentiation (Fig 2B). Similar sets of microRNAs were also found in two other studies of microRNA expression with different in vitroerythroid differentiation models [15,16]. Despite the fact that erythrocytes are the predominant cell type in the peripheral blood, the messenger RNA (mRNA) from leukocytes contributes the majority of mRNA in whole blood, since these nucleated cells have much higher RNA content [7]. Our finding of microRNA expression in erythrocytes prompted us to test whether erythrocyte microRNA may contribute signifi-cantly to the microRNA expression pattern seen in whole blood.
To test this possibility, RNAs from whole blood, erythrocytes, and leukocytes from the same healthy normal individuals (N = 3) were fractionated and an equal amount of small-sized RNAs (,40 bp) was labeled and interrogated with microRNA microarrays. The unsupervised hierarchical clustering of these samples consistently arranged whole blood samples and erythrocyte samples in the same branch away from the leukocyte samples. This showed that the whole blood microRNA expression pattern was similar to that of erythrocytes and not that of leukocytes (Fig. 2C). This observation is distinct from the results obtained with mRNA and further highlights the important contribution of erythrocyte microRNA to whole blood microRNA expression. Therefore, leukocyte microRNAs represent a relatively minor portion of whole blood microRNAs and are not likely to be the source of the microRNAs we have discovered in mature erythrocytes. The erythrocyte-specific microRNA gene cluster found when com-pared with leukocytes (Fig 2C) contained the same sets of erythrocyte-specific microRNAs seen when erythrocytes were compared with K562 in the previous analysis (Fig 2B). We chose six of erythrocyte-specific microRNAs and further validated their abundant expression in erythrocytes by Northern blot (Fig 2D). All of the tested microRNAs were present predominantly in their mature form in the erythrocytes. No significant precursor microRNAs or microRNA degradation products were noted in the Northern blots.
and another branch containing reticulocytes (displayed as a heat map in Fig 3A). Therefore, mature erythrocytes have a microRNA expression pattern distinct from that of reticulocytes. We have
further applied Significant Analysis of Microarrays (SAM) [19] in a supervised analysis and found that 83 microRNAs were expressed in a reticulocyte-enriched fashion (Fig 3A and
A.
B.
C.
K562-1 K562-2 RBC#1 RBC#2 RBC#3 D2 D4 D6 D8 D10 D12 miR-199AmiR-7 miR-222 miR-98 let-7b let-7d let-7c let-7a-1 let-7f-1 let-7f-2 miR-15a miR-324-3p miR-103-1 miR-107 miR-106B miR-15b miR-16 miR-223 miR-221 miR-181a miR-93 miR-17-5p miR-106 miR-20
U6 RNA
miRNA
Oligo
U6 let-7a miR-16 miR-20 miR-103 miR-181 miR-185
K562 RBC K562 RBC K562 RBC K562 RBC K562 RBC K562 RBC K562 RBC
miR-20
miR-126
miR-16
miR-17-5p
miR-15a
let-7g
let-7f
miR-106a
miR-25
miR-93
let-7f
miR-92
miR-15b
miR-107
miR-22
let-7c
PBMCP
B
M
C
BloodB
lo
o
d
RBCR
B
C
D.
Size Marker
RBC#1
RBC#2
RBC#3
PBMC
28S
18S
small
RNA
200bp
Lane 1 2 3 4 5
Figure 2. Human mature erythrocytes contain abundant and diverse microRNAs.(A) The size distribution of RNAs of three independent erythrocyte samples (lanes 2–4 labeled RBC#1,2,3) and one PBMC sample (lane 5 labeled as PBMC) were assessed with Agilent Bioanalyzer with indicated size markers (lane 1 as indicated). (B) Left: the microRNA expression pattern obtained with microRNA microarrays of three mature erythrocyte samples was compared to that of two erythroleukemia K562 cell lines. Right: the expression of erythrocyte-specific microRNAs in the CD34+erythroid progenitor cells at indicated stages of erythroid differentiation in a previously published study [14]. (C) The microRNA expression of whole blood was similar to erythrocytes and grouped together in one branch away from leukocytes with unsupervised hierarchical clustering. Selected erythrocyte-specific microRNAs were shown. (D) The expression of U6 and indicated microRNAs in K562 cells and erythrocytes was assessed by Northern blots with the migration position of U6 and mature microRNAs indicated. The position of U6 RNA and microRNAs (indicated bars on the right) were established with synthesized DNA oligonucleotides included in the Northern blots.
Table 1). These reticulocyte-enriched microRNAs included microRNAs of the let-7 family as well as miR-221 and miR-222, two microRNAs whose downregulation during erythroid differ-entiation is essential this process [20].
To determine whether the global analysis erythrocyte micro-RNA expression can lead to novel insights in human erythrocyte diseases, we recruited 12 individuals with HbSS (homozygous
sickle cell disease) and 7 race-matched individuals with HbAA (normal hemoglobin). We used the three-step purification method based on both density separation and immuno-depletion of the reticulocyte population (Fig 1A) to isolate erythrocytes for RNA analysis since the density-only approach may suffer potential reticulocyte contamination in ‘‘dense’’ cell fractions from the HbSS patients. Using FACS, methylene blue stain and clinical
A.
B.
C.
.4
.2
0
–.2
–.4
Mean Reticulocyte miRNA
expression
HbAA
HbAA
HbSS
HbSS
p <0.0001
Ret
Ret
RBC
RBC
D.
miR-320 let-7 miR-181 miR-141
miR-29a miR-144 miR-451 miR-140
HbSS
HbAA
HbAA
HbAA
HbSS
HbSS
Reticulocyte-specific microRNA
let-7a let-7e
miR-222
miR-221
miR-29a miR-20 miR-107
Figure 3. Erythrocyte microRNA show differentiation- and disease-specific expression.(A) The expression value of microRNA expression in the two reticulocytes (pink) and ten erythrocytes (red) assessed with TaqMan real-time assay. The expression levels of the 83 microRNAs identified by SAM as reticulocyte-specific were shown with selected microRNAs indicated. (B, C) The erythrocyte microRNA expression obtained from 7 HbAA (red) vs. 12 HbSS (brown) samples assessed with microRNA microarrays are distinct and grouped separately with unsupervised hierarchical clustering with several differentially expressed microRNAs indicated. (D) The average expression value of the 83 reticulocyte-specific microRNAs in the HbSS (brown) erythrocytes was significantly higher than that of HbAA (red) erythrocytes.
laboratory techniques we confirmed that the purification scheme would allow us to obtain a mature erythrocyte population from HbSS individuals, who typically have higher levels of reticulocytes than normal individuals. The microRNA expression pattern of the purified erythrocytes from these 19 individuals was determined by microRNA microarrays. The microRNA expression patterns in HbSS and HbAA erythrocytes were distinct from each other and were easily separated into two groups by unsupervised hierarchical clustering (Fig. 3B) based on the 200 array elements (97 microRNAs) varying by more than 1.8 fold from the mean in two samples. Several microRNAs (320, let-7s, 181, miR-141) were over-represented in the HbAA erythrocytes, while other microRNAs (miR-29a, miR-144, miR-451, miR-140) were over-represented in the HbSS erythrocytes (Fig. 3C). To compare the differentiation status of the two sample groups, we extracted expression values of the 83 reticulocyte-enriched microRNAs (Fig 3A) and found that their expression level was significantly
Table 1.The 83 microRNAs with preferential expression in reticulocytes.
Reticulocyte-specific microRNAs
hsa-miR-125b
hsa-miR-321
hsa-miR-193
hsa-miR-145
hsa-miR-128b
hsa-miR-221
hsa-let-7f
hsa-miR-99b
hsa-let-7a
hsa-let-7g
hsa-miR-19a
hsa-miR-122a
hsa-miR-146
hsa-miR-129
hsa-miR-151
hsa-miR-373
hsa-miR-188
hsa-miR-197
hsa-miR-187
hsa-let-7d
hsa-miR-339
hsa-let-7c
hsa-let-7e
hsa-miR-338
hsa-miR-143
hsa-let-7b
hsa-miR-196b
hsa-miR-370
hsa-miR-93
hsa-miR-345
hsa-miR-103
hsa-miR-125a
hsa-miR-302a*
hsa-mir-196-1
hsa-miR-198
hsa-miR-216
hsa-miR-199a
hsa-miR-139
hsa-miR-196
hsa-miR-373*
hsa-miR-330
hsa-miR-337
hsa-miR-10b
hsa-miR-324-3p
hsa-miR-222
hsa-miR-184
hsa-let-7i
hsa-miR-189
hsa-miR-26b
Table 1.cont.
Reticulocyte-specific microRNAs
hsa-miR-196a
hsa-miR-19b
hsa-miR-342
hsa-miR-135a
hsa-miR-199a*
hsa-miR-200a
hsa-miR-105
hsa-miR-210
hsa-miR-107
hsa-miR-147
hsa-miR-20
hsa-miR-325
hsa-miR-98
hsa-miR-138
hsa-miR-194
hsa-miR-218
hsa-miR-23b
hsa-miR-135b
hsa-miR-137
hsa-miR-108
hsa-miR-15b
hsa-miR-211
hsa-miR-340
hsa-miR-220
hsa-mir-124b
hsa-miR-195
hsa-miR-185
hsa-miR-29a
hsa-miR-302b*
hsa-miR-95
hsa-miR-223
hsa-miR-101
hsa-miR-30c
hsa-miR-27a
higher in HbSS than in HbAA erythrocytes (Fig 3D, p,0.0001). This result suggested that HbSS erythrocytes exhibited an expression pattern closer to reticulocytes, consistent with their relatively younger age due to their shorter life span (,20 vs. 120 days) [1]. There were also many other differences in the microRNA expression patterns of HbSS and HbAA erythrocytes that may not related to differentiation stages or erythrocyte ages. The basis for these differences in microRNA expression is currently unknown.
miR-320 dysregulation and CD71 phenotypes in HbSS individuals
Although the high number of CD71 positive reticulotyces (reticulocytosis) seen in HbSS individuals is thought to reflect increased erythropoiesis in response to hemolysis, we questioned whether there might also be a defect in terminal differentiation in HbSS reticulocytes for which microRNAs play a role. CD71 (transferrin receptor) is important both in the capturing of transferrin/iron complex and the most relevant differentiation marker for the terminal differentiation. Given the importance of RNA-binding proteins in the regulation of CD71 expression at the post-transcriptional level where microRNAs typically function [21]. To test this possibility, we placed purified CD71+ reticulocytes in a previously describedin vitrodifferentiation model
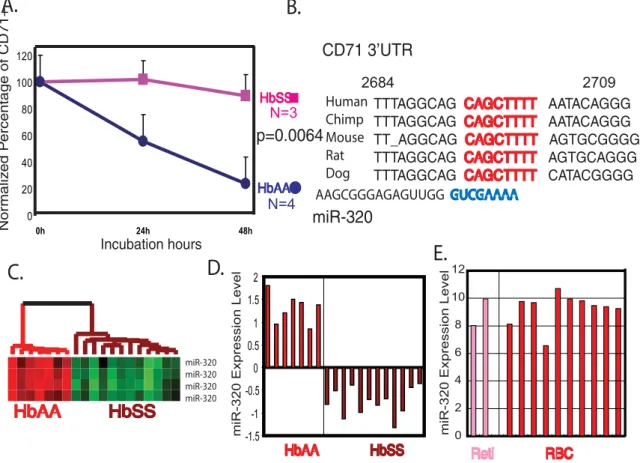
[22]. Reticulocytes from all four healthy donors underwent successful terminal differentiation within 48 hours, as evidenced by loss of surface expression of CD71, disappearance of new methylene blue staining, decrease in mean corpuscular volume (MCV) as reflected in the increase in mean corpuscular hemoglobin concentration (MCHC) (Fig 4A and Fig S1) [22,23]. In contrast, reticulocytes from all three tested HbSS individuals failed to manifest these changes of terminal differentiation; they had persistent surface expression of CD71 (p = 0.0064) and no changes in MCHC during the 48 hours of incubation (Fig 4A and Fig S1). This result indicated there was a defect in terminal differentiation in the HbSS reticulocytes and was consistent with our observation that HbSS erythrocytes appeared to have a less differentiated phenotypes.
To evaluate the potential role for dysregulated microRNAs in the defective downregulation of CD71 in HbSS reticulocytes, we used several predictive algorithms to identify the microRNAs likely to regulate the 39UTR of CD71 [24–26]. MiR-320 was predicted to regulate CD71 by all three predictive algorithms (TargetScans [24], PicTar [25] and miRanda [26]) with a perfect match between its ‘‘seed’’ sequence (59- GUCGAAAA-39, nucleotides 2– 8) and the regulatory region in the CD71 39UTR (CAGCTTTT, 2693 to 2700 of CD71 mRNA) that is conserved in five species (Fig 4B). Furthermore, the miR-320 expression level, which was
Incubation hours
Nor
maliz
ed P
ercentage of CD71+
A.
B.
CD71 3’UTR
miR-320
TTTAGGCAG CAGCTTTT CAGCTTTT AATACAGGG TTTAGGCAG CAGCTTTTCAGCTTTT AATACAGGG TT_AGGCAG CAGCTTTTCAGCTTTT AGTGCGGGG TTTAGGCAG CAGCTTTT CAGCTTTT AGTGCAGGG TTTAGGCAG CAGCTTTTCAGCTTTT CATACGGGG
Human Chimp Mouse Rat Dog
AAGCGGGAGAGUUGG GUCGAAAAGUCGAAAA
HbAA
HbAA
HbSS
HbSS
miR-320 miR-320 miR-320 miR-320
C.
D.
HbAA HbAA
HbSS HbSS
2684 2709
0 20 40 60 80 100 120
0h 24h 48h
p=0.0064
N=3
N=4
E.
-1.5 -1 -0.5 0 0.5 1 1.5 2
HbAA
HbAA HbSS HbSS miR-320 Expression Level miR-320 Expression Level
12
10
8
6
4
2
0 Reti
Reti RBC RBC
Figure 4. CD71 downregulation during terminal differentiation is defective in HbSS reticulocytes and is a potential mRNA candidate for miR-320 regulation.(A) HbSS reticulocytes exhibited defective terminal differentiation. Four purified HbAA (red) and three purified HbSS (brown) reticulocyte samples were placed in differentiation culture media containing autologous plasma. The percentage of remaining CD71+
cells (normalized against the starting CD71+percentage) after 24 and 48 hours was significantly higher for HbSS samples than HbAA samples
(p = 0.0064). (B) The target sequence (red) of the CD71 39UTR of the five indicated species was aligned with the seed sequence (blue) of miR-320. (C, D) The relative expression of miR-320 among the HbAA vs. HbSS erythrocytes is shown as heat map (C) or bar graph of centered mean expression values (D). (E) The relative expression of miR-320 in two reticulocyte (pink) and ten erythrocytes (red) samples was assessed with real-time PCR and shown.
very high in HbAA erythrocytes, was dramatically reduced in HbSS erythrocytes (Fig 4C, D), consistent with a possible role in the defective repression of CD71 seen in HbSS cells. The miR-320 expression level did not change significantly between reticulocyte and erythrocyte samples in our real-time RT-PCR analysis of HbAA cells (Fig 4E).
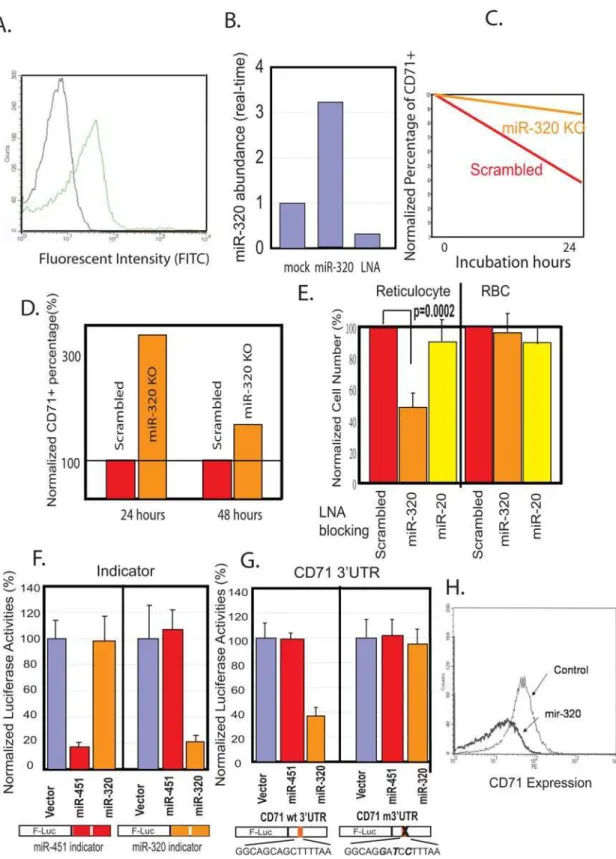
To directly test the functional role of miR-320 during terminal differentiation, we developed a transfection technique that allowed us to elevate and reduce the levels of selected microRNAs in reticulocytes. Using a modified protocol with fluorescently labeled oligonucleotides and lipofectamine, we achieved a transfection efficiency of 40–50% in both erythrocytes and reticulocytes (Fig 5A). When synthesized mature miR-320 was transfected into reticulocytes, we detected a three-fold increase in miR-320 expression with real-time RT-PCR (Fig 5B). On the other hand, the transfection of LNA antisense oligonucleotides against miR-320 led to 80% reduction in miR-miR-320 levels (Fig 5B). To investigate the function of miR-320 during reticulocyte terminal differentiation, we inhibited miR-320 function by transfecting either LNA antisense oligonucleotides against miR-320 or a scrambled sequence LNA oligonucleotide into HbAA reticulocytes before culturing them for in vitro terminal differentiation. While reticulocytes transfected with the scrambled sequence LNA oligonucleotide underwent normal CD71 downregulation, miR-320 inhibition by the antisense oligonucelotide led to a persistent high expression of CD71 (Fig 5C, D) in three separate experiments. In addition, miR-320 inhibition in reticulocytes caused significant cell death and led to fewer cell numbers when compared with cells transfected with the scrambled oligonucleotide or with miR-20a antisense oligonucleotides (Fig 5E, left). The effect was stage-specific, since mature erythrocytes were not sensitive to the same treatment (Fig 5E). These results indicated an essential role for miR-320 in maintaining erythrocyte homeostasis during terminal differentiation in normal reticulocytes. The phenotype of miR-320 inhibited normal cells resembled that of HbSS cells, including defective maturation and decreased survival. This suggested that low miR-320 expression may have a role in the dysregulated maturation and decreased cell survival seen in SCD [1].
To evaluate whether CD71 was a direct target of miR-320, we generated CMV-based expression constructs containing the miR-451 and miR-320 genomic sequences and then tested for their ability to specifically suppress expression from their respective ‘‘indicator’’ reporter constructs containing two copies of identical miR-451 or miR-320 target sequences in a specific manner (Fig 5F). A 453bp region of the CD71 39UTR (2547–2999 bp of CD71 mRNA) was then amplified and placed downstream of the luciferase reporter gene (Fig 5G). When this reporter construct was co-transfected into K562 cells with expression constructs encoding miR-320, miR-451 or empty vectors, we found that only miR-320, but not miR-451 or empty vectors, repressed its activity (Fig 5G, left). This miR-320-mediated repression was dependent on the predicted miR-320 target site in the CD71 39UTR since a three base pair change in this site abolished miR-320-mediated repression (Fig 5G, right). Collectively, these results indicated that CD71 was a direct target of miR-320 via the interaction between its 39UTR and the miR-320 seed sequence.
To further validate the miR-320/CD71 interaction, we overexpressed miR-320 in K562 cells and examine their influence on surface CD71 expression. Overexpression of miR-320 in K562 cells led to a significantly lower level of CD71 when compared with control transfection with empty vectors (Fig 5H). Taken together, these results showed that miR-320 can directly regulate the expression of CD71 and suggested that the poor expression of miR-320 in HbSS cells is associated with their persistently high
CD71 level during terminal differentiation. In addition to CD71, miR-320 was also predicted by TargetScanS [24] and PicTar to target other mRNAs (Table S1, S2 [1]), including ETS2 (v-ets erythroblastosis virus E26 oncogene homolog 2) and EPB41L5 (erythrocyte membrane protein band 4.1 like 5), two mRNA encoding proteins important for erythrocyte biology
Discussion
In this study, we have presented several lines of evidences for the presence of diverse microRNA in the mature erythrocytes. In gene expression studies of enucleated cells with low RNA content (such as erythrocytes, reticulocytes and platelets) [2,9,27,28], one important concern is that a minority of contaminating nucleated cells with high RNA content (leukocytes) may distort the observed gene expression patterns. We do not believe that such contam-ination has significantly affected this study, because of the following observations. First, we have employed two different purification schemes, composed of three levels of cell separation based on cell density and surface expression to remove most leukocytes, platelets and reticulocytes, to obtain the mature erythrocytes used for expression analysis. We confirmed the purity of the resulting mature erythrocytes by FACS, methylene blue staining and molecular analysis of isolated RNAs. Second, the size distribution and characteristics of the isolated erythrocyte RNAs were significantly different from that of all nucleated cells– uniquely enriched for small RNA species without prominent bands of ribosomal RNAs. Third, when microRNAs from whole blood were compared with leukocytes and mature erythrocytes, the expression pattern of whole blood, even without leukocyte depletion, was derived mainly from erythrocytes instead of leukocytes. The microRNA expression pattern of mature eryth-rocytes was also different from reticulocytes using microRNA real-time RT-PCR assays. Taken together, these results indicate that the expression of these microRNAs is indeed from mature erythrocytes and not from other ‘‘contaminating’’ cells. Knowl-edge of erythrocyte microRNA is also important to investigators who are interested in leukocyte microRNAs, as it is now clear that they must avoid the significant and unexpected bias caused by erythrocyte microRNAs.
The selective presence of these microRNAs in these post-mitotic erythrocytes may be due to the longer half-life and slower decay kinetics of specific microRNAs. Our results indicated that microRNAs still exist in the functional form in reticulocytes, consistent with previous study [30]. The immediate precursor of reticulocytes, orthochromatic normoblasts, still contains nuclei. Since the reticulocyte stage lasts for 40 hours [1], it is conceivable that the reticulocyte microRNA synthesized in the orthochromatic normoblast become processed, fed into the maturation pathways and persist in a functional form in reticulocytes. These microRNAs may persist in the mature erythrocytes after the terminal differentiation.
The main functional mechanism of microRNAs is through the post-transcriptional regulation of their target mRNA via mRNA degradation or translation inhibition [11]. What are the potential roles for microRNAs in mature erythrocytes, a cell type with limited target mRNA and translation activity? What is the clinical relevance for genomic analysis of erythrocyte microRNAs? First, these erythrocyte microRNAs are likely to play important regulatory roles during the earlier stages of erythropoiesis, as late as the reticulocyte. Translational activities are still present in the reticulocyte stage, and our results also clearly demonstrate a functional role of microRNAs in these cells during terminal differentiation of reticulocytes. This observation are consistent with a recent study of recapitulating the microRNA-mediated translation repression in reticulocyte cell lysates [30]. Thus, the microRNA composition captured in circulating erythrocytes is the balance between microRNA accumulation from earlier differentia-tion stages and the subsequent microRNA decay in the remaining erythrocytes exposed to various physiological and pathological conditions. Many other studies have highlighted the functional importance of several microRNAs (e.g. miR-221, -222, -451 and -24) during various stages of erythroid differentiation [16,20,31]. Second, erythrocyte microRNAs may play a direct role in the de-adenylation and degradation of mRNA during erythrocyte terminal differenti-ation as suggested by several studies [32–34]. Third, it is possible that microRNAs play a role in the host-pathogen interaction between erythrocyte and malaria parasites, given that human microRNAs are found in the malaria parasitesP. falciparum[8]. Similar involvement of microRNAs in the host-pathogen interaction was shown for host microRNAs affecting the growth and propagation of pathogen [35,36] as well as pathogen-encoded microRNAs impacting host cellular physiology [37–39]. In our analysis, HbSS erythrocytes have a very high level of miR-451, which was found be translocated intoP. falciparum.This observation leads to the possibility that microRNA composition may contribute to the malaria resistance notes for sickle cell erythrocytes [40,41]. Finally, microRNAs may have additional functional roles in erythrocytes via a mechanism independent of mRNA targeting as suggested in our observation that the blockage of mIR-320 leads to decreased erythrocyte survival.
The differential expression of erythrocyte microRNA may also lead to novel insights into human erythrocyte diseases. We observed a dramatic and significant difference between microRNA expres-sions in mature HbSS and HbAA erythrocytes; partly because of HbSS erythrocytes are younger than HbAA erythrocytes in their microRNA expression pattern, consistent with their shorter life span. These differences are likely to provide additional information about the disease phenotypes, similar to the miR-320::CD71 connection established in our current study. Linkage of particular microRNAs to particular SCD disease phenotypes offers the potential not only to develop useful biomarkers as suggested in a recent review [42], but also to generate testable biological hypotheses and relevant pathological insights based on these microRNAs and their predicted target mRNAs. This line of research can lead to an enhanced
understanding of the relevant pathophysiological mechanisms as well as suggest treatments tailored for individual patients. It is important to expand these studies to a larger cohort of patients with detailed analysis of their biochemical parameters and clinical phenotypes to determine the robustness and stability of the various subtypes and their connection with genetic polymorphisms and other genetic parameters. We expect that similar use of microarrays and advanced bioinformatics will greatly enhance our understanding of patho-physiological mechanisms in various erythroid diseases involving abnormal genetic regulation of erythropoiesis (i.e., aplastic anemia or polycythemia vera), as well as erythrocyte-related dysfunction or hemoglobinopathies (i.e., hemolytic anemia, sickle cell disease).
Without novel mRNA synthesis, post-transcriptional regulation is probably the main mechanism for gene regulation in enucleated cells (reticulocytes, platelets, and erythrocytes). Given the pro-grammed transcriptional arrest with nuclear exclusion in devel-oping erythroid cells, significant gaps sometimes exist between the time of mRNA synthesis and actual translation. RNA stability and translation control are therefore tightly regulated to ensure proper control of RNA stability and protein synthesis [43], both of which are likely to be regulated by microRNAs. For example, the post-transcriptional control of CD71 is mediated by the actions of iron regulatory proteins (IRP1 and IRP2) in response to iron levels [21]. The loss of surface expression of CD71 during erythrocyte terminal differentiation was thought to be caused by its release/ secretion by exosomes [44]. Our findings suggest that microRNAs are also involved in the reticulocyte terminal differentiation process. Since miR-320 expression does not change during the transition between reticulocyte and erythrocytes, its upregulation is not likely to be a trigger for the loss of CD71 expression. Instead, miR-320 is likely to fine tune the translational activities of CD71 in reticulocytes and contribute to its loss of CD71 surface expression together with the exosome release. MicroRNA-mediated repres-sion can also be regulated by interactions between miRNA/ Argonaute complexes with RNA-binding proteins that relocate from different subcellular compartments during stress or differen-tiation [45]. Many additional mRNAs encode proteins with important regulatory roles in erythropoiesis are also predicted targets of erythrocyte microRNAs [24] and their interactions deserve further exploration in the context of various physiological and pathological adaptations of erythrocyte diseases.
Materials and Methods
Human blood collection, mature erythrocyte purification and cell lines
expression of CD235a (glycophorin A), CD71 (transferrin receptor), CD16 (FccRIII) and CD45 (LCA) with fluorescently labeled antibodies (Pharmingen, CA). To obtain reticulocytes used for terminal differentiation assays and gene expression studies, packed erythrocytes obtained from leukocyte-removal filtrate were incubated with CD71-MACS beads (Miltenyi). After washing with staining buffer (Hanks’ balanced salt solution with 2% FCS and 0.02% NaN3), CD71+reticulocytes were enriched with autoMACS by POSSEL_S mode, immunostained with FITC-conjugated CD71 antibodies and positive cells sorted by FACS. The K562 cells (from Dr. Murat Arcasoy) were maintained in RPMI supplemented with 10% fetal calf serum, glutamine and antibiotics.
RNA extraction, electrophoresis, RT-PCR analysis, and Northern blot analysis. Total RNA was extracted using the mirVana microRNA Isolation Kit (Ambion, TX). For northern blot analyses, 20mg of total RNA were separated in 15% TBE-urea polyacrylamide gel (Bio-Rad, CA), and electro-transferred onto Hybond-N+(Amersham Biosciences, UK) membranes. The blot was then probed with end-labeled DNA probes complementary to each indicated microRNAs or U6 RNA in Express-hyb buffer (Clontech, CA) at 37uC.
Analysis of microRNA expression by microarrays
For microRNA expression profiling by microarray, total RNA samples were size-fractionated and cleaned with the flashPAGE Fractionator (Ambion, TX) to collect RNAs smaller than 40 nucleotides. These samples then were labeled with the mirVana microRNA Labeling Kit (Ambion) according to the manufacture’s instructions [46]. Erythrocyte and K562 small RNAs were labeled with Cy5; while 293T small RNAs were labeled with Cy3 as common reference for all samples. The fluorescently labeled microRNAs were mixed with 36microRNA Hybridization Buffer (Ambion) and heated at 95uC for 3 min before hybridizing with the printed microRNA microarrays for 12–16 h in a 42uC water bath in sealed cassettes. Following hybridization, the slides were washed, dried and scanned on a GenePix 4000B Array Scanner (Axon, CA). Array images were analyzed using the GenePix Pro 5.0 software (Axon) and submitted into the Duke Microarray Database (DMD). Data were normalized globally per array, such that the average LogRatio was 0 after normalization. All data used for analysis had an average intensity 2.5 fold above local background, and a regression ratio.0.6 before further filtering based on indicated variations among different samples. Hierar-chical clustering was performed by average linkage using uncentered Pearson correlation [47]. Microarray data has been submitted into GEO database with accession number GSE11060 and available on the supplemental website (URL: http://data. genome.duke.edu/RBC).
Expression profiling of microRNA using multiplexing RT-PCR assays
The 192-plex RT-PCR assays that were developed for profiling of 192 individual human microRNAs were used to perform microRNA profiling with 30 ng of total RNA from each RBC/ reticulocyte samples following the three-step protocols described previously [17]. Briefly, step 1 is a multiplexed reverse transcrip-tion reactranscrip-tion which reverse transcribes targeted microRNAs into cDNAs in a single reaction using 192 microRNA-specific stem-loop RT primers; step 2 is a multiplexed PCR reaction with 192 sets of microRNA-specific forward primers and a universal reverse primer that amplifies the cDNA products to provide enough samples for step 3. Linear amplification was achieved with 14 PCR cycles. Step 3 is done as simultaneous, individual single-plex TaqManHreal-time PCR reactions to monitor the abundance of
each microRNAs after the multiplexed RT-PCRs. Real-time PCR was performed on an AB 7900 HT Sequence Detection System in a 384-well plate format, with the temperature regime consisting of a hot start at 95uC for 10 min, followed by 40 amplification cycles composed of 95uC for 15 s, and 60uC for 1 min. The real-time PCRs for each microRNAs were run in duplicates. Out of 192 microRNA targets, only 189 assays lead to expression information since three assays (miR-16, -124a and -130b) had technical issues and were not included in the analysis. MiR-152 was chosen as the endogenous control for normalization across different samples based on two reasons: 1) the level of miR-152 does not change during erythroid differentiation [14]; 2) has-miR-152 showed the least standard deviation (Stdev = 0.68) across 40 tissues in a global microRNA profiling study using 210 microRNA TaqMan assays (Applied Biosystems, unpublished data). A2DCt ( = Ct_microR-NA2Ct_miR-152, Ct: cycle of threshold) was calculated as an equivalent of normalized relative gene expression level for the microRNAs being analyzed and used for hierarchical clustering.
In vitro maturation assays of reticulocytes and miR-320 knockdown
The reticulocytein vitromaturation assay was described previously [22]. The CD71+young reticulocytes were isolated from leukode-pletion-filtered erythrocytes with CD71 microbeads using auto-MACStm Separator. Flow cytometry and new Methylene Blue staining was performed to determine the purity of the isolated cells. The purified reticulocytes were then cultured in RPMI supplement-ed with 10% fetal bovine serum and 50% autologous plasma in a humidified atmosphere of containing 5% CO2. Locked Nucleic Acid (LNA) oligonucleotides against miR-320, mir-20a and scrambled control sequence (Exiqon, Denmark) were individually diluted in Opti-MEM and mixed with diluted Lipofectamine 2000 (Invitrogen) for 30 min at room temperature before transfecting into reticulocytes at a final concentration of 33 nM. Transfection medium was replaced 6 hours post-transfection with the differentiation media composed of RPMI containing 10% FCS and 50% autologous plasma. CD71 expression levels of transfected cells were analyzed by FACS at indicated time after transfection.
Cloning of CD71 reporter constructs and luciferase assays
constructs, all combined with Lipofectamine 2000 (Invitrogen). After 48 hour, the transfected cells were washed and lysed with the passive lysis buffer (Promega). The luciferase activities (both firefly and renilla luciferase) present in the cell lysates were then determined by Luminometer (Berthold Technology, Germany). The relative reporter activities were obtained by normalization of firefly to the renilla luciferase activities determined in the same lysates with the Dual-Glo Luciferase Assay (Promega).
Supporting Information
Figure S1 The percentage change of indicated parameters (MHC, MCHC) compared with the corresponding parameter at time zero during the process of terminal differentiationin vitro. Found at: doi:10.1371/journal.pone.0002360.s001 (0.76 MB EPS)
Table S1 The mRNA targets for miR-320 predicted by TargetScanS.
Found at: doi:10.1371/journal.pone.0002360.s002 (0.33 MB XLS)
Table S2 The mRNA targets for miR-320 predicted by PicTar Found at: doi:10.1371/journal.pone.0002360.s003 (0.62 MB XLS)
Acknowledgments
We are grateful to Drs. Joseph Nevins and Hunt Willard for helpful discussions of the manuscript and to Dr. Laura DeCastro, Dr. Holly Dressman, Robert Blick and Mark Delong for support on sampling and array performance. Jianli Wu, Joseph Reardon, Anil Potti, David Hsu, Chia-Lin Hsu, Thusitha Dissanayake and Jer-Chang Chan provided technical assistance. Kaiqin Lao and Eva Gottwein kindly provided the reagents for microRNA real-time assays. J.T.C is an IGSP Genome Scholar.
Author Contributions
Conceived and designed the experiments: MT JC SC. Performed the experiments: JC SC. Analyzed the data: YW MT JC. Contributed reagents/materials/analysis tools: YW. Wrote the paper: MT JC.
References
1. Hoffman R, Benz EJB, Shattil SJ, Furie B, Cohen HJ, et al. (2004) Hematology: Basic Principles And Practice: Churchill Livingstone. .
2. Goh SH, Lee YT, Bouffard GG, Miller JL (2004) Hembase: browser and genome portal for hematology and erythroid biology. Nucleic Acids Res 32: D572–574.
3. Harrison T, Samuel BU, Akompong T, Hamm H, Mohandas N, et al. (2003) Erythrocyte G Protein-Coupled Receptor Signaling in Malarial Infection. Science 301: 1734–1736.
4. Zennadi R, Hines PC, De Castro LM, Cartron JP, Parise LV, et al. (2004) Epinephrine acts through erythroid signaling pathways to activate sickle cell adhesion to endothelium via LW-alphavbeta3 interactions. Blood 104: 3774–3781.
5. Linda G, Lee C-HCLAC (1986) Thiazole orange: A new dye for reticulocyte analysis. Cytometry 7: 508–517.
6. Rainen L, Oelmueller U, Jurgensen S, Wyrich R, Ballas C, et al. (2002) Stabilization of mRNA Expression in Whole Blood Samples. Clin Chem 48: 1883–1890.
7. Whitney AR, Diehn M, Popper SJ, Alizadeh AA, Boldrick JC, et al. (2003) Individuality and variation in gene expression patterns in human blood. Proc Natl Acad Sci U S A 100: 1896–1901.
8. Rathjen T, Nicol C, McConkey G, Dalmay T (2006) Analysis of short RNAs in the malaria parasite and its red blood cell host. FEBS Lett 580: 5185–5188. 9. Bahou WF, Gnatenko DV (2004) Platelet transcriptome: the application of
microarray analysis to platelets. Semin Thromb Hemost 30: 473–484. 10. Zen Q, Batchvarova M, Twyman CA, Eyler CE, Qiu H, et al. (2004) B-CAM/
LU expression and the role of B-CAM/LU activation in binding of low- and high-density red cells to laminin in sickle cell disease. Am J Hematol 75: 63–72. 11. Bartel DP (2004) MicroRNAs: genomics, biogenesis, mechanism, and function.
Cell 116: 281–297.
12. Shingara J, Keiger K, Shelton J, Laosinchai-Wolf W, Powers P, et al. (2005) An optimized isolation and labeling platform for accurate microRNA expression profiling. Rna 11: 1461–1470.
13. Chen CZ, Li L, Lodish HF, Bartel DP (2004) MicroRNAs modulate hematopoietic lineage differentiation. Science 303: 83–86.
14. Lu J, Getz G, Miska EA, Alvarez-Saavedra E, Lamb J, et al. (2005) MicroRNA expression profiles classify human cancers. Nature 435: 834–838.
15. Choong ML, Yang HH, McNiece I (2007) MicroRNA expression profiling during human cord blood-derived CD34 cell erythropoiesis. Exp Hematol 35: 551–564.
16. Zhan M, Miller CP, Papayannopoulou T, Stamatoyannopoulos G, Song CZ (2007) MicroRNA expression dynamics during murine and human erythroid differentiation. Exp Hematol 35: 1015–1025.
17. Lao K, Xu NL, Yeung V, Chen C, Livak KJ, et al. (2006) Multiplexing RT-PCR for the detection of multiple miRNA species in small samples. Biochem Biophys Res Commun 343: 85–89.
18. Tang F, Hajkova P, Barton SC, Lao K, Surani MA (2006) MicroRNA expression profiling of single whole embryonic stem cells. Nucleic Acids Res 34: e9. 19. Tusher VG, Tibshirani R, Chu G (2001) Significance analysis of microarrays
applied to the ionizing radiation response. Proc Natl Acad Sci U S A 98: 5116–5121.
20. Felli N, Fontana L, Pelosi E, Botta R, Bonci D, et al. (2005) MicroRNAs 221 and 222 inhibit normal erythropoiesis and erythroleukemic cell growth via kit receptor down-modulation. Proc Natl Acad Sci U S A 102: 18081–18086. 21. Eisenstein RS (2000) Iron regulatory proteins and the molecular control of
mammalian iron metabolism. Annu Rev Nutr 20: 627–662.
22. Skadberg O, Brun A, Sandberg S (2003) Human reticulocytes isolated from peripheral blood: maturation time and hemoglobin synthesis. Lab Hematol 9: 198–206.
23. Birney E, Andrews D, Bevan P, Caccamo M, Cameron G, et al. (2004) Ensembl 2004. Nucleic Acids Res 32 Database issue: D468–470.
24. Lewis BP, Burge CB, Bartel DP (2005) Conserved seed pairing, often flanked by adenosines, indicates that thousands of human genes are microRNA targets. Cell 120: 15–20.
25. Krek A, Grun D, Poy MN, Wolf R, Rosenberg L, et al. (2005) Combinatorial microRNA target predictions. Nat Genet 37: 495–500.
26. John B, Enright AJ, Aravin A, Tuschl T, Sander C, et al. (2004) Human MicroRNA targets. PLoS Biol 2: e363.
27. Miller JL (2004) A genome-based approach for the study of erythroid biology and disease. Blood Cells Mol Dis 32: 341–343.
28. Gnatenko DV, Dunn JJ, McCorkle SR, Weissmann D, Perrotta PL, et al. (2003) Transcript profiling of human platelets using microarray and serial analysis of gene expression. Blood 101: 2285–2293.
29. Georgantas RW 3rd, Hildreth R, Morisot S, Alder J, Liu CG, et al. (2007) CD34+hematopoietic stem-progenitor cell microRNA expression and function: a circuit diagram of differentiation control. Proc Natl Acad Sci U S A 104: 2750–2755.
30. Wang B, Love TM, Call ME, Doench JG, Novina CD (2006) Recapitulation of short RNA-directed translational gene silencing in vitro. Mol Cell 22: 553–560. 31. Wang Q, Huang Z, Xue H, Jin C, Ju XL, et al. (2007) MicroRNA miR-24
inhibits erythropoiesis by targeting activin type I receptor ALK4. Blood. 32. Farh KK, Grimson A, Jan C, Lewis BP, Johnston WK, et al. (2005) The
widespread impact of mammalian MicroRNAs on mRNA repression and evolution. Science 310: 1817–1821.
33. Giraldez AJ, Mishima Y, Rihel J, Grocock RJ, Van Dongen S, et al. (2006) Zebrafish MiR-430 Promotes Deadenylation and Clearance of Maternal mRNAs. Science.
34. Wu L, Fan J, Belasco JG (2006) From the Cover: MicroRNAs direct rapid deadenylation of mRNA. Proc Natl Acad Sci U S A 103: 4034–4039. 35. Jopling CL, Yi M, Lancaster AM, Lemon SM, Sarnow P (2005) Modulation of
hepatitis C virus RNA abundance by a liver-specific MicroRNA. Science 309: 1577–1581.
36. Lecellier CH, Dunoyer P, Arar K, Lehmann-Che J, Eyquem S, et al. (2005) A cellular microRNA mediates antiviral defense in human cells. Science 308: 557–560.
37. Browne EP, Li J, Chong M, Littman DR (2005) Virus-host interactions: new insights from the small RNA world. Genome Biol 6: 238.
38. Pfeffer S, Zavolan M, Grasser FA, Chien M, Russo JJ, et al. (2004) Identification of virus-encoded microRNAs. Science 304: 734–736.
39. Gottwein E, Mukherjee N, Sachse C, Frenzel C, Majoros WH, et al. (2007) A viral microRNA functions as an orthologue of cellular miR-155. Nature 450: 1096–1099.
40. Pasvol G, Weatherall DJ, Wilson RJ (1978) Cellular mechanism for the protective effect of haemoglobin S against P. falciparum malaria. Nature 274: 701–703.
41. Friedman MJ (1978) Erythrocytic mechanism of sickle cell resistance to malaria. Proc Natl Acad Sci U S A 75: 1994–1997.
42. Zhang B, Farwell MA (2008) microRNAs: a new emerging class of players for disease diagnostics and gene therapy. J Cell Mol Med 12: 3–21.
44. Johnstone RM, Bianchini A, Teng K (1989) Reticulocyte maturation and exosome release: transferrin receptor containing exosomes shows multiple plasma membrane functions. Blood 74: 1844–1851.
45. Leung AK, Sharp PA (2007) microRNAs: a safeguard against turmoil? Cell 130: 581–585.
46. Shingara J, Keiger K, Shelton J, Laosinchai-Wolf W, Powers P, et al. (2005) An optimized isolation and labeling platform for accurate microRNA expression profiling. RNA 11: 1461–1470.

![Table 1). These reticulocyte-enriched microRNAs included microRNAs of the let-7 family as well as miR-221 and miR-222, two microRNAs whose downregulation during erythroid differ-entiation is essential this process [20].](https://thumb-eu.123doks.com/thumbv2/123dok_br/18348146.352744/5.918.100.641.81.859/reticulocyte-micrornas-micrornas-micrornas-downregulation-erythroid-entiation-essential.webp)