Crystallization Kinetics of Fe-B Based Amorphous Alloys Studied
in-situ
using X-rays Diffraction and Differential Scanning
Calorimetry
D.R. dos Santosa*, D.S. dos Santosb
a
Universidade Estadual do Norte Fluminense / CCT-LCFis, Campos dos Goytacazes - RJ, Brazil
b
Universidade Federal do Rio de Janeiro / PEMM-COPPE, Rio de Janeiro - RJ, Brazil
Received: November 22, 2000; Revised: January 16, 2001
The crystallization processes for the amorphous metallic alloys Fe74B17Si2Ni4Mo3 and Fe86B6Zr7Cu1(at. %) were investigated using X-rays diffraction measurements performedin-situ
during Joule-heating, with simultaneous monitoring of the electrical resistance. We determined the main structural transitions and crystalline phases formed during heating, and correlated these results to the observed resistance variations. As the annealing current is increased, the resistance shows an initial decrease due to stress relaxation, followed by a drop to a minimum value due to massive nucleation and growth of α-Fe nanocrystals. Further annealing causes the formation of small fractions of Fe-B, B2Zr or ZrO2, while the resistance increases due to temperature enhancement.In situXRD measurements allowed the identification of metastable phases, as theγ-Fe phase which
occurs at high temperatures. The exothermal peaks observed in the differential scanning calorimetry (DSC) for each alloy corroborate the results. We also have performed DSC measurements with several heating rates, which allowed the determination of the Avrami exponent and crystallization activation energy for each alloy. The obtained activation energies (362 and 301 kJ/mol for Fe-B-Zr-Cu; 323 kJ/mol for Fe-B-Si-Ni-Mo) are comparable to reported values for amorphous iron alloys, while the Avrami exponent values (n= 1.0 orn= 1.2) are consistent with diffusion controlled crystallization processes with nucleation rates close to zero.
Keywords:crystallization kinetics, iron alloys, X-rays, DSC
1. Introduction
Great scientific effort has been developed in last years in order to predict and control the crystallization processes of metallic glasses, since several attractive properties of the resulting material are strongly related to the final attained microstructure. For instance, it has been shown that the nanocrystalline structure presented by Fe-Cu-Nb-Si-B al-loys annealed at 813 K during 1 h is responsible for their
excellent soft-magnetic properties1,2. A similar behavior is
observed for alloys of the Fe-B-Zr-Cu family3,4. Several
techniques have been applied to the study of crystallization processes in glassy metals, such as ferromagnetic
reso-nance5,6, differential scanning calorimetry7,8, Mössbauer
spectroscopy9, small angle X-rays scattering10,11, and
elec-trical resistance variations12,13. On the other hand, there is
an increasing number of studies which use synchrotron
radiation sources, whose high intensity allowin-situ
meas-urements to follow structural evolutions in real time. Joule heating (JH) is a fast and highly reproducible annealing technique for amorphous metallic ribbons. It is worth noticing that it is a non-isothermal treatment, since the temperature in the sample depends on its resistivity, which, in turn, depends on the sample’s microstructure, that undergoes transformations upon heating, thus changing the temperature itself. A theoretical model that relates the structural transformations to the electrical resistance vari-ations during Joule heating at a constant applied dc current
was proposed by Allia et al., and used to estimate the
temperature variations in an Fe-Ni-P-B alloy14,15.
Measure-ments of the temperature evolution of Fe-B-Zr-Cu alloys during Joule annealing have been recently reported, show-ing a continuous temperature increase as the annealshow-ing
current is linearly enhanced16.
e-mail: drsantos@uenf.br
As regards the crystallization kinetics during isothermal treatments, the time evolution of the crystalline volume
fraction,fv, is given by the Johnson-Mehl-Avrami equation:
fv= 1 - exp(-Ktn) (1)
whereKandnare time-independent parameters. A simple
manipulation of Eq. (1) shows that, K and n can be
determined by plotting the measured data,fv, as:
ln[-ln(1-fv)] = lnK+nlnt (2)
In the case of continuous heating, it can be shown that forE>>RTthe following relations are true7,17,18:
β E
KpRT2p=
1 (3)
(dxdt) =0,37nKp (4)
d[ ln(T
2 p
β )]
d[ 1 Tp
] =
E
R (5)
whereβis the heating rate,Eis the activation energy,Ris
the gas constant,nis the Avrami exponent and the indexp
refers to the variables at a crystallization peak,i.e.,Tpis the
temperature of a peak,Kpis the rate constant at the peak
and (dx/dt)pis the crystallization rate at the peak. IfTp2/βis measured in a series of exothermals taken at different
heating rates, the plot ofln (Tp2/β)as a function of 1/Tp
should be a linear function with slope E/R. The set of
equations given by Eqs. 3 and 4 can then be used to
determine the Avrami exponentnas an average of the set
of parameters obtained for different heating rates.
In the present work, we investigate the crystallization process of two Fe-based amorphous metallic alloys, using
X-rays diffraction (XRD) measured in-situ during Joule
annealing, and simultaneously monitoring the electrical resistance variations. DSC measurements with different heating rates were also performed in order to determine important crystallization parameters, such as the activation energy and the Avrami exponent.
2. Experimental Procedures
The amorphous alloys of nominal composition
Fe74B17Si2Ni4Mo3 andFe86B6Zr7Cu1(at. %) were rapidly quenched from the melt by planar flow on a fast rotating cylinder, producing high quality metallic ribbons of
thick-ness 25±1µm. Samples cut from each amorphous alloy
were submitted to JH with an effective length of 10 mm between electrical contacts. The sample was firmly clamped at both ends by two pairs of electrical contacts, using a sample holder specially designed to minimize
con-duction thermal losses and keep the ribbon perpendicular to the X-ray beam, allowing for sample expansion during heating. The applied dc current was varied from 0 to 3.0 A while the voltage drop across the sample was measured via two independent contacts. The heating procedure was com-puter controlled, thus allowing the on-line analysis of the
R(I)curve. During annealing, the sample was kept in
vac-uum (10-2mbar) to avoid oxidation and minimize
convec-tive thermal losses.
It was shown in a previous work that for a constant applied current the structural changes occur during the initial 10 s (see Fig. 1 in Ref. 12). Consequently, in the case of a step by step enhancement of the annealing current each
increment∆I should be applied after a minimum waiting
time ∆tmin= 10 s. For longer time intervals one obtains
reproducibleR(I)curves, suggesting that the crystallization
process is also reproduced. Using the characteristic R(I)
curve as a guide, different current values were selected for
in situmeasurements of X-ray diffraction intensities. For
each thermal treatment we performed 12 sequential expo-sures, where XRD patterns were registered on a curved
Imaging Plate in the angular range 10°≤2θ ≤152°. The
experimental setup forin situXRD measurements requires
detector displacement between film expositions, so we
selected long time intervals ∆t = 450 s for each current
increment∆I = 0.1 A. After waiting 20 s for temperature
stabilization in the sample, the remaining 430 s were used for recording XRD spectra. These measurements were car-ried out at the SAXS beam-line of the LNLS – National
Synchrotron Light Laboratory, Brazil19,20. The wavelength
λ= 1.7574 Å was selected in order to minimize the
attenu-ation factor and fluorescence from Fe atoms in the samples, and the beam dimensions over the sample were
0.8 x 3.0 mm. Diffraction curves from a standard Al2O3
powder with controlled grain size (1µm) were measured at
room temperature in the same experimental geometry for
2θcalibration. The average grain size was calculated from
the full width at half maximum of the 110α-Fe reflection,
using the Scherrer formula (for details see Ref. 12). DSC measurements were performed on a Shimadzu D-50 calorimeter from room temperature to 1000 K, using heating rates of 2, 5, 10, 20 and 30 K/min. Some treatments were interrupted at particular temperatures, and XRD pat-terns were obtained at room temperature using a Siemens D5000 diffractometer, in order to evaluate the correspond-ing stage of crystallization. There is a great similarity between JH and DSC heating procedures, since both are non-isothermal treatments. As the applied current is
in-creased the sample temperature continuously increases16.
On the other hand, the connection between the applied JH
heating rate ∆I /∆t and the resulting temperature rate
∆T /∆t should be experimentally determined, since it
the thermal losses. In Ref. 16, for example, it was shown that a Joule heating rate of 0.003 A/s produced an average temperature rate of 50 K/min for Fe-B-Zr-Cu ribbons.
3. Results and Discussion
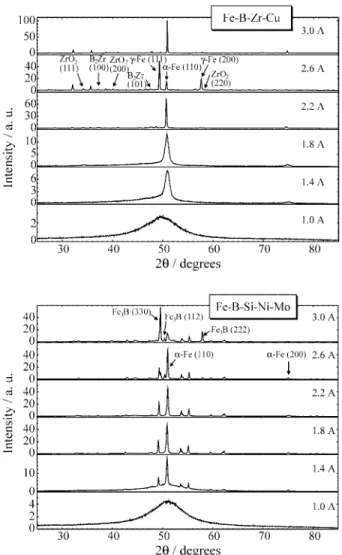
Figure 1 presents XRD spectra obtained at different
annealing currents. Figure 2 shows the correspondingR(I)
curves, where solid dots represent the points selected for
exposure to X-rays. The electrical resistanceRshowed a
typical behavior as a function of the applied current, and
very similarR(I)curves were obtained for both alloys. For
the Fe-B-Zr-Cu alloy, the typicalR(I) curve initially
de-creases, then presents a slow increase up to about 1.1 A. In this range the sample is still amorphous, thus the initial resistance decrease is interpreted as internal stress relaxa-tion in the as-quenched material, followed by a resistance increase due to a temperature enhancement. Further anneal-ing causes a resistance drop to a minimum at 1.7 A, while
XRD spectra show the nucleation and growth of α-Fe
nanocrystals, with grain sizes of about 10 nm, and increas-ing crystalline volume fraction in this current range. Durincreas-ing the massive Fe crystallization the resistance is reduced down to a minimum, and then the samples presents a new metallic behavior with a rapid temperature increase due to
a larger thermal coefficient of resistance (TCR)13,16. A
similar behavior was observed for the Fe-B-Si-Ni-Mo al-loy, with the beginning of structural ordering shifted to a higher current value (1.4 A), and the formation of larger
α-Fe grains, about 40 nm in size.
In the case of Fe-B-Si-Ni-Mo samples, evolution of
α-Fe phase occurs simultaneously with the formation of
metastable Fe2B, which for more severe heating conditions
transforms into a stable Fe3B phase. On the other hand, in
the case of Fe-B-Zr-Cu samples small fractions of ZrO2(at
1.6 A) and B2Zr (at 2.0 A) were observed, which do not
show a significant intensity evolution from 2.0 to 3.0 A. In
addition an allotropic transition fromα-Fe (bcc) to aγ-Fe
(fcc) phase was observed at a high value of applied current (2.4 A). This process was found to be of a transient nature for 450 s step conditions, probably due to thermal losses
since for a faster heating rate (∆t = 150 s) it was found to
be permanent up to applied currents of 3.0 A. For all the identified phases, the diffraction profiles were simulated and fitted to the experimental data, yielding lattice parame-ters about 1.1 % larger than the room temperature values.
Figure 3 shows DSC curves for both Fe-B-Zr-Cu and Fe-B-Si-Ni-Mo amorphous metallic alloys, obtained at a heating rate of 30 K/min. Samples of the Fe-B-Zr-Cu alloy present two distinct exothermal peaks, and this behavior is independent of the applied heating rate (2, 5, 10, 20 or 30 K/min). On the other hand, the crystallization of Fe-B-Si-Ni-Mo samples followed different kinetics according to the applied heating rate, as described below.
Figure 1.Evolution of the X-ray diffraction intensities measuredin-situ
during Joule heating. At 1.0 A the samples are still amorphous. The crystalline phases are indicated, with the corresponding peak indexes.
DSC curves for annealing at 2 K/min showed three peaks, the first one being the most intense, suggesting a crystallization process with three well resolved exothermal reactions. For annealing at 5 K/min, however, only two exothermal peaks were detected, the first one being again the most intense. For faster annealing conditions (heating rate equal or superior to 10 K/min) DSC curves presented only one peak, suggesting that all the structural transitions occur simultaneously at about the same temperature. Equa-tions 3 to 5 were applied to our DSC scans in order to
determine the crystallization activation energyE and the
Avrami exponent n, which depends on the predominant
crystallization mechanism. Figure 4 shows the plots
ob-tained forln (Tp2/β) vs. 1/Tpand the linear functions used
in the determination of the activation energies for both alloys. For the Fe-B-Zr-Cu alloy it was possible to evaluate the crystallization parameters for each independent exothermal reaction, and the results are presented in Tables 1 and 2.
The obtained values of the Avrami exponent were
n = 1.0 for Fe-B-Si-Ni-Mo and for the first reaction in
Fe-B-Zr-Cu alloy, while the second reaction presented a
slightly larger value,n= 1.2. These results are consistent
with a diffusion controlled crystallization process, with
nucleation rate near zero21. The obtained activation
ener-gies are comparable to previously reported values for sev-eral amorphous metallic alloys submitted to isothermal
Figure 3.Differential scanning calorimetry curves obtained at a heating rate of 30 K/min
Table 1.Crystallization parameters ofFe86B6Zr7Cu1measured by DSC.
β(K/min) n1 n2 <n1> <n2> E1(kJ/mol) E2(kJ/mol)
2 0.89
-5 0.93 1.18
10 0.97 1.19 1.0 1.2 362±14 301±20
20 0.99 1.20
30 1.02 1.34
Table 2.Crystallization parameters ofFe74B17Si2Ni4Mo3measured by
DSC.
β(K/min) N <n1> E1(kJ/mol)
2 0.98
5 1.00
10 1.01 1.0 323±16
20 1.06
30 1.07
annealing.5,6,8 This result shows that, though DSC tech-nique demands a continuous heating of the sample, it is a suitable technique for studies on the crystallization kinetics of these materials.
4. Conclusions
DSC and X-ray diffraction measurements during Joule heating have proved to be powerful techniques to analyze in real time the disorder-order transition for amorphous metallic ribbons. Both Fe-B based alloys presented an evolution of the crystallization products at different stages of annealing. For the Fe-B-Zr-Cu alloy it was observed the
formation ofα-Fe nanocrystals with increasing crystalline
volume fraction up to 1.8 A, followed by the formation of
small fractions of ZrO2 and B2Zr which do not show a
significant intensity evolution as the current increases. At high values of applied currents, that correspond to higher
temperatures, it was observed a phase transition fromα-Fe
(bcc) to a unstableγ-Fe phase (fcc), which reverts to bcc at
3.0 A. For the Fe-B-Si-Ni-Mo alloy, the crystallization and
growth of largerα-Fe nanocrystals occur simultaneously
with the formation of metastable Fe2B, which for more
severe heating conditions transforms into a stable Fe3B
phase. On line monitoring of the electrical resistance vari-ations allowed an accurate control of the heating procedure and of the resulting structural transformations, through the
typicalR(I)curves.
DSC analysis showed for the Fe-B-Zr-Cu a crystal-lization process that involves two clearly distinct phase transformations, for all the studied heating rates. Otherwise crystallization of Fe-B-Si-Ni-Mo samples followed differ-ent kinetics according to the applied heating rate: it exhibits multiple peaks for slow heating, and a single exothermal peak for heating rates equal or superior to 10 K/min. The obtained activation energies for the Fe-B-Zr-Cu alloy (362 and 301 kJ/mol) and for the Fe-B-Si-Ni-Mo alloy (323 kJ/mol) are comparable to reported values for amor-phous iron alloys. The values of the Avrami exponents for
Fe-B-Zr-Cu (n = 1.0 and 1.2) and for Fe-B-Si-Ni-Mo
(n= 1.0) are consistent with diffusion controlled
crystal-lization processes with nucleation rates close to zero.
Acknowledgments
This research was partially performed at LNLS - Na-tional Synchrotron Light Laboratory, Brazil. The authors thank financial support from CNPq (524262/96-9) and LNLS (0551-99).
References
1.Yoshizawa, Y.; Oguma, S.; Yamauchi, K. J. Appl.
Phys., v. 64, p. 6044, 1988.
2.Herzer, G.IEEE Trans. Mag., v. 26, p. 1397, 1990.
3.Suzuki, K.; Makino, A.; Inoue, A.; Matsumoto, T.
Mater. Trans. JIM, v. 32, p. 93, 1991.
4.Kim, B.G.; Song, J.S.’; Kim, H.S.; Oh, Y.W.J. Appl.
Phys., v. 77, p. 5298, 1995.
5.de Biasi, R.S.; Grillo, M.L.N.J. Alloys Comp., v. 279,
p. 233, 1998.
6.de Biasi, R.S.; dos Santos, D.S.Mat. Sci. Forum, v.
307, p. 107, 1999.
7.Vasquez, J.; Lopez-Alemany, P.L.; Villares, P.;
Jiménez-Garay, R. J. Alloys Comp., v. 61, p. 493,
2000.
8.dos Santos, D.S.; de Biasi, R.S. (submitted toJ. of
Non- Crystalline Solids).
9.Kopcewicz, M.; Grabias, A.; Williamson, D.L. J.
Appl. Phys., v. 82, p. 1747, 1997.
10.Lembke, U.; Hoell, A.; Kranold, R.; Müller, R.; Schüppel, W.; Goerigk, G.; Gilles, R.; Wiedenmann, A.J. Appl. Phys., v. 85, n. 4, p. 2279, 1999.
11.dos Santos, D.R.; Torriani, I.; Silva, F.C.S.; Knobel, M.J. Appl. Cryst., v. 33, p. 473, 2000.
12.dos Santos, D.R.; Torriani, I.; Silva, F.C.S.; Knobel, M.J. Appl. Phys., v. 86, p. 6993, 1999.
13.Barandiarán, J.M.; Fernández Barquín, F.; Gómez Sal,
J.C.; Gorria, P.; Hernando, A.Sol. State Commun., v.
88, p. 75, 1993.
14.Allia, P.; Baricco, M.; Tiberto, P.; Vinai, F.Phys. Rev.
B, v. 47, p. 3118, 1993.
15.Allia, P.; Baricco, M.; Knobel, M.; Tiberto, P.; Vinai, F.Mater. Sci. Eng., v. A179-280, p. 361, 1994.
16.da Silva, F.C.S.; Ferrari, E.F.; Knobel, M.; Torriani,
I.L.; dos Santos, D.R. Appl. Phys. Letters, v. 77, p.
1375, 2000.
17.Gao, Y.; Wang, W.J. non-Cryst. Solids, v. 81, p. 129,
1986.
18.Gao, Y.; Wang, W.; Zheng, F.Q.; Liu, X.J. non-Cryst.
Solids, v. 81, p. 135, 1986.
19.Tolentino, H.; Cezar, J.C.; Cruz, D.Z.;
Compagnon-Cailhol, V.; Tamura, E.; Martins Alves, M.C. J.
Synchr. Rad., v. 5, p. 521, 1998.
20.Torriani, I.; de Oliveira, C.; dos Santos, D.R.; Neuenschwander, R.; Kellerman, G.; Plivelic, T.
LNLS Newsletter, v. 2, p. 4-5, 2000 (internal report,
free download at www.lnls.br).
21.Ilschner, B.Archiv f. d. Eisenhuttenwesen, v. 26, p. 59,