ISSN 0104-6632 Printed in Brazil
www.abeq.org.br/bjche
Vol. 28, No. 03, pp. 495 - 504, July - September, 2011
Brazilian Journal
of Chemical
Engineering
EFFECT OF K PROMOTER ON THE STRUCTURE
AND CATALYTIC BEHAVIOR OF
SUPPORTED IRON-BASED CATALYSTS
IN FISCHER–TROPSCH SYNTHESIS
F. E. M. Farias
1, R. C. Rabelo Neto
2, M. A. S. Baldanza
2, M. Schmal
2and F. A. N. Fernandes
1*1
Universidade Federal do Ceará, Departamento de Engenharia Química, Phone: + (55) (85) 3366-9611, Fax: + (55) (85) 3366-9610, Campus do Pici, Bloco 709, 60455-760 Fortaleza - CE, Brasil.
E-mail: [email protected]
2
Universidade Federal do Rio de Janeiro, NUCAT/PEQ/COPPE, Centro de Tecnologia, Bloco G, Sala G-128, Cx.P. 68502, CEP: 21945-970, Rio de Janeiro - RJ, Brasil.
(Submitted: August 8, 2010 ; Revised: April 5, 2011 ; Accepted: April 26, 2011)
Abstract - Effects of K addition on the performance of supported Fe catalysts for Fischer–Tropsch synthesis (FTS) were studied in a slurry reactor at 240 to 270°C, 2.0 to 4.0 MPa and syngas H2/CO = 1.0. The catalysts
were characterized by N2 adsorption, H2 temperature programmed reduction, X-ray diffraction, X-ray
fluorescence, thermogravimetric analysis, scanning electron microscopy and dispersive X-ray spectroscopy. A strong interaction was observed between Fe and K, which inhibited the reduction of Fe catalyst. Addition of potassium increased the production of heavy hydrocarbons (C20+).
Keywords: Fischer-Tropsch synthesis; Hydrocarbons; Iron catalyst; Slurry reactor.
INTRODUCTION
The Fischer–Tropsch synthesis (FTS) is considered to be an efficient route to convert syngas (CO + H2 mixture) into a mixture of linear and branched hydrocarbons. Carbon monoxide and hydrogen react to form, in situ, a methylene radical (-CH2-) that polymerizes, producing short and long chain hydrocarbons.
The synthesis is usually carried out using iron or cobalt catalysts. Iron-based catalysts are able to generate more long chain hydrocarbons (diesel and waxes cut), produce less methane and are less sensitive to poisoning (Bartholomew and Bowman, 1985). Iron-based FTS catalysts are also preferred when coal or biomass derived synthesis gas are used because of their high activity in the water gas shift (WGS) reaction. The high activity in the WGS
reaction allows the use of synthesis gas with low H2/CO ratios (lower than 1.0) without needing to employ an upstream WGS unit (Davis, 2007).
Potassium suppresses the production of methane and improves the effective hydrocarbon selectivity (Miller and Moskovits, 1988; Yang et al., 2004). The effect of potassium has been mostly studied in precipitated iron-based catalysts and fewer studies have reported its influence in supported iron-based catalysts.
This work reports the effects of potassium on the catalytic behavior of a supported iron-based catalyst. The characterization of the catalyst and the results of the reactions carried out at high pressure (20 to 30 atm) in a slurry phase reactor are presented and discussed.
EXPERIMENTAL
Catalyst Preparation
The iron-based catalyst precursors were prepared by impregnation of an aqueous Fe(NO3).9H2O solution in the support (SiO2). After impregnation of Fe, the desired amount of K was added by aqueous impregnation with K2CO3, followed by aqueous impregnation with CuNO3. The precursors were calcined at 350°C for 5 h to obtain the final catalysts.
Three levels of potassium loading in the catalyst were studied and the compositions of the final catalysts were 100Fe/5Cu/6K/139SiO2, 100Fe/5Cu/12K/139SiO2 and 100Fe/5Cu/18K/139SiO2 on a molar basis, and were denoted respectively as 6KFe, 12KFe and 18KFe.
Copper was added to the catalyst because the copper-promoted catalyst has more active sites than the copper-free catalyst. The effect of adding copper to silica-containing precipitated iron catalysts is mainly an increase in the rate of reduction of iron, leading to a larger number of active sites (Hayakawa et al., 2006). The amount of copper used in the catalyst was based on literature information regarding the optimal amount of copper in iron-based catalysts (Bukur and Sivaraj, 2002; Hayakawa et al., 2006).
The catalyst was crushed and sieved to obtain particles with diameters in the range of 50 – 150 m, which is a particle size for which it is safe to neglect intraparticle transfer limitations and easy to use in the reactor during the experiment (Pour et al., 2010).
Catalyst Characterization
The BET surface area, pore volume and average pore diameter of the fresh catalysts were obtained by nitrogen physisorption at −196°C in a Quantachrome model Autosorb-1MP. Each sample was degassed under vacuum at 90°C for 1 h and 200°C for 12 h prior to the measurement.
The solids were characterized by chemical analysis (X-ray fluorescence, Rigaku model RIX-3100 instrument). Powder X-ray diffraction (XRD) patterns were obtained with a D/max-RA X-ray diffratometer (Rigaku, Japan), equipped with Cu Kα radiation ( = 1.5406 Å) at 40 kV and 150 mA.
Reduction behavior was measured by temperature programmed reduction experiments (TPR) with an Autochem II 2920 equipment (Micromeritics, USA). A sample of 40 mg of catalyst was loaded into a U-type quartz tube reactor and heated from room temperature to 1000°C in 10% H2/90% Ar (H2-TPR). The heating rate was maintained at 6°C/min and the flow rate at 50 mL/min. The variation of the reducing gas concentration was monitored with a thermal conductivity detector (TCD). Isopropyl alcohol gel (−88°C) and a liquid nitrogen trap were used to remove water (in H2-TPR) formed during the tests.
The thermogravimetric analysis (TGA) was performed using a Metler model TGA/SDTA 851 instrument. Samples of 20 mg were treated in 50% H2 (on a mol% basis) mixed with Ar at ambient conditions for 10 min and then the temperature was increased from room temperature to 1073 K at a rate of 10 K/min and held for 5 min before cooling.
The catalyst morphologies were studied by using scanning electron microscopy (SEM). The elemental distributions on the surface of the catalyst particles were determined using dispersive X-ray spectroscopy (EDXS). SEM was performed using a Hitachi FESEM-S4800 in the scanning electron (SE) mode. The accelerating voltage was 20 kV, with a working distance of 15 mm.
Elemental analysis was carried out to determine the surface composition and distribution of each element on the cross-sectional surface of the catalyst particles using an Oxford INCA 300 energy dispersive X-ray spectroscope. Cross-sections of the catalyst particles were prepared by mixing the particles with low-viscosity polymer gel; after consolidation of the polymer gel, particles were cut using a microtome. The microtome samples were mounted and the resulting flat surface was used for EDXS. The polished surface was coated with gold/palladium for 80 s in 20 s intervals.
Catalyst Evaluation
(Aalborg GFC, USA). The vapor phase in the region above the slurry passed continuously to the warm (80°C) and the cold (0°C) traps located outside the reactor. The light wax and water mixture was collected from the warm trap and an oil plus water sample from the cold trap. The tail gas was analyzed by gas chromatography (GC) (Thermos Ultra, USA). The liquid sample was withdrawn after 12 h and analyzed by gas chromatography (Thermos Ultra, USA).
CO and H2 mass flow controllers were used to provide a simulated synthesis gas of the desired composition. Syngas was introduced at a rate of 10 L(NTP).h-1.gFe-1. Reaction conditions were 240-270°C, 2.0-3.0 MPa, H2/CO = 1.0, and a stirrer speed of 800 rpm. Prior to the FTS assays, calcined catalysts were loaded into the reactor and activated in situ with pure CO at 280°C and 0.8 MPa for 8 h.
RESULTS AND DISCUSSION
Molar Composition and Crystallite Structure of the Catalysts
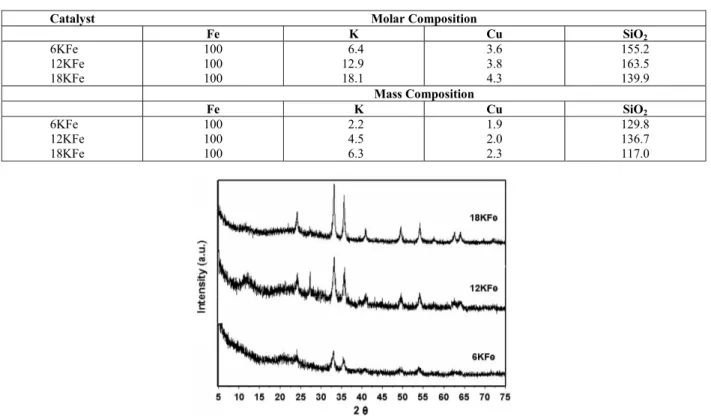
Table 1 contains characterization data for the various catalysts promoted with K and Cu. The promoter loadings were very close to the predicted
values, indicating the efficiency of the incipient wetness method for catalyst production.
The XRD patterns of the fresh catalysts are presented in Figure 1. All the XRD patterns show broad diffractograms with several diffraction peaks at 2θ values of 24°, 33°, 36°, 41°, 50°, 54°, 62° and 63°, all of which are characteristic of hematite (α-Fe2O3), according to the JCPDS database. The diffraction intensity of hematite increased with increasing potassium content. The peaks at 50 and 54° were evident as the amount of potassium in the catalyst increased. Increase in these peaks was also reported by Wu et al. (2004).
The peak at 41° corresponds to the iron carbide phase, which was more evident as the amount of potassium in the catalyst increased. The 6KFe catalyst did not present significant intensity at 41°. The XRD patterns show the existence of iron carbides in the catalysts after reaction, whereas it is difficult to distinguish the type of iron carbide due to the weak diffraction signal. These results indicate that potassium as promoter can facilitate the formation of iron carbide in the FTS reaction (Jin and Datye, 2000).
No evidence was found that Cu was in the form of CuO, which would be indicated by its characteristic peaks at 2θ = 35.5° and 39°.
Table 1: Characterization data for the catalysts
Catalyst Molar Composition
Fe K Cu SiO2
6KFe 12KFe 18KFe
100 100 100
6.4 12.9 18.1
3.6 3.8 4.3
155.2 163.5 139.9
Mass Composition
Fe K Cu SiO2
6KFe 12KFe 18KFe
100 100 100
2.2 4.5 6.3
1.9 2.0 2.3
129.8 136.7 117.0
Surface Properties of the Catalysts
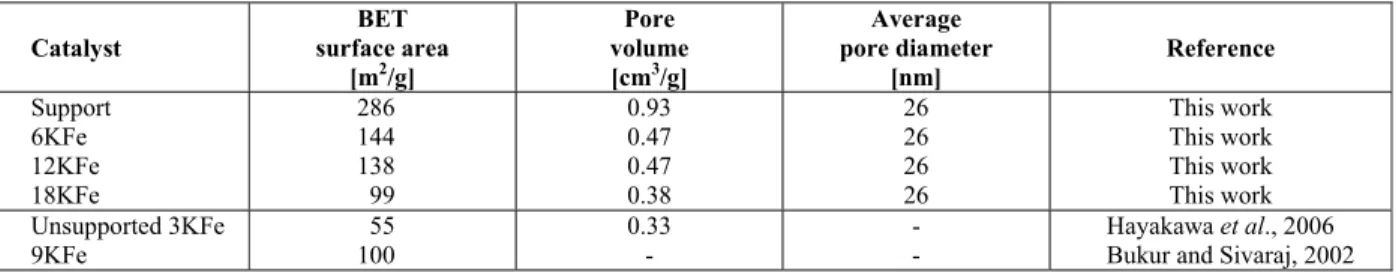
The BET surface area, pore volume and average pore diameter of the catalysts are illustrated in Table 2. It is evident that K addition results in a decrease in both the BET surface area and the total pore volume of the Fe catalyst. The average pore diameter of all studied KFe catalysts did not change with increasing K addition. The decrease in the BET surface area as the potassium content in the catalyst increased may be caused by the formation of larger hematite crystallites that are promoted by potassium, which was also evidenced by the SEM studies in the present study. Pore blocking by alkaline molecules may not be contributing to the decrease in BET surface area (Jin and Datye, 2000). Dry and Oosthuizen (1968) suggested that strong bases like K can decrease the surface area of the Fe catalyst by increasing the Fe crystallite size.
Compared with the Fe catalyst, Fe/Cu catalysts (with no K addition) have larger surface area and pore volume and smaller pore size (Wan et al, 2008). The addition of Cu promoter facilitates high dispersion of the catalyst metals. The large surface area of the Fe/Cu catalyst can be attributed to the small catalyst crystallites. The addition of K promoter decreases the BET surface area and pore volume of Fe/Cu/K catalysts compared to Fe or Fe/Cu catalysts; thus, the effect reported in Table 2 is due to the addition of potassium and not to the presence of copper in the catalyst.
The results obtained by Dry and Oosthuizen (1968) for a fused iron catalyst indicated that an increase in the alkali content of the catalyst resulted in a loss of surface area. Similar result was observed by Bukur and Sivaraj (2002), who reported BET surface areas near the ones reported herein. Lohitharn and Goodwin (2008) observed a decrease in the surface area of Fe and Fe/Mn catalysts with an increase in potassium content. Lohitharn and Goodwin (2008) reported that the surface area of Fe/K catalysts increased upon incorporation of Mn in the catalyst.
Table 2 also shows the BET results for a
precipitated iron-based catalyst. The use of a silica support increases greatly the BET surface area of the catalyst.
Reduction Behavior
H2-TPR profiles of all catalysts are presented in Figure 2. The KFe catalysts presented two reduction peaks. The first, located in the range of 450–550°C, corresponded to the reduction of iron oxides and the second peak, located above 650°C, corresponded to the reduction of the reduced iron oxide phase. The addition of potassium slightly lowered the temperature of the reduction peaks when the potassium content was increased from 6KFe to 12KFe. Further increase in the potassium content in the catalyst increased the temperature of the reduction peaks. Similar results were found for other iron-based catalysts (Bukur et al., 1999; Bukur and Sivaraj, 2002; Lin et al., 2003).
Compared to other iron-based catalysts supported on silica, the addition of potassium induced a pronounced effect in the TPR analysis mostly due to the interaction between the promoter and the support and the support and the metal. The 12KFe catalyst presented a slight reduction in the reduction temperature, probably due to a less pronounced interaction between the metal and the support (Lin et al., 2003). Total reduction of all catalysts was observed below 800oC.
Pure iron oxide catalysts tend to show the first reduction peak around 480oC and the second peak around 650oC. The addition of copper to the iron-based catalyst shifts the first and second peaks to lower values. Copper has a marked effect on the reduction of Fe2O3 to Fe3O4 (first peak). Hayakawa et al. (2006) have studied the effect of copper on iron-based catalysts. Catalysts with a 100Fe:2Cu molar ratio lowered the first peak from 480oC to 323oC, and the second peak from 650oC to 565oC. Our results show that the addition of potassium increases the reduction temperature of FeCu catalysts to values similar than those shown by pure iron oxide catalysts.
Table 2: BET surface area, pore volume and average pore diameter of the catalysts.
Catalyst
BET surface area
[m2/g]
Pore volume [cm3/g]
Average pore diameter [nm] Reference Support 6KFe 12KFe 18KFe 286 144 138 99 0.93 0.47 0.47 0.38 26 26 26 26 This work This work This work This work Unsupported 3KFe 9KFe 55 100 0.33 - - -
Figure 2: H2-TPR profiles of the catalysts with different potassium levels.
Figure 3 shows the effect of potassium on the curves of weight loss vs. temperature in a H2/Ar atmosphere. The two reductions observed in the TG pattern for all catalysts represent the reduction steps of α-Fe2O3 to Fe3O4 and Fe3O4 to α-Fe, respectively. The first loss of mass observed in Figure 3 (below 300oC) corresponds to desorption of water, evaporation of solvents and oxidation of residues and non-incorporated nitrates. The loss of mass observed from 300 to 460oC corresponds to the reduction step of α-Fe2O3 to Fe3O4 (Zhang et al., 2006). The loss of mass regarding the reduction step of Fe3O4 to α-Fe was observed within the range of 550 to 700oC.
The net weight loss at the same temperature point decreased with the increase of potassium levels, indicating that the reduction steps of α-Fe2O3 to
Fe3O4 and of Fe3O4 to α-Fe of the catalyst were retarded by the addition of potassium.
This decrease may be the result of an interaction between potassium oxide, copper oxide and iron oxide. A strong interaction of potassium oxide with iron oxide may suppress the adsorption of hydrogen on the catalyst surface and impede the reduction of iron oxide adjacent to the potassium promoter (Lund and Dumesic, 1982; Rankin and Bartholomew, 1986). The increase in α-Fe2O3 crystallite size decreased the surface area for contact with the reductant H2 and may have contributed to the reduction phenomenon observed in the TG analysis. To explain better the TG analysis results, further studies should be carried out to understand fully the interaction between copper, potassium and iron.
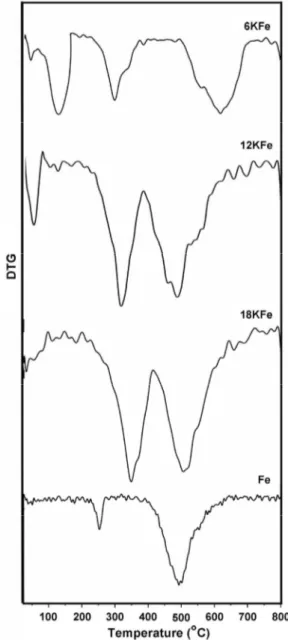
DTG analyses are presented in Figure 4. Integration of the DTG profiles shows that the mass loss of the first reduction step (α-Fe2O3 to Fe3O4) increases from 36% of the total mass loss (Fe and 6KFe catalyst) to 38% of the total mass loss (18KFe catalyst). The inverse trend was observed in the second reduction step (Fe3O4 to α-Fe), where the mass loss reduced from 64% of the total mass loss (Fe catalyst) to 56% of the total mass loss (18KFe catalyst). Water desorption ranged from 6 to 7% of the total mass loss in all catalyst studied herein.
SEM Analysis
Figure 5 shows SEM micrographs of the
catalysts. Figure 5a shows that the support is amorphous and does not present a well-defined structure. After impregnation with Fe, K and Cu, globular structures were formed over the support. The size of the globular structures increased with the incorporation of potassium, especially upon going from the 6KFe to the 12KFe catalyst.
The globular structures shown in Figure 5 were formed by an increase in the Fe crystallite size. This increase has been suggested by Dry and Oosthuizen (1968) and is related to the incorporation of strong bases like K, which consequently decreases the surface area of the Fe catalyst.
Figure 5: SEM analysis of the catalysts with different potassium levels. (a) support; (b) 6KFe; (c) 12KFe; (d) 18KFe.
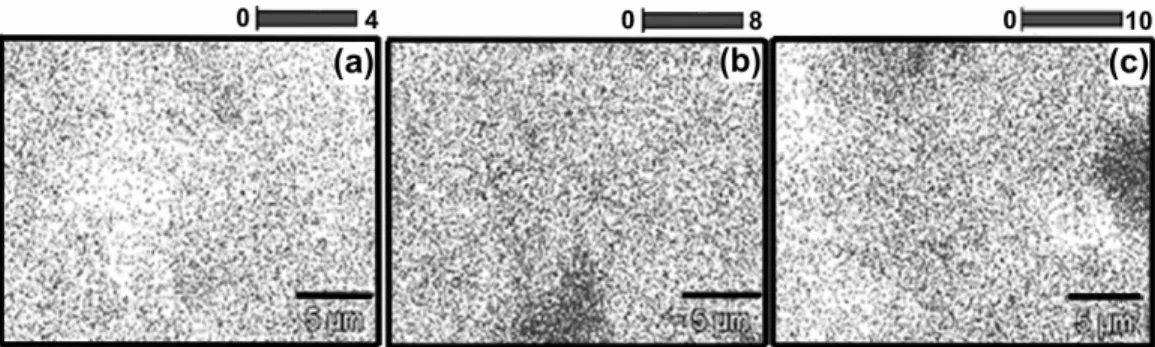
EDXS Analysis
The elemental distributions for the cross-sections of the selected catalyst particles obtained from EDXS analysis are presented in Figure 6. The EDXS image of potassium showed a good distribution of the promoter over the support. The catalysts with high potassium content (12KFe and 18KFe) showed some regions where the promoter concentration was slightly higher.
Results presented by Sudsakorn et al. (2001) showed that potassium was found in a higher concentration in the outer region of the cross-section of particles, which was probably caused by the high potassium content in their catalyst (4.2 wt.%). Higher concentration of potassium in the outer region of the catalyst was not observed in the catalyst prepared in this work, which may be related to the application of the incipient wetness method instead of a precipitation method.
Catalyst Activity
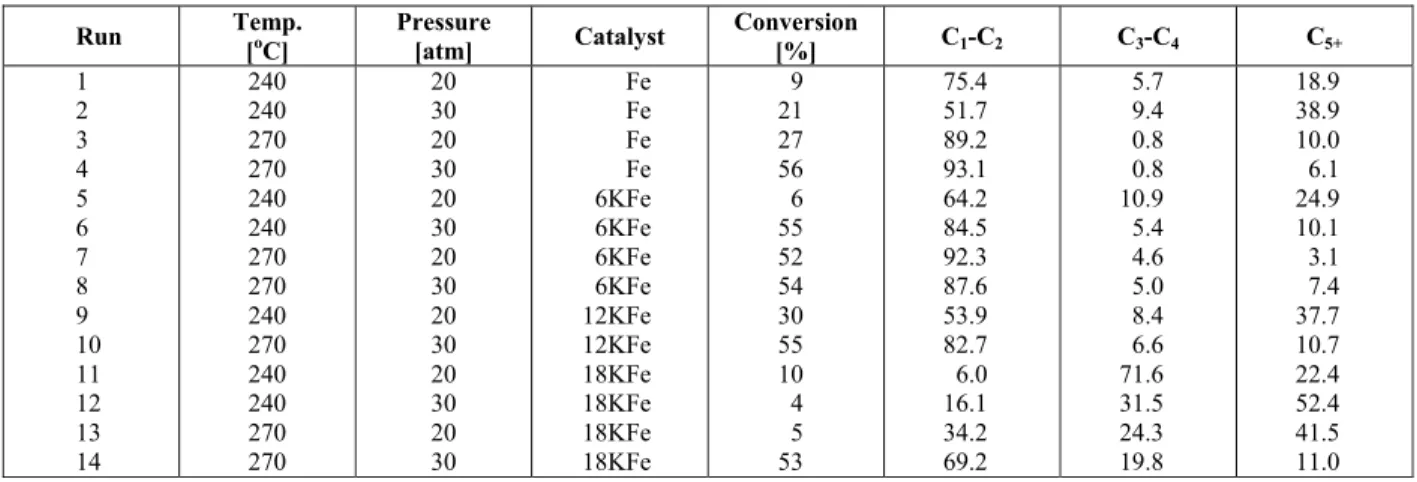
The conversion of CO into hydrocarbons ranged from 4 to 56% and depended highly on the operating conditions (Table 3). The conversion of syngas tended to increase with increasing pressure and increasing temperature. The conversion was slightly lower than the results reported by Bukur and Sivaraj (2002), who observed an average conversion of 60% with a 9KFe catalyst. The conversion was lower than the conversion observed by Luo and Davis (2003) (73%) for a 1.5KFe precipitated iron-based catalyst.
The effect of the potassium content of the catalyst on the product distribution was complex. The increase in potassium content decreased the mass fraction of C1 and C2, especially at lower temperature and pressure. The shift toward higher hydrocarbons was more evident for the 18KFe catalyst, where the amount of C5+ was higher than 52% when the reactor operated at 240oC and 30 atm. The results shown in Table 3 show that a higher yield of heavier hydrocarbons was accompanied by a lower conversion of syngas. This feature may be explained by the occupation of the active sites. The formation of methane and other light gases is faster and may lead to higher total conversion of CO, while the formation of higher hydrocarbons is slower, which may lead to lower total conversion of syngas.
The amount of heavy hydrocarbons (C20+) increased with pressure at low potassium content (6KFe), whereas the amount of heavy hydrocarbons decreased slightly with increasing pressure at high potassium content (18KFe). The catalyst 12KFe showed a slight increase in heavy hydrocarbons with pressure. The average carbon number was 28.4 for the 6KFe catalyst, 28.2 for the 12KFe catalyst and 28.8 for the 18KFe catalyst, differences that are not statistically significant. A statistical difference was
observed only at low pressure. The average carbon number for the 6KFe catalyst and for the 12KFe catalyst was 26.3. The average carbon number for the 18KFe catalyst increased to 29.4, showing that a high potassium to iron molar ratio increased the degree of polymerization of carbon monoxide at low pressure. Under this condition, the main hydrocarbon cut is shifted from diesel toward waxy products.
At low potassium contents, the concentration of adsorbed H atoms is greater and chain termination via hydrogenation is favored, which results in shorter chain hydrocarbons. On the other hand, dissociative CO adsorption is significantly enhanced as the potassium content increases, resulting in a higher concentration of CH2• species while the adsorption of H2 is more hindered (Lohitharn and Goodwin, 2008).
Results presented by Lohitharn and Goodwin (2008) showed a lower activity of catalysts with high potassium content (above 9KFe molar ratio), while catalysts below a 4KFe molar ratio presented similar activity in producing hydrocarbons. The lower activity reported by Lohitharn and Goodwin (2008) may be related to the mode of production of the catalyst (precipitation), which may be more susceptible to potassium addition than catalysts produced by the incipient wetness method.
Although the increase of potassium content in the catalyst increases the mass fraction of higher hydrocarbons, it also has a significant negative impact on conversion. The productivity of C5+ of the 6KFe catalyst and of the 12KFe catalyst is approximately 2.5 times higher than the productivity observed for the 18KFe catalyst. Thus, the production of higher hydrocarbons at the expense of lower conversion is not worthwhile from an industrial point of view. For industrial application, there is a limit to the amount of potassium promoter that should be added to the catalyst.
Table 3: CO conversion and hydrocarbon mass fractions for supported iron-based catalysts with different amounts of potassium after 8 hours on-stream.
Run Temp.
[oC]
Pressure
[atm] Catalyst
Conversion
[%] C1-C2 C3-C4 C5+
CONCLUSIONS
Incorporation of potassium promoter to an iron-based catalyst was found to have a significant influence on the adsorption and reduction behavior, as well as catalytic performance during Fischer–Tropsch synthesis. The changes in the catalytic performance can be primarily attributed to the effects of the potassium promoter on H2 adsorption, which further significantly affects the FTS performance of the catalysts.
The factors that most influenced the increase in the production of heavy hydrocarbons were the pressure and the potassium content of the catalyst. High pressures increased the average carbon number, while at low pressures the increase in the average carbon number was related to the increasing potassium to iron molar ratio of the catalyst.
ACKNOWLEDGMENT
The authors acknowledge financial and scholarship support from the Brazilian research funding institutions CNPq and CAPES.
REFERENCES
Bai, L., Xiang, H. W., Li, Y. W., Han, Y. Z. and Zhong, B., Slurry phase Fischer-Tropsch synthesis over manganese-promoted iron ultrafine particle catalyst. Fuel, 81, 1577 (2002).
Bartholomew, C. H. and Bowman, R. M., Sulfur poisoning of cobalt and iron Fischer-Tropsch catalyst. Appl. Catal., 15, 59 (1985).
Botes, F. G. and Böhringer, W., The addition of HZSM-5 to the Fischer-Tropsch process for improved gasoline production. Appl. Catal. A, 267, 217 (2004).
Bukur, D. B. and Sivaraj, C., Supported iron catalysts for slurry phase Fischer-Tropsch synthesis. Appl. Catal. A, 231, 201 (2002).
Bukur, D. B., Lang, X. S. and Ding, Y. J., Pretreatment effect studies with a precipitated iron Fischer-Tropsch catalyst in a slurry reactor. Appl. Catal. A, 186, 255 (1999).
Bukur, D. B., Mukesh, D. and Patel, S. A., Promoter effects on precipitated iron catalysts for Fischer-Tropsch synthesis. Ind. Eng. Chem. Res., 29, 194 (1990).
Davis, B. H., Fischer-Tropsch synthesis: Comparison of performances of iron and cobalt catalysts. Ind. Eng. Chem. Res., 46, 8938 (2007).
Dry, M. E. and Oosthuizen, G. J., The correlation between catalyst surface basicity and hydrocarbon selectivity in the Fischer-Tropsch synthesis. J. Catal., 11, 18 (1968).
Dun, J. W., Gulari, E. and Ng, K. Y. S., Fischer-tropsch synthesis on charcoal-supported molybdenum: The effect of preparation conditions and potassium promotion on activity and selectivity. Appl. Catal., 15, 247 (1985). Farias, F. E. M., Sales, F. G. and Fernandes, F. A.
N., Effect of operating conditions and potassium content on Fischer-Tropsch liquid products produced by potassium-promoted iron catalysts. J. Nat. Gas. Chem., 17, 175 (2008).
Hayakawa, H., Tanaka, H. and Fujimoto, K., Studies on precipitated iron catalysts for Fischer-Tropsch synthesis. Appl. Catal. A, 310, 24 (2006).
Jin, Y. and Datye, A. K., Phase transformations in iron Fischer-Tropsch catalysts during temperature-programmed reduction. J. Catal., 196, 8 (2000). Li, T., Yang, Y., Zhang, C., An, X., Wan, H., Tao,
Z., Xiang, H., Li, Y., Yi, F. and Xu, B., Effect of manganese on an iron-based Fischer–Tropsch synthesis catalyst prepared from ferrous sulfate. Fuel, 86, 921 (2007).
Lin, H. Y., Chen, Y. W. and Li, C., The mechanism of reduction of iron oxide by hydrogen. Thermochim. Acta, 400, 61 (2003).
Lohitharn, N. and Goodwin Jr., J. G., Effect of K promotion of Fe and FeMn Fischer-Tropsch synthesis catalysts: Analysis at the site level using SSITKA. J. Catal., 260, 7 (2008).
Lou, M. and Davis, B. H., Fischer-Tropsch synthesis: Group II alkali-earth metal promoted catalysts. Appl. Cat. A, 246, 171 (2003).
Lund, C. R. F. and Dumesic, J. A., Strong oxide-oxide interactions in silica-supported magnetite catalysts. 2. The core/shell nature of the interaction. J. Phys. Chem., 86, 130 (1982).
Maiti, G. C., Malessa, R. and Baerns, M., Iron/manganese oxide catalysts for fischer-tropsch synthesis. Part I: structural and textural changes by calcination, reduction and synthesis. Appl. Catal., 5, 151 (1983).
Maiti, G. C., Malessa, R., Löchner, U., Papp, H. and Baerns, M., Iron/manganese oxide catalysts for Fischer-Tropsch synthesis. Part II: Crystal phase composition, activity and selectivity. Appl. Catal., 16, 215 (1985).
Miller, D. G. and Moskovits, M., A study of the effects of potassium addition to supported iron catalysts in the Fischer-Tropsch reaction. J. Phys. Chem., 92, 6081 (1988).
Pour, A. N., Zare, M. and Zamani, Y., Studies on product distribution of alkali promoted iron catalyst in Fischer-Tropsch synthesis. J. Nat. Gas. Chem., 19, 31 (2010).
Qin, S., Zhang, C., Xu, J., Wu, B., Xiang, H. and Li, Y., Effect of Mo addition on precipitated Fe catalysts for Fischer-Tropsch synthesis. J. Mol. Catal. A, 304, 128 (2009).
Rankin, J. L. and Bartholomew, C. H., Effects of potassium and calcination pretreatment on the adsorption and chemical/physical properties of Fe SiO2. J. Catal., 100, 533 (1986).
Sudsakorn, K., Goodwin Jr., J. G., Jothimurugesan, K. and Adeyiga, A. A., Preparation of attrition-resistant spray-dried Fe Fischer-Tropsch catalysts using precipitated SiO2. Ind. Eng. Chem. Res., 40, 4778 (2001).
Tao, Z., Yang, Y., Zhang, C., Li, T., Ding, M., Xiang, H. and Li, Y., Study of Manganese Promoter on a Precipitated Iron-Based Catalyst for Fischer-Tropsch Synthesis. J. Nat. Gas. Chem., 16, 278 (2007).
Wan, H., Wu, B., Zhang, C., Xiang, H. and Li, Y., Promotional effects of Cu and K on precipitated iron-based catalysts for Fischer-Tropsch synthesis. J. Mol. Catal. A., 283, 33 (2008).
Wu, B., Bai, L., Xiang, H., Li, Y. W., Zhang, Z. E. and Zhong, B., An active iron catalyst containing sulfur for Fischer-Tropsch synthesis. Fuel, 83, 205 (2004).
Yang, Y., Xiang, H. W., Xu, Y. Y., Bai, L. and Li, Y. W., Effect of potassium promoter on precipitated iron-manganese catalyst for Fischer-Tropsch synthesis. Appl. Catal. A, 266, 181 (2004).