*e-mail: [email protected]
Processing of a LLDPE/HDPE Pressure Vessel Liner by Rotomolding
E. S. Barboza Netoa, L. A. F. Coelhob, M. M. C. Fortea, S. C. Amicoa, C. A. Ferreiraa*
aLaboratório de Materiais Poliméricos, Programa de Pós-graduação em Engenharia de Minas Metalúrgica e de Materiais, Universidade Federal do Rio Grande do Sul – UFRGS,
Av. Bento Gonçalves, 9500, CEP 91509-900, Porto Alegre, RS, Brasil
bCentro de Ciências Tecnológicas – CCT, Universidade do Estado de Santa Catarina – UDESC, CEP 89223-100, Joinville, SC, Brasil
Received: March 8, 2013; Revised: September 1, 2013
Biaxial rotational molding is a low-pressure process that uses a polymer powder to produce large and/or complex-shaped hollow thermoplastic goods using low cost molds, being very suitable for prototype production. In the present work, liner prototypes (Φ 78 × 280 mm) made of linear low density (LLDPE) and high density polyethylene (HDPE) blends were produced aiming to later use them as compressed natural gas type IV cylinders. The LLDPE/HDPE blend composition and the process parameters (temperature/time cycle, and rotation speed) were varied to evaluate their effect on blend
miscibility and liner inal properties, such as density and crystallization behavior. Blend composition
and process parameters were found vital for the production of a homogeneous wall and for the liner to reach adequate characteristics for the intended product.
Keywords: polyethylene, HDPE, LLDPE, blends, liner, pressure vessel, rotomolding
1. Introduction
Liners used for composite pressure vessels may be obtained by rotomolding instead of injection or blow molding processing, with the advantage of producing a variety of shapes at low cost and reaching higher impact strength. The low tooling cost makes rotomolding an ideal process for prototype production for many applications, such as the study of liners for compressed natural gas (CNG) type IV (composite) filament-wound pressure vessels, as recommended in ISO 11439:001 - Gas cylinders-high pressure cylinders for the on-board storage of natural gas as a fuel for automotive vehicles2,3. Rotomolding process operates at low pressure and allows the production of complex tension-free samples compared to high pressure processes4,5.
The rotomolding process requires a powdered or
micronized polymer and thus some air bubbles can be
entrapped in the molten polymeric material6. The process occurs by placing aggregates of thin granules on the heated surface of the mold and allowing for molecular diffusion between adjacent particles during polymer melting. The remaining empty spaces among the particles become air bubbles which are mostly eliminated in a later stage known
as densiication6,7. The air bubbles fraction yields a porosity in the material and affects the mechanical strength and
density of the inal product8,9.
The factors that inluence the success of the rotomolding process include polymer particle size (usually within
150-500 µm in diameter)6,10, melting range, melting low rate (MFR), molecular weight distribution and shrinkage. The suggested polymer MFR range for the rotomolding
process is commonly between 3.0-4.0 g/10 min, since lower
MFR makes the melting low inside the mold more dificult,
leading to bubble formation. On the other hand, when
polymer blends with crystallizable components are used,
polymer miscibility must be taken into account along with
melting and crystallization temperature, crystalline fraction, spherulites size and shape, and density11,12.
In this work, LLDPE/HDPE (linear low-density polyethylene/high density polyethylene) blends were studied aiming to produce liners for high-pressure composite vessels. The use of this polymeric blend instead of pure LLDPE, traditionally used for this application3, aims to improve overall processing and properties13-15.
The study focuses on polyolein blend composition with
regard to miscibility, thermal behavior and rotomolding processability. The miscibility study is particularly needed considering that blend interfaces would be detrimental for the intended application.
2. Experimental
2.1.
Material
The following materials were used: LLDPE laboratory grade DL 1002 RM, MFR of 3.3 g/10 min (190 °C/2.16 kg) and density of 0.939 g/cm3; HDPE commercial grade GM 9450 F with wide (bimodal) molecular weight distribution, MFR of 0.38 g/10 min (190 °C/5.00 kg) and density of 0.952 g/cm3. Both polymers were supplied by BRASKEM
and micronized in usual disc mill. The average particle diameter as analyzed by laser granulometry (performed in
2.2.
Blend preparation and specimens
In the irst stage of this study, the LLDPE/HDPE mixture
composition varied and LH05, LH10, LH20, LH30 and LH50 blends were prepared with 5, 10, 20, 30 and 50% of HDPE, respectively. Prior to processing, the LLDPE and HDPE particles were manually mixed for 10 min using plastic bags. In the second stage, only the blend with the most suitable characteristics was used to produce liner prototypes of variable wall thicknesses, 1, 2, 3 and 4 mm.
Blend specimens were obtained by extrusion/injection molding. Extrusion of the samples was performed in a single-screw extruder (18 mm), Ciola/MEP-18 brand with
two heating zones operating at 190 °C. The mixtures were later pelletized in an automatic SEIBT shredder and injection molded using a Thermo Scientiic Haake Minijet II injector,
with an injection pressure of 200 bar and cylinder/mold temperature of 200 °C/60 °C.
2.3.
Polymer liner prototype production
The prototype liner was produced in a shuttle rotomolding
equipment with 74 L capacity oven and the analyzed
processing conditions were: temperature (200 to 240 °C), primary axis rotation (3 to 15 rpm), secondary axis rotation (5.3 to 23.1 rpm) and processing time (16 to 40 min). A steel cylindrical mold 280 mm long, 78 mm in diameter and with 1000 mL inner volume was used. Temperature was monitored with a Rayon ST20 brand pyrometer and the most suited rotation speed was found to be 11 rpm for the primary axis, and 19.5 rpm for the secondary axis. The average heating rate in the 25 °C to 250 °C range was 17 °C/min and the average cooling rate was 13 °C/min.
2.4.
Characterization
The dynamic mechanical behavior of the pristine polyethylenes and their extruded/injected blends were
analyzed in a TA Instruments DMA model Q800, with a dual
cantilever support device, from –150 °C to 100 °C, using
a heating rate of 2 °C/min and 1 Hz oscillation frequency.
DSC analysis of the polymers was carried out in a TA Instruments 2010 model, at heating rate of 10 °C.min–1.
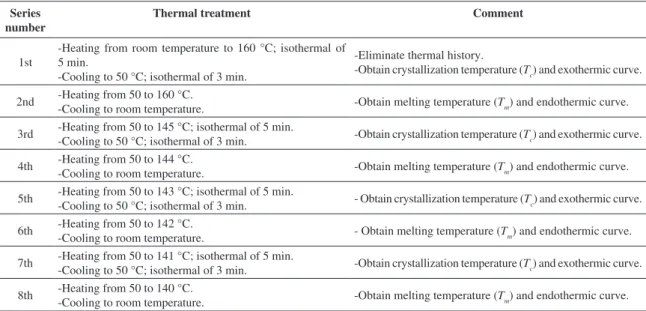
The rotomolded samples were analyzed under eight
standard procedures (series) in order to evaluate multiple melting peaks as a function of the composition and the
crystallization conditions. The endothermic curves were obtained in the second heating run. Table 1 summarizes the DSC test conditions. The irst series consisted in heating
and cooling the sample without annealing in order to
obtain the crystallization and melting temperature ranges
used as reference. The sample was kept for 60 min at each temperature level12.
Blend density of the rotomolded samples was measured using a pycnometer (ISO 1183-1:0417 - Methods for determining the density of non-cellular plastics).
Crystallinity of the micronized samples was evaluated with
an X-ray diffractometer Siemens model D500. Scanning was carried out between 2θ = 3-50°, using a CuKα with λ = 1.5418 Å radiation, at 40 kV and 40 mA. Apparent viscosity of the samples was evaluated in a capillary
rheometer Kayeness model Galaxy III, and the melting low
rate was detemined in a Microtest Haake model 4105 B plastometer (ASTM D1238-1018 Standard test method for
melt low rates of thermoplastics by extrusion plastometer).
A hydrostatic test was used to determine the burst pressure of the rotomolded prototype liners. This test was carried out in a Flutrol equipment, 150 psi capacity, using two prototypes for each polymeric blend, according to ISO 11439:001 for pressure vessels. A HBM 1000 bar charge
cell was used, with spindler 8 interface, HBM 60 Hz, and
the CATMAN 4.0 Professional software was employed for data processing.
2.5.
Determination of glass transition temperature,
density and Flory interaction parameter
The glass transition temperature (TgAB) of the blends was determined using the Fox Equation (Equation 1)13:
Table 1. DSC experimental conditions used for blend thermal fractioning.
Series number
Thermal treatment Comment
1st
-Heating from room temperature to 160 °C; isothermal of 5 min.
-Cooling to 50 °C; isothermal of 3 min.
-Eliminate thermal history.
-Obtain crystallization temperature (Tc) and exothermic curve.
2nd -Heating from 50 to 160 °C.
-Cooling to room temperature. -Obtain melting temperature (Tm) and endothermic curve.
3rd -Heating from 50 to 145 °C; isothermal of 5 min.
-Cooling to 50 °C; isothermal of 3 min. -Obtain crystallization temperature (Tc) and exothermic curve.
4th -Heating from 50 to 144 °C.
-Cooling to room temperature. -Obtain melting temperature (Tm) and endothermic curve.
5th -Heating from 50 to 143 °C; isothermal of 5 min.
-Cooling to 50 °C; isothermal of 3 min. - Obtain crystallization temperature (Tc) and exothermic curve.
6th -Heating from 50 to 142 °C.
-Cooling to room temperature. - Obtain melting temperature (Tm) and endothermic curve.
7th -Heating from 50 to 141 °C; isothermal of 5 min.
-Cooling to 50 °C; isothermal of 3 min. -Obtain crystallization temperature (Tc) and exothermic curve.
8th -Heating from 50 to 140 °C.
1
AB A B
A B
g g g
W W
T =T +T (1)
where: WA and WB are the weight percentage of each component of the blends. The TgA and TgB data were obtained from DMA results.
Blend density (ρs) was determined using Equation 2[11]:
1 / 1 /
100% 1 / 1 /
s a
c
c a
W = ρ − ρ ×
ρ − ρ (2)
where: Wc is the crystallinity degree, ρc and ρa are the densities of fully crystalline polyethylene (1.000 g/cm3) and fully amorphous polyethylene (0.852 g/cm3), respectively. The melting enthalpy of the fully crystalline polyethylene was considered 218 J/g[16]. The void content was later estimated based on the difference between density values obtained from Equation 2 and those found using pycnometry.
For the estimation of the entropic contribution values
of the mixture deined by Gibbs’ law, the Flory interaction
parameter (χ12) model based on the Flory-Huggins theory and modified by Nishi-Wang was used, according to Equation 3[13]:
( )
2 121 1
. mc . a .
o o
m m m ma
V R
T T H V
− = ω χ ∆
(3)
where: o m
T is the melting absolute temperature of HDPE (K) determined by DSC using a Hoffman-Weeks plot, Tm is the melting temperature of the blend (K), R is the universal gas constant (8.314 J/mol.K), o
m H
∆ is the melting enthalpy variation of HDPE as determined by DSC (4.36 kL/mol), Vmc is the molar volume of the crystalline polymer (cm3/mol), Vma the molar volume of the amorphous polymer (cm3/mol), ωa the weight fraction of the LLDPE (lowest crystallinity degree). The molar volumes were considered 1.0 for the
analyzed polymers since they have the same molecular
structure, which only varies in their branches.
3. Results and Discussion
To determine the most suitable LLDPE/HDPE blend
composition for liners, the thermal behavior was analyzed focusing on crystallite size profile aiming to obtain a
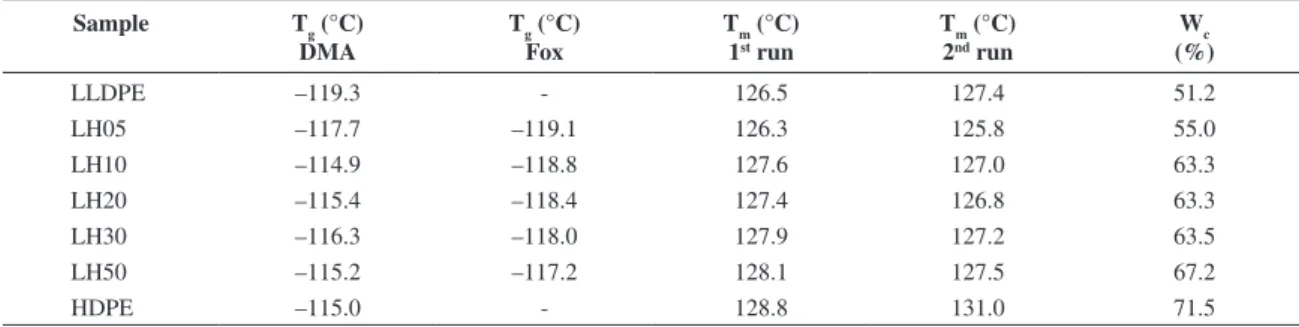
more homogeneous liner wall. Table 2 shows the glass transition temperature of the neat polymers and their blends determined using DMA and the Fox equation. It is possible to note that Tg of the blend increased with the addition of HDPE. It is also observed that the experimental Tg values are
very close to those calculated by Fox, which is indicative of miscibility of the polymers amorphous phase. In addition, the mixture was homogeneous throughout the compositional range evaluated.
Table 2 also shows the crystallinity degree and melting temperature of the rotomolded blends. The melting temperature (Tm) remained nearly constant for all samples, and the Tm determined after removing the thermal history
showed values very close to those obtained in the irst
run. In addition, density of the samples increased with the crystallinity degree. Figure 1a shows this trend with the increase in HDPE content. Density of the LLDPE and HDPE resins before were 0.93 and 0.96 g/cm³, respectively. Figure 1b shows blend density evaluated by pycnometry of the rotomolded samples. It may be pointed out that these results are below the original values for LLDPE (0.934 g/cm3) and HDPE (0.952 g/cm3).
It may also be observed that LH05, LLDPE and LH10 samples showed higher density, indicating a lower amount of air bubbles produced during processing. Indeed, Figure 2 shows the approximate void content (bubbles) in the liner wall, which is indicative of its porosity degree due to processing.
Figure 3 shows the X-ray spectra, evidencing the peaks attributed to 110 and 200 planes and the amorphous band
Table 2. Glass transition temperature (Tg) obtained with distinct methods, melting temperature (Tm) and crystallinity degree (Wc) of the samples.
Sample Tg (°C)
DMA
Tg (°C) Fox
Tm (°C) 1st run
Tm (°C) 2nd run
Wc (%)
LLDPE –119.3 - 126.5 127.4 51.2
LH05 –117.7 –119.1 126.3 125.8 55.0
LH10 –114.9 –118.8 127.6 127.0 63.3
LH20 –115.4 –118.4 127.4 126.8 63.3
LH30 –116.3 –118.0 127.9 127.2 63.5
LH50 –115.2 –117.2 128.1 127.5 67.2
HDPE –115.0 - 128.8 131.0 71.5
region for LLDPE,HDPE and their blends (LH05 and LH50). A decrease in peak intensity is observed for higher LLDPE content, indicating a decrease in crystallinity. The
micronized blend samples presented two very intense
peaks between 13º and 27º, showing the same behavior of
polyethylene. Table 3 shows the intensity of the identiied
crystalline peaks (planes 110 and 200) in the diffractogram of LLDPE, HDPE and the blends with 5% and 50% of HDPE. Crystallinity was obtained by numerical integration,
applying Simpson’s 3/8 rule. Integration was performed over
amorphous and crystalline curves, within 2θ = 13-27°, with an average truncation error of 6.0 × 10⁻⁴%. Crystallinity values were closer for the samples having higher HDPE content, or higher crystallinity degree (shown in Table 2).
Table 4 shows Flory parameter results, which indicates phase stability of the blends. The LH05 and LH50 samples displays the most negative values, suggesting that these blends present greater miscibility.
The LH05 and LH10 blends showed MFR higher than 3.0 g/10 min, which are in the optimum range regarding processability as suggested by the rotomolding companies. As shown in Figure 4, the apparent viscosity of these two blends were similar to that of neat LLDPE, within 5% variation, which is also an indication of their suitability regarding processability.
Figure 5 shows the results of the hydrostatic pressure test of the prototype liner for all blend compositions. The average error variability of the samples was of c.a. 8%. The LH05 and LH50 samples showed the highest burst pressure levels. Even though the LH50 blend showed the highest hydrostatic rupture pressure, it yielded higher void content, at both inner and outer surfaces, indicating low reliability for this material. Therefore, the combined analysis of void content, burst pressure and processability (MFR) indicates that the best overall performance was found for the LH05 blend.
The effect of varying the wall thickness of the prototype on its burst pressure was evaluated for the blend which showed the best performance (i.e. 5% HDPE content). Figure 6 shows these results and, as expected, the largest wall thickness (5 mm) yielded the highest burst pressure.
Table 4. Flory interaction parameter values for the blends.
Blend Temperature
Tm (°C)
Flory Interaction parameter
χ12
LH05 126.3 –0.00894
LH10 127.6 –0.00523
LH20 127.4 –0.00723
LH30 127.9 –0.00624
LH50 128.1 –0.00950
Figure 2. Variation of void content for the polymeric blends.
Figure 3. X-Ray spectra of the blends and the neat polymers.
Figure 4. Variation of apparent viscosity with shear rate for the samples.
Figure 5. Burst pressure results of the liners produced with the blends (wall thickness = 5 mm).
Table 3. Peak intensity and crystallinity degree values obtained by X-Ray.
Sample Plane 110 (u.a.)
Plane 200 (u.a.)
Crystallinity degree (%)
LLDPE 10329 1901 58.4
LH05 10965 2045 60.2
LH50 11890 1704 66.9
Figure 7 shows the melting fractioning of LLDPE, HDPE, LH05 and LH50 by DSC. It is possible to observe that the LH50 and HDPE samples show higher melting
temperature and more dificult crystallization. Figure 8
presents the equilibrium melting temperature ( o m
T ) for the LH05 blend using the Hoffman-Weeks plot method obtained from DSC.
Figure 9 presents the results of the DMA analysis of the LH05 sample. The Tg(obtained from Tan δ) was –117.7 °C and the storage modulus was 751.6 MPa. For comparison, the LLDPE and HDPE storage moduli were 710.5 MPa and 1086 MPa, respectively. The loss modulus curve shows the γ relaxation (crankshaft motion) between –120 °C and –150 °C and the β relaxation at –10.6 °C. These results indicate the LH05 blend to be miscible and suitable for the proposed application.
4. Conclusions
The behavior of the studied blends was analyzed in order to deine the most appropriate blend composition
for the intended pressure vessel application. Variation in HDPE content of the blend was responsible for changing Figure 6. Variation of burst pressure of the liner with thickness for the LH05 polymeric blend.
Figure 7. Comparison of the fractioning of LH05, LH50, LLDPE and HDPE.
Figure 8. Hoffman-Weeks plot of LH05 blend with equilibrium melting temperature Tmo = 124.2 °C.
Figure 9. DMA analysis of the LH05 blend.
temperature and processing time of the rotomolded liners, yielding different porosity contents for the studied blends.
It was found that crystallinity degree and density increased with the HDPE content in the polymeric blend after rotomolding. Comparing the density results obtained by pycnometry and DSC, the void content increased with the HDPE content in the blend. LLDPE and the blends with
5 and 10% of HDPE presented the highest melting low
rate, yielding better rotomolding processing performance. Determination of the Flory-Huggins interaction parameter using Nishi-Wang equations indicates that the blends should be considered miscible. A fair agreement between experimental Tg data and that from the Fox equation is another sign of miscibility of the amorphous phase. In all, the blend with 5% HDPE yielded the best combination of processability and properties considering its use as polymeric liner for composite pressure vessels.
Acknowledgements
The authors would like to thank FINEP and CNPq for
the inancial support, and CEFET-RS, Braskem, Poplast,
References
1. International Standards Organization – ISO. ISO 11439:00:
Gas Cylinders-High Pressure Cylinders for the On-Board Storage of Natural Gas as a Fuel for Automotive Vehicles. ISO; 2000.
2. Bellehumeur CT and Tiang JS. Simulation of non-isothermal melt densification of polyethylene in rotational molding.
Polymer Engineering & Science. 2002; 42:215-229. http:// dx.doi.org/10.1002/pen.10942
3. Velosa JC, Nunes JP, Antunes PJ, Silva JF and Marques AT. Development of a new generation of ilament wound composite pressure cylinders. Composites Science and Technology. 2009; 69:1348-1353. http://dx.doi.org/10.1016/j. compscitech.2008.09.018
4. Barboza ES, Chludzinski M, Costa AD, Ferreira CA and Amico SC. Liner of PEMD/PEAD polymeric blend for pressure vessels submitted to hydrostatic burst test. In: Anais do 10º Congresso Brasileiro de Polímeros - CBPOL; 2009; Foz do Iguaçu. ABPol; 2009.
5. Li Y, Liang JC, Zhang W, Qi W, Su M and Liu CD. Study on process and impact strength for a rotationally molded truck fender. Journal of Materials Processing Technology. 2007; 187-188:492-496. http://dx.doi. org/10.1016/j.jmatprotec.2006.11.142
6. Kontopoulou M and Vlachopoulos J. Melting and densiication of thermoplastics powders. Polymer Engineering & Science. 2001; 41:155-169. http://dx.doi.org/10.1002/ pen.10718
7. Liu S and Fu K. Effect of enhancing ins on the heating/cooling efficiency of rotational molding and the molded product qualities. Polymer Testing. 2008; 27:209-220. http://dx.doi. org/10.1016/j.polymertesting.2007.10.004
8. Gogos G. Bubble removal in rotational molding. Polymer Engineering & Science. 2004; 44:388-394. http://dx.doi. org/10.1002/pen.20035
9. Frank A, Pinter G and Lang RW. Prediction of the remaining lifetime of polyethylene pipes after up to 30 years in use.
Polymer Testing. 2009; 28:737-745. http://dx.doi.org/10.1016/j. polymertesting.2009.06.004
10. Cramez MC, Oliveira MJ and Crawford RJ. Optimisation of rotational moulding of polyethylene by predicting antioxidant consumption. Polymer Degradation and Stability. 2002; 75:321–327. http://dx.doi.org/10.1016/S0141-3910(01)00234-8
11. Conti DS, Yoshida MI, Pezzin SH and Coelho LAF. P h a s e b e h a v i o r o f p o l y ( 3 - h y d r o x y b u t y r a t e ) / p o l y (3-hydroxybutyrate-co-3-hydroxyvalerate) blends. Fluid Phase Equilibria. 2007; 261:79-84. http://dx.doi.org/10.1016/j. luid.2007.07.022
12. Camargo M, Forte MMC and Wolf CR. Linear Low Density Polyethylene Thermal Fractionation by DSC Technique. International Journal of Polymer Analysis and Characterization. 2008; 13:49-65. http://dx.doi. org/10.1080/10236660701802593
13. Munaro M and Akcelrud L. Polyethylene blends: A correlation study between morphology and environmental resistance.
Polymer Degradation and Stability. 2008; 93:43-49. http:// dx.doi.org/10.1016/j.polymdegradstab.2007.10.017
14. Liang S, Yang H, Wang K, Zhang Q, Du R and Fu Q. Unique crystal morphology and tensile properties of injection-molded bar of LLDPE by adding HDPE with different molecular weights. Acta Materialia. 2008; 56:50–59. http://dx.doi. org/10.1016/j.actamat.2007.09.008
15. Lo C, Seifert S, Thiyagarajan P and Narasimhan B. Phase behavior of semicrystalline polymer blends.
Polymer. 2004; 45:3671-3679. http://dx.doi.org/10.1016/j. polymer.2004.03.089
16. Canevarolo SV. Technical of polymers characterization. São Paulo: Artliber; 2004.
17. International Standards Organization – ISO. ISO 1183-1:04:
Methods for Determining the Density of Non-Cellular Plastics. ISO; 2004.
18. American Society for Testing and Materials – ASTM.