Structural and Photoacoustic Study of Cr
11Ge
19Prepared by Mechanical Alloying
Ailton da Silva Ferreiraa, Patricia Bodanese Pratesa, Claudio Michel Pofob, João Cardoso de Limac*,
Ronaldo Sergio de Biasid
Received: October 22, 2016; Revised: April 21, 2017; Accepted: May 22, 2017
A nanostructured Cr11Ge19 phase was produced by mechanical alloying for 15 h. Decomposition occurred for larger milling times, yielding Cr, Ge, Cr2O3 and GeO2. According to the Cr-Ge phase diagram, the Cr11Ge19 phase is stable up to ≈ 928 oC, but, when submitted to milling, a structural instability
causes its decomposition. We studied this structural instability using the coordination numbers and interatomic distances of bulk Cr11Ge19 to simulate the structure factors SCrCr(K), SCrGe(K), and SGeGe(K). The radial distribution functions RDFCrCr(R), RDFCrGe(R) and RDFGeGe(R) were obtained by Fourier transforming the Sij(K) factors, and an important chemical disorder up to ≈7 Å was observed in the RDFCrGe(R) and RDFGeGe(R) functions. This chemical disorder was quantiied using Cowley-Warren
ij CW
a
parameter. The thermoelectric properties of the Cr11Ge19 phase were also studied.Keywords: Mechanical alloying; X-ray difraction; Rietveld method; Photoacoustic absorption
spectroscopy; Thermal difusivity
* e-mail: [email protected]
1. Introduction
Alloys formed by Cr and Ge have potential applications in thermoelectric devices1 and in the electronic industry2–4 due
to low thermal conductivity and good adherence to silicon substrates. The Cr-Ge phase diagram5 has been studied by
several researchers6–11. Liu et al.10 used the CALPHAD method
and experimental data to calculate, at room temperature,
the enthalpy of formation ∆H for the phases Cr3Ge (∆H =
−15.33 kJmol−1), Cr
5Ge3 (∆H = −16.30 kJmol
−1), Cr 11Ge8
(∆H = −16.19 kJmol−1), CrGe (∆H = −13.85 kJmol−1),
and Cr11Ge19 (∆H = −10.16 kJmol−1). Zagryazhskii et al.11,
using the metallographic, X-ray difraction, and diferential
thermal techniques investigated the microstructure of Cr100-xGex alloys prepared by fusion. The Cr5Ge3 phase was obtained for compositions between 36.0 ≤ x≤ 37.5 at.%; Cr3Ge for compositions between 37.5 ≤ x≤ 38.0 at.%; Cr11Ge8 and Cr11Ge19 for compositions between 49.5 ≤ x ≤ 50.5 at.%; Cr11Gel9, CrGe and pure Ge for compositions between 63.3 ≤ x≤ 70.0 at.%; Cr11Gel9 and pure Ge for compositions between 75.0 ≤ x≤ 80.0 at.%; and Cr11Gel9 and CrGe for compositions between 60.0 ≤ x≤ 62.0 at.% after annealing. These studies suggest that the formation of microstructures containing more than one phase is related
to the small diference between the enthalpies of formation
of the Cr-Ge phases.
Mechanical Alloying (MA) is a technique where moderate pressures are applied, and has been used as an alternative way for synthesizing crystalline12, nanostructured13, amorphous14,
and solid solution phases15. MA has many advantages including
processing at low temperatures, easy composition control, use of relatively inexpensive equipment and the possibility of scaling up. It has also been used to produce some commercially important alloys in a much simpler way and, in particular,
those alloys whose components present a great diference in
their melting points, such as iron and germanium16, causing
diiculties in the use of techniques based on fusion. For some
systems, MA provides an increase in the limit of solubility in solid solutions12. It has been applied to mixtures composed
of immiscible elements12, allowing the formation of unstable
solid solutions in equilibrium conditions.
In the last two decades, our research group has been producing materials in the nanostructured, amorphous and solid solution phases using MA. From the structural point of view, nanostructured materials are described by two components: one crystalline, of nanometer dimensions (2-100 nm), which preserves the bulk crystal characteristics, and another interfacial, composed of defect centers (grain boundaries, interphase
boundaries, dislocations, etc.). The irst one shows strained
crystal lattice regions, while the interfacial component has caused controversy in the literature. Gleiter17 describes it
based on a gaseous model, but other authors do not agree
a Departamento de Engenharia Mecânica, Universidade Federal de Santa Catarina, Campus Universitário Trindade, S/N, C.P. 476, 88040-900, Florianópolis, SC, Brazil
b Universidade Federal de Santa Catarina, Campus de Araranguá, 88900-000, Araranguá, SC, Brazil
c Departamento de Física, Universidade Federal de Santa Catarina, Campus Universitário Trindade, S/N, C.P. 476, 88040-900, Florianópolis, SC, Brazil
with this approach18. The fact that both components have approximately the same number of atoms leads to a strong dependence on the properties of the atomic arrangements on the interfacial component17. From a technological point of
view, manipulation of the interfacial component may ofer
the possibility of designing new materials with physical
properties for speciic applications17,18.
Fecht19 reported results on the thermodynamic properties
and the stability of grain boundaries in nanometric metals, which are obtained by inert-gas condensation and compaction or by high-energy cyclic deformation. He showed that there
is a critical excess relative volume (ΔV/V0) for the nanometric
structure to remains stable. When ΔV/V0 is larger than this critical value, the nanometric structure become unstable and decomposition may occur.
More than a decade ago, we proposed a thermodynamic approach to study the formation of binary alloys by MA, starting from blended crystalline elemental metal powders20.
In this approach, we assume that the mixture of interfacial
components of the elements in the ultraine composite
powder can be treated as an ideal solution, although it is a solid system, and that the solid state reaction in MA begins in this mixture. In order to promote nucleation and growth of new phases, activation energy must be supplied. This energy comes mainly from the mechanical energy of the balls, from elimination of defect centers, and from phase transformation. In order to use the thermodynamic approach to estimate the activation energy necessary to start atomic migration, we assumed the entropy of sublimation of a gas
as the cutof value for the entropy of the ideal solution. This
assumption overestimates the entropy of the ideal solution, but that does not change the general conclusions about the formation of alloys by MA. Solutions with calculated activation energies smaller than 0.030 eV/at are expected to yield amorphous alloys, while solutions with larger activation energies form crystalline phases or solid solutions. The thermodynamic approach was based on work by Fecht19
about the thermodynamic properties and the stability of grain boundaries in nanometric metals, which are obtained by inert-gas condensation and compaction or by high energy cyclic deformation produced in a standard ball mill. The details of the thermodynamic approach are described in Ref. 20 and will not be repeated here.
Recently, the thermodynamic approach was applied to the Cr-Ge system to study the formation of Cr100-xGex alloys by MA. The calculated activation energy (Ea) and excess
volume (ΔV/Vid) for diferent ideal solutions of Cr and Ge at
the temperatures 300, 323 and 373 K are listed in Table 1 of Ref. 21 and will not be repeated here. For the phases shown in the Cr-Ge phase diagram5, the calculated activation energies
at 323 K are: 0.0133 < Ea < 0.0216 eV for Cr11Ge19; Ea = 0.0309 eV for CrGe; 0.0309 < Ea < 0.0409 eV for Cr11Ge8; 0.0409 < Ea < 0.0462 eV for Cr5Ge3; and Ea = 0.0570 eV for Cr3Ge. In Ref. 21, a Cr75Ge25 mixture was subjected to MA,
and for milling times up to 15 h a nanostructured Cr11Ge19 phase together with an amorphous phase were formed. For longer milling times, both Cr11Ge19 and amorphous phases decomposed and the Cr3Ge phase emerged, remaining stable up to the highest milling time (32 h). Although the Cr-Ge phase diagram5 shows that the Cr
11Ge19 phase is stable up to ≈
928 oC, decomposition under milling was observed21. To the
best of our knowledge, this fact has not been reported in the literature. In order to understand the structural instability in the Cr11Ge19 phase promoted by the milling process, a Cr30Ge70 mixture was prepared and subjected to MA. The structural
changes for diferent milling times were investigated by X-ray difraction (XRD), diferential scanning calorimetry
(DSC) and photoacoustic absorption spectroscopy (PAS).
2. Experimental Procedure
Binary mixtures of high-purity elemental powders
of chromium (Alfa Aesar, purity 99.8%, spherical shape, particle size <10 μm) and germanium (Aldrich, purity 99.999%, spherical shape, particle size <150 μm) with
nominal composition of Cr30Ge70 were sealed together with several steel balls 11.0 mm in diameter in a cylindrical steel vial under argon atmosphere. The ball-to-powder weight
ratio was 5:1. A Spex Mixer/Mill model 8000 was used to
perform MA at room temperature. A ventilation system was used to keep the vial temperature close to room temperature. The XRD pattern of the Cr30Ge70 mixture was recorded before milling (t = 0 h). After 5, 10, 15, 20, 30, 40 and 50 h, milling was stopped and the XRD pattern of the powder was
recorded using a Philips X-Pert difractometer equipped with
a copper target and a graphite monochromator. After 15 h of milling, the XRD pattern showed an excellent agreement with the Cr11Ge19 and pure Ge phases given in the ICSD
codes 43049 and 41980, respectively22. For longer milling
times, decomposition of the Cr11Ge19 phase was observed.
The XRD patterns were reined using the Rietveld method23,
implemented in the GSAS package24. The XRD pattern of a
certiied elemental silicon sample was recorded in the same
experimental conditions and used to take into account the
instrumental broadening for the Rietveld reinements. For
each milling time listed above, DSC thermograms were acquired with a heating rate of 10 ºC min−1, under nitrogen
low, using a DSC cell model 2010, manufactured by TA
Instruments, Inc.
The thermal difusivity parameter after 15 h of milling
was calculated from PAS measurements performed in a homemade device in the open photoacoustic cell (OPC)
coniguration. The setup consists of a 250 W quartz-tungsten
halogen QTH lamp stabilized by a Bentham 605 current
power supply. The light beam, after being infrared iltered
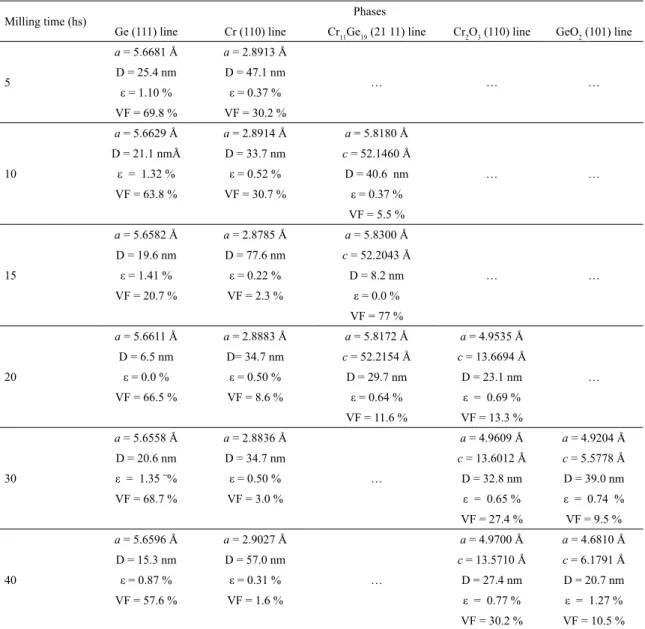
Table 1. Structural data for the nanostructured Cr11Ge19 phase and for the Cr, Ge, Cr2O3 and GeO2 phases for several milling times. Unit cell parameters (a,c), Apparent crystallite size (D). microstrain (ε), relative volume fraction (VF).
Milling time (hs) Phases
Ge (111) line Cr (110) line Cr11Ge19 (21 11) line Cr2O3 (110) line GeO2 (101) line
5
a = 5.6681 Å a = 2.8913 Å
… … …
D = 25.4 nm D = 47.1 nm
ε = 1.10 % ε = 0.37 %
VF = 69.8 % VF = 30.2 %
10
a = 5.6629 Å a = 2.8914 Å a = 5.8180 Å
… …
D = 21.1 nmÅ D = 33.7 nm c = 52.1460 Å
ε = 1.32 % ε = 0.52 % D = 40.6 nm
VF = 63.8 % VF = 30.7 % ε = 0.37 %
VF = 5.5 %
15
a = 5.6582 Å a = 2.8785 Å a = 5.8300 Å
… …
D = 19.6 nm D = 77.6 nm c = 52.2043 Å
ε = 1.41 % ε = 0.22 % D = 8.2 nm
VF = 20.7 % VF = 2.3 % ε = 0.0 %
VF = 77 %
20
a = 5.6611 Å a = 2.8883 Å a = 5.8172 Å a = 4.9535 Å
…
D = 6.5 nm D= 34.7 nm c = 52.2154 Å c = 13.6694 Å
ε = 0.0 % ε = 0.50 % D = 29.7 nm D = 23.1 nm
VF = 66.5 % VF = 8.6 % ε = 0.64 % ε = 0.69 %
VF = 11.6 % VF = 13.3 %
30
a = 5.6558 Å a = 2.8836 Å
…
a = 4.9609 Å a = 4.9204 Å
D = 20.6 nm D = 34.7 nm c = 13.6012 Å c = 5.5778 Å
ε = 1.35 ¨% ε = 0.50 % D = 32.8 nm D = 39.0 nm
VF = 68.7 % VF = 3.0 % ε = 0.65 % ε = 0.74 %
VF = 27.4 % VF = 9.5 %
40
a = 5.6596 Å a = 2.9027 Å
…
a = 4.9700 Å a = 4.6810 Å
D = 15.3 nm D = 57.0 nm c = 13.5710 Å c = 6.1791 Å
ε = 0.87 % ε = 0.31 % D = 27.4 nm D = 20.7 nm
VF = 57.6 % VF = 1.6 % ε = 0.77 % ε = 1.27 %
VF = 30.2 % VF = 10.5 %
electret microphone25. The output voltage of the microphone
is connected to a lock-in ampliier, which in turn is connected
to a computer in order to record the PAS signal amplitude and phase as functions of the modulation frequency. The samples for PAS measurements were prepared by pressing the powder at the same pressure to form tiny circular pellets of 10 mm in diameter. The thickness of the as-milled sample
was 380 μm. The PAS measurements were taken in the
modulation frequency range 10–270 Hz in order to achieve the thermally thick regime.
3. Results and Discussion
3.1 XRD and DSC results
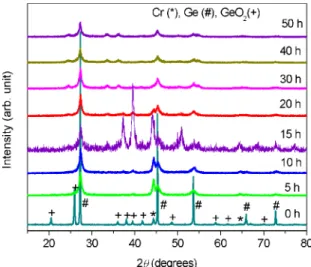
Figure 1 shows the XRD patterns of the Cr30Ge70 mixture for 0, 5, 10, 15, 20, 30, 40 and 50 h of milling. One can see
that the XRD pattern of blended powders before milling (0
h), besides the difraction peaks of elemental Cr (* symbol) and Ge (# symbol), shows difraction peaks of GeO2 (+
symbol), which are absent in the XRD pattern of elemental Ge powder as received. Probably the nucleation of GeO2 occurred during manipulation of blended powders to carry out the XRD measurements at ambient conditions, and is probably restricted to the region close to the particle surface. In a previous article21, this oxide phase was also observed,
but not discussed, in the XRD pattern of blended powders before milling. For a milling time of 5 h, the intensity of the
difraction peaks of pure Ge was smaller than in the initial
mixture and the peaks of GeO2 are absent. Convolution of
the (110) Cr and (220) Ge peaks located at about 2θ≈ 45o
Figure 1. (color online): XRD patterns of a Cr30Ge70 mixture for several milling times.
indicating the formation of one or more new phases. For 15 h of milling, the XRD pattern of the emerging phase(s) is
well deined. For 20 h of milling, the previous XRD pattern
is still observed, but the intensities of the peaks are much lower. In addition, another XRD pattern similar to that of pure Ge is observed, suggesting a possible decomposition of the majority phase seen at 15 h of milling. For milling times
longer than 20 h, besides the difraction peaks previously
observed, peaks located at about 2θ≈ 24.6o, 33.8o, and 36o
are seen, indicating that a new phase is emerging. All the XRD patterns shown in Figure 1 were simulated
using the Rietveld structural reinement method23, implemented
using the computational GSAS code24, which calculates the
relative amount of the phases. A pseudo-Voigt function,
pV(x), was used to describe the difraction peak proiles. All
the details about this function as well as its use in Rietveld
XRD analysis are presented in Refs. 26-28 and will not be repeated here. For the Rietveld structural reinements, the
structural data given in the ICSD codes 64712 for pure Cr,
41980 for pure Ge, 43049 for Cr11Ge19, 25781 for Cr2O3, and
16577 for GeO2 were used. The best its were obtained for the lattice parameters listed in Table 1. The relative amounts of pure Cr and Ge, Cr11Ge19, Cr2O3, and GeO2 as well as the apparent crystallite size and the microstrain calculated using the single-line method26,27 are also listed in Table 1.
The apparent crystallite size corresponding to the Cr11Ge19 alloy after 15 h of milling indicates a nanostructured phase.
The Rietveld reinement of the XRD pattern for 5 h of
milling (not shown) considering the data for pure Cr and
Ge only shows two additional difraction halos, located at
about 2θ≈ 27o and 45o, suggesting the emergence of an
amorphous phase. These two halos are better seen in the
simulated XRD pattern of Cr. Reinement of the XRD pattern
for 10 h of milling (not shown) using data for the previous phases and for Cr11Ge19 yielded a relative volume fraction
of approximately 5.5 % Cr11Ge19. Reinement of the XRD pattern for 15 h of milling using the data for Cr, Ge and Cr11Ge19 (see Figure 2) yielded relative volume fractions of 2.3 % Cr, 20.7 % Ge and 77 % Cr11Ge19. Reinement of the XRD pattern for 20 h of milling considering the previous phases and the data for Cr2O3 (not shown) yielded a relative volume fraction of 11.6% Cr11Ge19. Rietveld reinements for the XRD patterns for milling times longer than 20 h (not shown) were performed using only the data for Cr, Ge, Cr2O3 and GeO2. As shown in Table 1, the values of the relative volume fractions of Cr2O3 and GeO2 increase with increasing milling time. Also, it was observed from
the reinement of the XRD pattern for 40 h of milling (not
shown) that the intensity of two amorphous halos is higher, suggesting that the relative amount of the amorphous phase grows with increasing milling time. As an illustration of
the good quality of the reinements, the experimental and
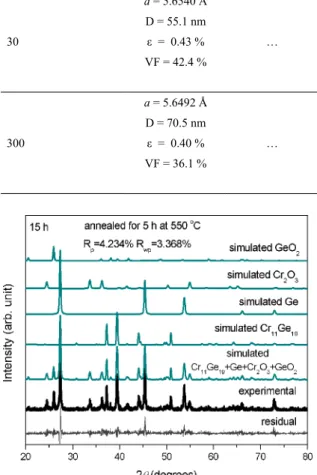
simulated XRD patterns for 15 h of milling are shown in Figure 2, where one can see an excellent agreement.
Figure 2. (color online): Experimental and simulated XRD patterns of a Cr30Ge70 mixture milled for 15 h. The diference between experimental and simulated patterns (bottom line) is also shown.
From the results above one can see that for milling times longer than 15 h, the Cr11Ge19 phase starts to decompose into elemental Cr and Ge, but, at the same time, we observe the formation of Cr2O3 and GeO2 phases whose volume fraction increases with increasing milling time. The milling was performed under an argon atmosphere, but the XRD patterns were recorded at ambient conditions. Thus, probably the nucleation and growth of Cr2O3 and GeO2 occurred during manipulation of the as-milled powders to perform the XRD measurements. Probably the oxide phases are restricted to the region close to the particle surface.
the procedure described in Ref. 29. The contributions of the
interfacial component and the amorphous phase are difuse
and hard to separate. To do this, the measured intensity was corrected for polarization, reabsorption and inelastic scattering and converted to electron units using the mean square scattering factor f K c fii K
i
2Q V =/ 2Q V30, where K=4πsin(θ)/λ is
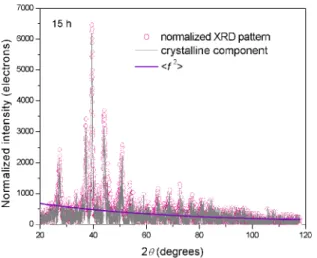
the transferred momentum, ci is the concentration of atoms of type i, f(K)=f0(K)+f ’(E)+if ’’ (E) is the atomic scattering factor, f ’(E) and f ’’(E) are the anomalous dispersion terms, and E is the energy. An evaluation of the background contribution to normalized XRD pattern and its subtraction yields the contribution of nanometric Cr11Ge19 crystallites. The background was estimated using the OriginLab Corporation software. The ratio between the integrated intensity of the contribution of nanometric Cr11Ge19 crystallites and the whole XRD pattern gives a crystalline volume fraction of 75.2%, and, consequently, the sum of the interfacial component and amorphous phase corresponds to relative volume fraction of
24.8%. The contributions of pure Cr and Ge were subtracted
before calculating the ratio. This procedure is shown in Figure
3. In this igure, the f K2Q V
factor is shown as a function
of the difraction angle 2θ. Rietveld reinement does not
take into account the contribution of the background to the relative volume fractions of the phases. Thus, considering the interfacial component and amorphous phase relative
volume fraction of 24.8%, the crystalline relative volume
fractions of Cr, Ge and Cr11Ge19 crystallites are 3.1%, 27.5 % and 44.6%, respectively.
In order to conirm the nucleation of an amorphous phase,
DSC measurements were performed on the sample milled
for 15 h; the thermograms are shown in Figure 4. The irst
measurement (solid red line) shows an exothermic band from 50 to 450 oC and an exothermic peak at 498.17 oC.
The exothermic band is attributed to structural relaxation
(elimination of defects and atomic difusive processes) and
Figure 3. (color online): Normalized XRD pattern of a Cr30Ge70 mixture milled for 15 h in electron unit: all contributions (open circles line, crystalline contribution (gray line) and the mean square scattering factor <f2> (violet line).
Figure 4. (color online): DSC thermograms of a Cr30Ge70 mixture milled for 15 h, using a heating rate of 10 oC min-1.
the exothermic peak to crystallization of the amorphous phase. A second thermogram (blue dotted line) was recorded
using the same sample in order to conirm the crystallization
of the amorphous phase, and the exothermic peak seen previously is absent.
In order to investigate the structural stability of the Cr11Ge19 phase upon heating, two batches of a sample milled for 15 h were sealed in tubes of quartz evacuated to a pressure of less than 10−3 Torr, annealed at 550 ºC for
diferent periods of time, 30 min and 5 h, and cooled in air.
The XRD patterns of the annealed samples were recorded
and reined by the Rietveld method23, 24. The XRD pattern for
30 min of annealing was reined using the ICSD codes for
Ge, Cr11Ge19, and Cr2O3, whereas that for 5 h of annealing
was reined using the same ICSD codes plus that for GeO2.
The best its were obtained for the lattice parameters listed in
Table 2. This table also shows the relative volume fractions for Ge, Cr11Ge19, Cr2O3, GeO2, the apparent crystallite size (D), and microstrain (ε) determined using the single-line method26-28. Figure 5 shows the experimental and simulated XRD patterns for the sample annealed for 5 h. In order to understand the sequence of formation of the Cr2O3 and GeO2 phases with increasing annealing time, an analysis of the enthalpies of formation may be helpful. According to the TAPP software5, the enthalpies of formation for the
Cr2O3 and GeO2 phases are −1058.11 kJmol-1 and −521.30
kJmol-1, respectively. These values show that the Cr
2O3 phase
Table 2. Structural data for the nanostructured Cr11Ge19 phase and for the Cr, Ge, Cr2O3 and GeO2 phases after 15 h of milling and annealed for 30 and 300 min at 550 oC. Unit cell parameters (a,c), Apparent crystallite size (D). microstrain (ε), relative volume fraction (VF).
Annealing Time (min) Phases
Ge (111) line Cr (110) line Cr11Ge19 (21 11) line Cr2O3 (110) line GeO2 (101) line
30
a = 5.6540 Å
…
a = 5.8086 Å a = 4.9584 Å
…
D = 55.1 nm c = 52.3834 Å c = 13.5868 Å
ε = 0.43 % D = 31.2 nm D = 44.3 nm
VF = 42.4 % ε = 0.10 % ε = 0.48 %
VF = 33.5 % VF = 24.1 %
300
a = 5.6492 Å
…
a = 5.8025 Å a = 4.9573 Å a = 4.9793 Å
D = 70.5 nm c = 52.3457 Å c = 13.5657 Å c = 5.6382 Å
ε = 0.40 % D = 51.2 nm D = 31.8 nm D = 77.4 nm
VF = 36.1 % ε = 0.15 % ε = 0.67 % ε = 0.38 %
VF = 31.7 % VF = 24.2 % VF = 8.0 %
Figure 5. (color online): Experimental and simulated XRD patterns of a Cr30Ge70 mixture milled for 15 h and annealed for 5 h at 550
oC. The diference between experimental and simulated patterns
(bottom line) is also shown.
The oxide phases are probably restricted to the region close to the particle surface.
Chemical disorder is among the physical mechanisms responsible for phase transition, amorphization and decomposition of alloys under pressure and/or temperature, but it has not received the attention it deserves. In this
study, we investigate the inluence of this mechanism on
decomposition of the nanostructured Cr11Ge19 phase under milling. The Cowley-Warren chemical short-range order (CSRO) parameter used to study the statistical distribution of atoms in solids, is given by31
.
, ( )
c c N
N
c N
N
N
1 0
1
i j CW
j j ii ij i jj ji
ij
a
=
-+
+
+
Q
V
Q
V
" %
where Nii, Nij and Njj are the coordination numbers and ci and cj are the concentrations of atoms of the elements i and j.
The αCW parameter is zero for a random distribution, negative
if there is a preference for forming unlike pairs and positive if homopolar pairs (clusters or local order) are preferred. Although the αCW parameter is usually applied to amorphous phases, it can
also be used to determine the relative preference for forming
diferent atomic pairs and thus to investigate the crystallization
behavior of a binary alloy. In order to obtain the coordination numbers NCrCr, NCrGe, NGeCr and NGeGe, the structural data given in ICSD 43049 for the Cr11Ge19 phase were used in the Crystal
Oice 98 software32 to build the 3D structure, and using the tool
“shell structure” the RCrCr, RCrGe, and RGeGe interatomic distances
were calculated up to 10 Å. The ICSD code 43049 gives the following data: tetragonal structure (S.G. P -4 n 2, No. 118 ,
Z=4, a = b = 5.8 Å, c = 52.34 Å, α = β = γ = 90o), twelve Cr
atoms at the Wyckof positions Cr1 2a (0, 0, 0), Cr2 2c (0, 0.5, 0.25), Cr3 4e (0, 0, 0.0909), Cr4 4e (0, 0, 0.1818), Cr5 4e (0, 0, 0.2723), Cr6 4e (0, 0, 0.364), Cr7 4e (0, 0, 0.4543), Cr8 4h (0, 0.5, 0.0684), Cr9 4h (0, 0.5, 0.1589), Cr10 4h (0, 0.5, 0.5227),
Cr11 4h (0, 0.5, 0.6131), Cr12 4h (0, 0.5, 0.7047), and ten Ge
atoms at the Wyckof positions Ge1 4g (0.679, 0.179, 0.25), Ge2 8i (0.239, 0.348, 0.0132), Ge3 8i (0.843, 0.208, 0.04), Ge4 8i (0.313, 0.167, 0.066), Ge5 8i (0.677, 0.327, 0.0922 ), Ge6 8i (0.159, 0.298, 0.1184 ), Ge7 8i (0.778, 0.153, 0.1442), Ge8 8i (0.348, 0.258, 0.1712), Ge9 8i (0.783, 0.342, 0.1976), Ge10 8i (0.163, 0.196, 0.224). By putting Cr and Ge atoms at origin,
twelve Cr-Cr and Cr-Ge shell structures and ten Ge-Ge and Ge-Cr shell structures were obtained. Of course, the number of
repetitions of a speciic Rp interatomic distance corresponding
to a speciic ij atomic pair is equal to the coordination number
Nij at this distance. All the shell structures showed very close
interatomic distances, making diicult to identify the lower
and upper limits of the coordination shells. Then, the Nij and Rp values were used to calculate the SCrCr(K), SCrGe(K) and SGeGe(K) structure factors using the expression33
( )
sin
S
K
1
N
R K
R K
2
min max
ij p
p p i
p i
i K K
= +
=
where K is the transferred momentum. The 0.05 Å-1≤K
≤12 Å-1 interval, with step ΔK = 0.05 Å-1, was used.
The partial reduced distribution functions γij(R) are related to Sij(K) by Fourier transformation and may be written as
is a good approach to simulate the Sij(K) factors. Using the
lower and upper limits of the irst three coordination shells, the
coordination numbers were obtained. The values are similar
to those obtained from the Crystal Oice 98 software. By
considering the twelve RDFCrCr(R) and RDFCrGe(R) functions, the average coordination number and interatomic distance
values of irst three coordination shells are NCrCr = 4 at ≈
3.12 Å, NCrCr = 14 at ≈ 4.73 Å, NCrCr = 4 at ≈ 5.79 Å, NCrGe
= 8 at ≈ 2.58 Å, NCrGe = 10 at ≈ 3.31 Å, and NCrGe = 22 at ≈
4.26 Å, whereas considering the ten RDFGeGe(R) functions the values are NGeGe = 8 at ≈ 3.0 Å, NGeGe = 4 at ≈ 3.96 Å, and
NGeGe = 15 at ≈ 4.94 Å. The coordination numbers for the NGeCr neighbors are obtained using the relationship cCrNCrGe
= cGeNGeCr. Using the values above in Eq. (1), values of aCrGeCW
=-0.04, aCrGeCW=0.15, and aCrGeCW= -0.31 are obtained for the 1st,
2nd and 3rd coordination shells, respectively. These values
indicate a random distribution of Cr and Ge atoms in the irst
shell, a preference for forming homopolar pairs in the second shell and a preference for forming unlike pairs in the third shell. The calculated αCW values for the 1st and 2nd coordination
shells suggest that the repulsive part of the crystalline ield
plays an important role in the structural stability of this phase. According to Fecht19, there is a critical excess volume
(ΔV/V0) for which the nanometric structure remains stable.
When ΔV/V0 is larger than this critical excess volume, the nanometric structure become unstable and decomposition may occur. For nanometric pure Cr and Ge powders, the
critical excess volumes are ΔV/V0 = 0.392 and 0.428, respectively. As shown in Ref. 21, an ideal solution with Cr11Ge19 nominal composition has ΔV/V0 = 0.415. For 15 h of milling, the interfacial and amorphous volume fractions of the nanostructured Cr11Ge19 alloy occupy an excess volume
ΔV/V0 = 0.248. Figure 1 shows that for milling times longer than 20 h the nanostructured Cr11Ge19 alloy is gradually disappearing and it is no more seen at 30 h of milling. This
indicates that the excess volume ΔV/V0 is increasing with increasing milling time, and increasing also the structural instability of Cr11Ge19. We believe that the chemical disorder
present in the irst and second Cr-Ge and Ge-Ge coordination shells increases with increasing excess volume ΔV/V0, and probably promotes decomposition of the nanostructured Cr11Ge19 phase when ΔV/V0 > 0.415.
3.2. PAS measurements
The use of photoacoustic absorption spectroscopy to
determine the thermal difusivity parameter and/or the
transport properties of semiconducting materials is widely documented in the literature34-40 and references therein. The
thermal difusivity may be calculated using the expression
for the thermal conductivity Kt=ρCpα, where ρ is the density, Cp is the speciic heat, and α is the thermal difusivity. For the Cr11Ge19 phase, the TAPP software5 gives values of ρ = 7359 kg m−3 and C
p= 359 J kg−1 K−1. Caillat et al.41
/
sin
. ( )
R
R G R
K S K
KR dK
4
1
2
1
3
ij ij
ij
0
0
c
rt
r
=
-
=
-3Q
Q
Q
Q
Q
V
V
V
V
V
" "
% %
#
The partial radial distribution functions RDFij(R) may be written as
, ( )
RDF R
ijQ
V
=
4
rt
0c R G
j 2 ijQ
R
V
4
where ρ0 is the atomic density of the alloy in Å−3 and c j
is the concentration. The average interatomic distances Rij of the coordination shells are obtained from the maxima of
γij(R), whereas the coordination numbers Nij are obtained
by integrating the peaks of RDFij(R).
Figure 6a-c shows the calculated RDFCrCr(R), RDFCrGe(R), and RDFGeGe(R) functions (solid lines) using the Cr-Cr, Cr-Ge,
and Ge-Ge distances given by the Crystal Oice 98 software. In this igure, the symbols are the interatomic distances and
coordination numbers (number of repetitions of these distances)
given by the Crystal Oice 98 software. All the calculated γCrCr
and RDFCrCr(R) functions are similar to those shown in Figure 6a. From the RDFCrGe(R) and RDFGeGe(R) functions shown in Figures. 6b and 6c one can see an important chemical disorder in the Cr-Ge and Ge-Ge pairs up to R ≈ 7 Å. The γCrGe and
γGeGefunctions are not shown. These results show that Eq. (2)
Figure 6. (color online): Partial reduced distribution and radial distribution functions simulated using the interatomic distances
up to 10 Å given by the Crystal Oice 98 software in Eq. (2). The
symbols are the interatomic distances and coordination numbers
obtained by using the Crystal Oice 98 software (see text): γCrCr
(blue line) and RDFCrCr (red line) (a); RDFCrGe(R) (colored lines)
reported a value Kt = 4.1 Wm−1K−1 at room temperature for
the Cr11Ge19 phase. Using these values in expression for the thermal conductivity above, a value of α = 1.552 x 10⁻⁶ m2s−1
or 0.01552 cm2s−1 is obtained. Those researchers also reported
a value of electrical resistivity at room temperature of ρe = 1.7 µΩ m. The electrical conductivity σe = 1/ρe = 0.5882 x 10⁶
Ω−1m−1 shows that this phase has a character of conductive
material (σe > 105 Ω−1m−1 and no band gap (E
g= 0). The
characteristic frequency fc=α/(πls2), where l
s is the sample
thickness, fcis the modulation frequency corresponding to the transition from the thermally thin regime (f < fc) to the thermally thick regime (f > fc). The as-milled sample thickness
was 380 µm, giving a characteristic frequency of 3.4 Hz. In
order to perform PAS measurements in the thermally thick regime, the data were acquired between 10 and 270 Hz.
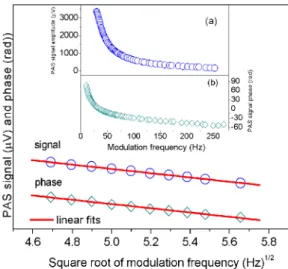
The recorded PAS signal amplitude and phase for the as-milled Cr11Ge19 phase after 15 h of milling are shown in the inset of Figure 7. One can see that both amplitude and phase decrease with increasing modulation frequency. Due to the high thermal conductance of the Cr11Ge19 phase, only
the intraband nonradiative thermalization (thermal difusion)
and/or thermoelastic bending mechanisms contribute to
PAS signal. Thermal difusion occurs in the low frequency
range, followed by thermoelastic bending. The procedure
to ind the contribution of each process to pressure variation
in the photoacoustic cell is described in Ref. 40 and it will not be repeated here. Figure 7 shows the plots ln(S) vs f
and Φph (rad) vs f for modulations frequencies between
22 and 32 Hz, where the thermal difusion mechanism is
the main contribution to PAS signal amplitude and phase. In this frequency range, the slopes of the straight lines are a = − 0.3108 (for the amplitude) and a = − 0.3082 (for the phase). Using the expression lsa
2
a=rS X, the values of αef =
Figure 7. (color online): PAS amplitude (upper line) and PAS phase (lower line) vs modulation frequency of a Cr30Ge70 mixture milled for 15 h showing the intraband nonradiative thermalization (thermal
difusion) mechanism. Inset: (a) PAS amplitude and (b) PAS phase
vs modulation frequency.
0.047 cm2s-1 for the amplitude and α
ef = 0.048 cm2s-1 for the
phase are calculated.
As shown in Figure 2, the microstructure of the as-milled sample for 15 h is formed by the Cr, Ge and Cr11Ge19 phases.
The efective thermal difusivity αef is described by the
Lichtenecker’s logarithmic mixture law42,43,
( )5
x
eff n n 1
3
n
a = a
=
%
where n is the number of phases; x and α are the volume
fraction and thermal difusivity of each phase, respectively.
Using the data for Cr and Ge given in the software PTOE44
in the expression for the thermal conductivity Kt=ρCpα,
thermal difusivity values of αCr = 0.2896 cm
2s-1 for Cr and
αGe = 0.3517 cm
2s-1 for Ge are obtained. Using an average
thermal difusivity value of <αef > = 0.0475 cm2s−1 for the
as-milled sample for 15 h and the relative volume fraction values of Cr (3.1 %) , Ge (27.5 %) and Cr11Ge19 (69.4 %)
[crystalline (44.6 %) + interfacial plus amorphous (24.8 %)
components] in expression (5), a value of α = 0.01978 cm2
s−1 is obtained for the nanostructured Cr
11Ge19 phase plus
an amorphous phase. This value is slightly larger than that calculated using data from the Refs. 5 and 41 (α = 0.01552 cm2
s−1). The diference is attributed to the nanometric structure of
the Cr11Ge19 phase and the presence of an amorphous phase. The performance of a thermoelectric material can be improved if its thermal conductivity is reduced without a
signiicant degradation of its electrical properties. It has been
reported that materials having small crystallite size have larger
thermoelectric conversion eiciency due a decrease in thermal
conductivity45. Thermoelectric materials are characterized by
a dimensionless igure of merit, ZT = (S2σe Kt−1T), where S is
the Seebeck coeicient, σe is the electrical conductivity, Kt is
the thermal conductivity, and T is the absolute temperature. For high performance, a thermoelectric material should have ZT > 1. As shown in Table 1, the apparent crystallite size for the Cr11Ge19 phase after 15 h of milling has nanometer dimensions (D = 8.2 nm). It is interesting to estimate the
inluence of the apparent crystallite size on ZT. The thermal conductivity Ktmay be estimated using the previously given
expression and a speciic heat Cp= 359 J kg−1 K−1 5. From
the Rietveld reinement of the XRD pattern for 15 h of
milling, a density value of ρ = 7302 kg m−3 was obtained.
Considering the thermal difusivity value of α = 0.01978
x 10−4 m2 s−1, a value of K
t = 5.2 Wm−1K−1 was obtained.
This value is slightly larger than that reported in Ref. 41. For the Cr11Ge19 phase,this reference reports a value of S
≈ 34 μV/K for the Seebeck coeicient. Using these values in the expression for ZT, a value of ZT ≈ 0.0393 at room
temperature is obtained. This value is slightly smaller than
that calculated using the data given in Ref. 41 (ZT ≈ 0.0497).
Of course, for an accurate evaluation of ZT, the parameters
σe, Cp, and S for the nanostructured Cr11Ge19 phase should
4. Conclusions
In this work, a nanostructured Cr11Ge19 phase was successfully produced by mechanical alloying and its structural stability under milling was investigated. A thermodynamic analysis suggested that other Cr-poor alloys could be formed and, in fact, an amorphous phase was also formed. For milling times longer than 15 h, decomposition of the Cr11Ge19 phase into pure Cr and Ge was observed. Due to the presence of oxygen within the milling vial and/or during manipulation of the as-milled samples to perform XRD measurements at ambient conditions, nucleation and growth of Cr2O3 and GeO2 occurred. These oxide phases are probably restricted to the region close to the particle surface. Using the Cr-Cr, Cr-Ge and Ge-Ge interatomic distances and coordination numbers up to
10 Å obtained by using the Crystal Oice 98 software,
the SCrCr(K), SCrGe(K) and SGeGe(K) structure factors were simulated, and their Fourier transformation permitted to obtain the RDFCrCr(R), RDFCrGe(R) and RDFGeGe(R) radial distribution functions. The RDFCrGe(R) and RDFGeGe(R) functions showed an important chemical disorder up to
≈ 7 Å, suggesting that the decomposition of the Cr11Ge19
phase into pure Cr and Ge may be related with this strong chemical disorder, which increases with increasing milling time. The calculated Cowley-Warren chemical
short-range order (CSRO) parameter values for the irst three
coordination shells indicated a random distribution of Cr
and Ge atoms in the irst shell, a preference for forming
homopolar pairs in the second shell, and a preference for forming unlike pairs in the third shell.
The PAS analysis yielded a value of α = 0.01978 cm2 s−1
for the thermal difusivity parameter of the nanostructured
Cr11Ge19 phase plus an amorphous phase. This value is slightly larger than that calculated for the bulk Cr11Ge19 phase (α = 0.01552 cm2 s−1) using data from the literature.
The calculated dimensionless igure of merit ZT for the
thermoelectric nanostructured Cr11Ge19 phase ( ZT ≈ 0.0393) is slightly smaller than that reported in the literature for the bulk Cr11Ge19 phase (ZT ≈ 0.0497).
5. Acknowledgments
The author Ailton da Silva Ferreira thanks CNPq for
inancial support.
6. References
1. Pécheur P, Toussaint G, Kenzari H, Malaman B, Welter R. Ferromagnetism of the chimney-ladder compound Cr11Ge19.
Journal of Alloys and Compounds. 1997;262-263:363-365.
2. Borek MA, Oktyabrsky S, Aboelfotoh MO, Narayan J. Low resistivity copper germanide on (100) Si for contacts and interconnections. Applied Physics Letters. 1996;69(23):3560.
3. Agnelo PD, Kesan VP, Tejwani M, Ott JA. Titanium silicide/ germanide formation on submicron features for high mobility
SiGe channel ield efect transistors. Journal of Electronic
Materials. 1994;23(4):413-421.
4. Ashburn SP, Öztürk MC, Wortman JJ, Harris G, Honeycutt J, Maher DM. Formation of titanium and cobalt germanides on Si (100) using rapid thermal processing. Journal of Electronic
Materials. 1992;21(1):81-86.
5. TAPP Software, Version 2.2. E.S. Wade Court: Microwave Inc.; 1998.
6. Yassin A, Castanet R. Calorimetric study of Cr-Ge alloys.
Intermetallics. 1999;7(1):79-82.
7. Jandl I, Richter KW. A revision of the central part of the Cr–Ge phase diagram. Journal of Alloys and Compounds.
2010;500(1):L6-L8.
8. Zarembo SN, Myers CE, Kematick RJ, Zavalij PY, Whittingham
MS, Cotts EJ. Vaporization thermodynamics and heat capacities of Cr3Ge and Cr5Ge3. Journal of Alloys and Compounds. 2001;329(1-2):97-107.
9. Goswami R, Kioseoglou G, Hanbicki AT, Jonker BT, Spanos G. Formation of Cr–germanide nanoparticles during growth of
epitaxial Ge–Cr thin ilms. Acta Materialia. 2004;52(8):2419-2427.
10. Liu YQ, Du Y. Thermodynamic description of the Cr–Ge system.
Calphad. 2010;34(1):26-35.
11. Zagryazhskii VL, Shtol’ts AK, Gel’d PV, Kuz’menko NV. Phase diagram of the system chromium-germanium. Soviet Powder
Metallurgy and Metal Ceramics. 1966;5(8):639-642.
12. Suryanarayana C. Mechanical alloying and milling. Progress
in Materials Science. 2001;46(1-2):1-184.
13. de Lima JC, Borba EC, Paduani C, dos Santos VHF, Grandi TA, Rechenberg HR, et al. Mechanical alloying of Fe and Zn: phase analysis and Mössbauer studies. Journal of Alloys and
Compounds. 1996;234(1):43-47.
14. de Lima JC, Jerônimo AR, Gomez A, Souza SM, Trichês DM, Campos CEM, et al. Structural investigation of an amorphous Si24Nb76 alloy produced by mechanical alloying using reverse Monte Carlo simulations. Journal of Non-Crystalline Solids.
2008;354(40-41):4598-4602.
15. Peña Rodriguez VA, Baggio-Saitovitch EM, Xia SK, Larica C, de Lima JC. Mechanical alloying of Fe and Cr: Structural and magnetic studies. Hyperine Interactions. 1992;69(1):721-724.
16. de Lima JC, Silva JER, Grandi TA, Sartorelli ML, Silva MR,
Filho AB, et al. X-Ray Difraction, Mössbauer and Magnetization
Studies of Nanocrystalline Fe33Ge67 Alloy Prepared by Mechanical Alloying. Hyperine Interactions. 2001;136(1):45-56.
17. Gleiter H. Materials with ultraine microstructures: Retrospectives
and perspectives. Nanostructured Materials. 1992;1(1):1-19.
18. Stern EA, Siegel RW, Newville M, Sanders PG, Haskel D. Are
Nanophase Grain Boundaries Anomalous? Physical Review
Letters. 1995;75(21):3874-3877.
19. Fecht HJ. Thermodynamic properties and stability of grain boundaries in metals based on the universal equation of state at negative pressure. Acta Metallurgica et Materialia.
20. de Lima JC, dos Santos VHF, Grandi TA, D’Ajello PCT, Dmitriev A. Thermodynamic considerations about the formation of alloys by mechanical alloying. Physical Review
B. 2000;62(13):8871-8877.
21. Prates PB, Maliska AM, Ferreira AS, Pofo CM, Borges ZV,
de Lima JC, et al. Structural, thermal, and photoacoustic study of nanocrystalline Cr3Ge produced by mechanical alloying.
Journal of Applied Physics. 2015;118(15):154903.
22. FIZ. Inorganic Crystal Structure Database (ICSD). Kalrsruhe: Gmelin—Institute fur Anorganische Chemie and Fachinformationszentrum (FIZ); 1995.
23. Rietveld HM. A proile reinement method for nuclear and magnetic
structures. Journal of Applied Crystallography. 1969;2:65-71.
24. Larson AC, von Dreele RB. General Structure Analysis System
(GSAS).Report LAUR 86-748. Los Alamos: Los Alamos National Laboratory; 2000.
25. de Lima JC, Cella NL, Miranda LCM, An Chying C, Franzan AH, Leite NF. Photoacoustic characterization of chalcogenide
glasses: Thermal difusivity of GexTe1−x. Physical Review B.
1992;46:14186-14189.
26. Young RA, ed. The Rietveld Method. Oxford: Oxford University Press; 1996.
27. Rodriguez-Carvajal J. Study of micro-structural efects by powder difraction using the program FULLPROF. Available from:
<http://www.cdifx.univ-rennes1.fr/fps/Microstructural_efects.
pdf>. Access in 27/05/2017.
28. Dasgupta P. On the intrinsic hook efect associated with
pseudo-Voigt proiles. Journal of Applied Crystallography. 2002;35(Pt
2):267-269.
29. Pofo CM, de Lima JC, Souza SM, Triches DM, Grandi TA, de
Biasi RS. Structural, thermal and optical study of nanocrystalline silicon produced by ball milling. Journal of Raman Spectroscopy. 2010;41(12):1606-1609.
30. Wagner CNJ. Difraction analysis of liquid metals and alloys.
In: Beer SZ, ed. Liquid Metals: Chemistry and Physics. New York: Marcel Dekker; 1972.
31. Maret M, Chieux P, Hicter P, Atzmon M, Johnson WL. Partial structure factors and chemical short-range order in Ni33Y67 and Cu33Y67 metallic glasses. Journal of Physics F: Metal Physics.
1987;17(2):315.
32. Atomic Softek. Crystal Oice 98 software. Hamilton: Atomic Softek.
33. Mangin P. Les Amorphes Métalliques. Paris: Les Editions de
Physique; 1984.
34. Rosencwaig A, Gersho A. Theory of the photoacoustic efect
with solids. Journal of Applied Physics. 1976;47(1):64.
35. Vargas H, Miranda LCM. Photoacoustic and related photothermal techniques. Physics Reports: A Review Section of Physics
Letters. 1988;161(2):43-101.
36. Pinto Neto A, Vargas H, Leite NF, Miranda LCM. Photoacoustic characterization of semiconductors: Transport properties
and thermal difusivity in GaAs and Si. Physical Review B.
1990;41(14):9971.
37. Souza SM, Trichês DM, de Lima JC, Grandi TA, de Biasi RS. Structural, optical and photoacoustic study of Sb2Te3 prepared by mechanical alloying. Physica B: Condensed Matter.
2010;405(13):2807-2814.
38. Pofo CM, de Lima JC, Souza SM, Trichês DM, Grandi TA,
de Biasi RS. Photoacoustic study of nanocrystalline silicon produced by mechanical grinding. Physica B: Condensed
Matter. 2011;406(8):1627-1632.
39. Trichês DM, Souza SM, de Lima JC, Grandi TA, Campos CEM. Structural and photoacoustic studies of Zn4Sb3 and ZnSb phases prepared by mechanical alloying. Journal of Applied Physics.
2009;105(6):063518.
40. de Lima JC, Schmitt M, de Souza SM, Almeida TO, Jerônimo AR, Trichês DM, et al. Structural and thermal study of nanostructured GaSb alloy prepared by mechanical alloying. Journal of Alloys
and Compounds. 2007;436(1-2):13-18.
41. Caillat T, Fleurial JP, Borshchevsky A. Growth and some properties of Cr11Ge19. Journal of Alloys and Compounds. 1997;252(1-2):12-15.
42. Lichtenecker K. Die Dielektrizitätskonstante künstlicher und natürlicher Mischkörper. Physikalische Zeitschrift.
1926;27:115-118.
43. Simpkin R. Derivation of Lichtenecker’s Logarithmic Mixture Formula From Maxwell’s Equations. IEEE Transactions on
Microwave Theory and Techniques. 2010;58(3):545-550.
44. ChemGlobe. Germanium. Available from: <http://chemglobe. org/ptoe/_/32.php>. Access in: 27/05/2017.
45. Ur SC, Nash P, Kim IH. Mechanical alloying and thermoelectric properties of Zn4Sb3. Journal of Materials Science.