ISSN 0104-6632 Printed in Brazil
Brazilian Journal
of Chemical
Engineering
Vol. 21, No. 01, pp. 47 - 57, January - March 2004
ESTIMATION OF PARTICLE CONCENTRATION
PROFILES IN A THREE-PHASE FLUIDIZED
BED FROM EXPERIMENTAL DATA
AND USING THE WAKE MODEL
A. Knesebeck
1*and R. Guardani
21
Department of Chemical Engineering, Federal University of Paraná, Centro Politécnico, CEP 81.531-970, Curitiba - PR, Brazil. 2
Department of Chemical Engineering, University of São Paulo, Av. Luciano Gualberto 380, Tv. 3, CEP 05508-900, São Paulo - SP, Brazil.
(Received: April 15, 2003 ; Accepted: July 17, 2003)
Abstract - Particles with a size distribution in the range of 34 to 468 µm were fluidized in a three-phase bed
using low liquid and gas velocities. Particle size distribution and pressure profile measurements were carried out at different locations in the bed in order to study the influence of fluid velocities on segregation and dispersion of particles in different size classes. The influence of gas velocity on particle mixing was analyzed in terms of internal solid fluxes, calculated by means of the wake model. Based on the experimental results, different particle distribution patterns were identified. Although no significant tendencies were observed for radial profiles, particles of different sizes have significantly different axial profiles, which are mainly affected by the velocity of the liquid phase. Thus, depending on the liquid velocity, smaller particles reach a maximum concentration at different bed heights.
Keywords: three-phase fluidization, particle segregation, wake model.
INTRODUCTION
The application of three-phase fluidized beds to a number of industrial processes, such as the bioreactors to application of the treatment of liquid effluents, has attracted much attention. A number of studies on both kinetic and fluid dynamic aspects of these systems have been published (Tsuneda et al., 2002; Chen et al., 2002a, 2002b). Due to the complex mechanisms associated with the relative motion of the phases, the system is still not well understood, especially when particles with a wide size distribution are used.
Particle distribution throughout the bed is strongly affected by the flow of gas bubbles. The wakes associated with the bubbles, rising at velocities much higher than the liquid velocity, play
an important role in the upward transport of liquid and solids particles in the bed. This has been observed both visually (Tsuchiya et al., 1992) and by radioactive particle tracking (Larachi et al., 1995, 1996), showing that particles can be transported at high velocities in trajectories that are as long as bed height.
concentrations can assume either constant values up to a given height or a maximum concentration at some point in the bed. Using binary mixtures of silica and glass spheres, Matsumoto et al. (1997) observed that the concentration of glass spheres decreases with bed height, while the less dense silica particles show a maximum concentration at different bed heights.
In spite of the experimental results mentioned, there is no published work in the literature dealing with the influence of fluid velocity on particle distribution throughout the bed in terms of dispersion and segregation mechanisms. The aim of this work was to study the influence of liquid and gas velocities on the axial particle concentration profiles for different size classes of particles with a wide size distribution by means of a mathematical formulation based on the wake model.
MATHEMATICAL MODEL
The mathematical model adopted in this work is based on the wake model, in which the three-phase fluidized bed is divided into three regions: bubble, wake, and suspension (Tang and Fan, 1989; Murray and Fan, 1989; Tsutsumi et al., 1992). The bubble region consists of gas phase only, while the wake and suspension regions contain liquid and particles. The wakes associated with the bubbles rise at the same velocity as the bubbles. Mass transfer takes place at the wake-suspension interface. The wakes are continuously formed and detached from the bubble after traveling a given bed height, causing the transport of particles and liquid to higher portions of the bed. The particles that leave the volume under influence of the wake (by crossing the wake interface or after viscous dissipation of the detached wake) settle in the suspension back into the dense bed. The liquid mean velocity in the suspension is influenced by the liquid feed rate in the column and the liquid upward flux due to the wakes. From the solid mass balance in a cross section of the bed, as developed by Murray and Fan (1989), Eq. 1 holds:
g w pw p s ps
v ε Φ + ε Φ =v 0
w
(1)
where the first term is the volumetric particle flux per unit of column area, or mean particle superficial velocity,
p g w p
u = ε Φv (2)
In these equations, vg is the bubble rise velocity
(considered equal to the wake rise velocity), εw is the
holdup of wakes in the system, and Φpw the particle
holdup in the wakes. The ratios of wake to bubble sizes (k) and of particle holdup in the wake to that in the suspension (x) are expressed respectively as
w g k=ε
ε (3)
and
pw
ps
x=Φ
Φ (4)
With the relationship between interstitial and superficial liquid velocities,
g g
u = ε vg (5)
the particle superficial velocity becomes
p g p
u =u kxΦ s (6)
In order to obtain the particle concentration in the suspension, the total particle concentration in a cross section of the bed is expressed as the sum of the particles in the wakes and in the suspension,
p w pw s ps
ε = ε Φ + ε Φ (7)
with Eqs. (3) and (4) and the relationship
w s g 1
ε + ε + ε = (8)
the particle holdup in the suspension can be calculated as
(
p)
ps
g
1 1 k kx
ε Φ =
− ε + − (9)
Since there is no net flow of solids in the system, the superficial velocity of the particles transported by the wakes, calculated by Eq. (6), is equal to the sedimentation superficial velocity. From a mass balance (analogous to Eq. 1) applied to particles in class i, the superficial velocity of the class is
pi g i pis
u =u kxΦ (10)
obtained from relationships proposed for the intermediate regime (Bird et al., 1960). Although Eq. (12) was originally obtained from monocomponent systems, it is assumed that the relationship holds for
xi in multicomponent systems. In order to obtain the
mean value of x to be used in Eq. (6), Eq. (10) is applied to each particle class and x is expressed as beds (e.g., Khang et al., 1983; Chern et al., 1984;
Murray and Fan, 1989); the correlation by Murray and Fan (1989) was adopted in this work, since it is widely accepted. Eq. (11) expresses the correlation in terms of k:
(
)
3p g
0.037
k 0.61 1
0.013
= + − ε
ε +
(11) NC
i pis i 1
x x
=
=
∑
Φ (15)In the same way, the solid holdup in the wakes of bubbles can be estimated according to different correlations (e.g., El-Temtamy and Epstein, 1978; Kreischer et al., 1990; Tsutsumi et al., 1992). In this work the correlation of El-Temtamy and Epstein (1978) was adopted:
EXPERIMENTAL
The experiments were carried out in a Plexiglas column 0.06 m in internal diameter and 2.98 m in height, as illustrated in Figure 1. The distributor was a perforated metallic plate with 20 equally spaced holes, each with a 1 mm internal diameter. The liquid (filtered water) was kept at a constant
temperature of 16±2_oC by means of a thermostatic
bath connected to the reservoir and flows through a set of three parallel rotameters before entering the mixing chamber. The gas (filtered, compressed air at 20_oC) was kept at a constant pressure of 1.3 bar and its flow rate was measured by a calibrated capillary tube coupled to a differential pressure transducer. The liquid stream was fed vertically through a conical chamber under the distributor. The gas stream was fed laterally into the same chamber by means of two inlet tubes opposite each other. The solid particles were obtained by grinding and sieving porous alumina catalyst pellets with a density of 1.81
g/cm3, as determined in water. The particle size
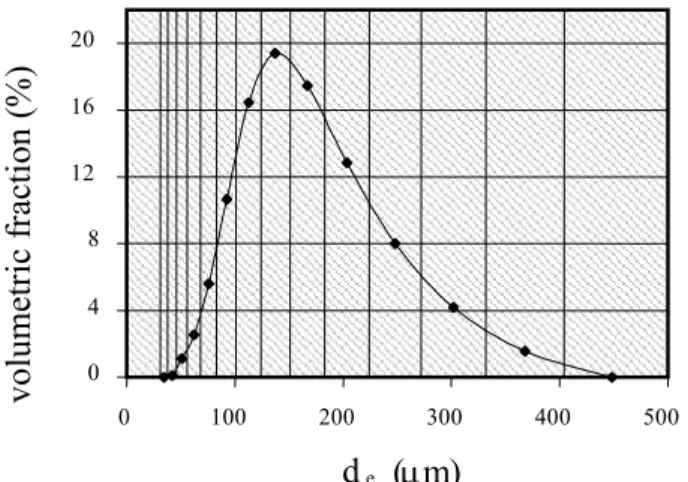
distribution is shown in Figure 2. ti
i
g l
g l u
x 1 0.877
u u
= −
+
ε ε
(12)
The particle terminal velocity of particles in class i, uti, is estimated as
(
)
2p l e ti
l gd u
18 ρ − ρ =
µ Ret < 2 (13)
(
)
58 5 7
e p l ti 2 5 3 5
l l
d g
u
13.875
ρ − ρ
=
ρ µ
2 < Ret < 500 (14)
Eq. (13) represents the free-falling velocity of a single particle in the Stokes regime, while Eq. (14) is
cooling water
liquid reservoir
liquid rotameters
fluidized bed
gas exit
liquid exit
air
gas capillary
filter pump
to drain
FI
1 9 8 7 6 5 4 3 2
sample points
0 4 8 12 16 20
0 100 200 300 400 500
de (µm)
vol
umetr
ic f
racti
on
(%
)
Figure 2: Size distribution of the particles used in the study.
The bed is equipped with nine ports distributed along its height, which can be used either for pressure measurements or for taking samples from the suspension. For measurement of pressure drop along the bed, metallic sieves were adapted to each port in order to prevent solid particles from flowing through the hydrostatic columns. For the sampling procedure the sieves were removed, and the ports were locked with silicone rubber. Samples were collected by means of a 20 mL syringe with a 70 mm long, 1.0.mm internal diameter needle. In order to minimize disturbances in the bed, the samples were taken from the upper to the lower port. Sampling was started after at least 2 hours of operation of the system under each desired condition in order to guarantee steady state.
then the particle holdup above hi is
(
)
(
)
(
)
(
)
T i l g l g
p
T i p l
P g h h
g h h
− − ρ − ε ρ − ρ
ε =
− ρ − ρ (18)
The total particle mass above hi is
(
)
p p p T
M = ε ρ A h −h (19)
The total mass of particles between two sampling points was obtained from the difference of the masses calculated by applying Eq. (19) to hi-1 and hi. The particle mass concentration was obtained by dividing the mass by the column volume between both points as follows:
Volume-based particle size distribution of the samples was measured with a laser diffractometer (Malvern Mastersizer X), operating in the range of 1 to 600 µm. The particles were divided into 14 classes, corresponding to the vertical lines in Figure 2.
(
)
(
)
(
)
p,i 1 p T i 1 p,i p T i
i i 1
h h h h
c
h h
− −
−
ε ρ − − ε ρ −
=
− (20)
In order to obtain the mean particle holdup between two points, the particle concentration was divided by the particle density. Once the values of εp and εg were calculated, then the mean liquid holdup can be obtained from Eq. (17). The concentration profiles for each particle class can be obtained by combining the volumetric particle concentration with the particle size distribution at each sampling height and performing the calculation for the whole bed height.
The volume fraction of gas in the bed was determined by the sudden interruption of the gas and liquid flows by means of ball valves and measuring the volume above the liquid static bed after removal of gas bubbles from the bed. The gas was assumed to be uniformly distributed throughout the bed. The total solids holdup was determined from the pressure drop, which varies with bed height according to Fan (1989)
The total particle mass was kept at 1230 g. Three
values of liquid velocity were adopted: 0.177×10⁻³,
0.443×10⁻³, and 0.887×10⁻³ m/s, corresponding to 2, 5 and 10 times the minimum fluidization velocity of the liquid-solid system. Three values of gas velocity were adopted: 0.687×10⁻³, 1.388×10⁻³, and 2.370×10⁻³ m/s. Within the range of liquid and gas velocities adopted in this study no effect of the liquid velocity on the gas volume fraction was observed.
(
p p l l g gdP
g dz
− = ε ρ + ε ρ + ε ρ
)
(16)Equation (16) can be integrated from the top of the bed to yield the pressure at each height. Since the sum of the phase holdup fractions is equal to one,
l p g 1
Corresponding to each value of the gas velocity the measured values of gas holdup in the bed were 0.0021, 0.0043, and 0.0072.
Preliminary experiments carried out for the mean values of the gas and liquid velocities resulted in a mean error of 3.1% for the particle mass calculated from the pressure profiles, with a standard deviation of 1.76. The errors associated with each particle class (obtained from comparison of the mass calculated from the pressure profiles and size distribution with that loaded into the column) did not show any relationship with particle diameter, indicating that no segregation of particles occurred as a result of the sampling procedure adopted.
RESULTS AND DISCUSSION
Total Concentration Profiles
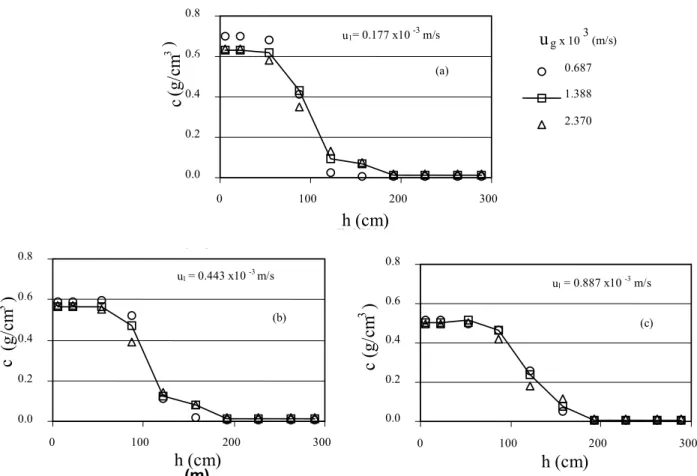
Total particle concentration profiles for the bed, as calculated from the pressure profiles, are shown in Figure 3. As reported by Matsumoto et al. (1991), the two regions of the fluidized bed are clearly divided. In the dense bed, located in the lower part of the column, the total particle concentration is
approximately constant. In this part of the bed the total particle concentration is not very sensitive to gas velocity, but varies significantly with liquid velocity as the bed expands. In the lean, upper part of the bed, the total particle concentration decreases gradually with bed height and the profiles are dependent on gas velocity, denoting the importance of particle carryover by the wakes.
Concentration Profiles for Particles of Different Size Classes
The concentration profile for each particle class arises from the equilibrium of segregation and dispersion mechanisms. The downward velocity of particles in suspension is dependent on particle diameter, leading to a segregation effect that depends on liquid velocity and total particle concentration. The upward flux of particles is caused by wake transport, which also affects the liquid velocity in the bed, with both mechanisms leading to a dispersion effect. In general small particles tend to concentrate above the dense bed and particles with progressively larger diameters in the dense bed. From the axial concentration profiles for particles in different size classes, different patterns have been identified.
0.0 0.2 0.4 0.6 0.8
0 100 200 300
h (m)
c
(g
/c
m
3 3
)
0.687 1.388 2.370
u
gx 103(m/s)
u1= 0.177 x10
-3 m/s-3
(a)
h (cm)
( )
0.0 0.2 0.4 0.6 0.8
0 100 200 300
h c c (g
/c
m
3
)
3
ul= 0.443 x10⁻³m/s
(b)
h (cm)
h (m)
0.0 0.2 0.4 0.6 0.8
0 100 200 300
h (cm)
c (g/c
m
3
)
ul = 0.887 x10⁻³m/s
(c)
(m)
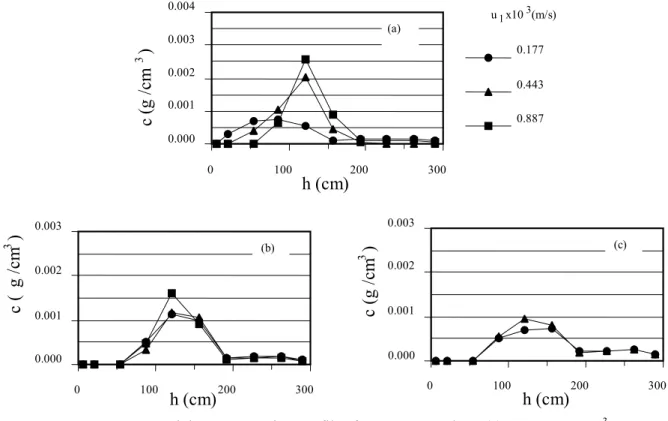
Figure 4 shows concentration profiles for particles in the 37-46 µm size class. These smaller particles are not present at the bottom of the bed and their concentration profiles reach a maximum value at a height that depends on fluidization conditions. As can be seen from the profiles in Figure 3, all maximum concentrations are located in the lean phase of the bed. The concentration profiles for these particles tend to be less dispersed axially as the velocity of the liquid increases.
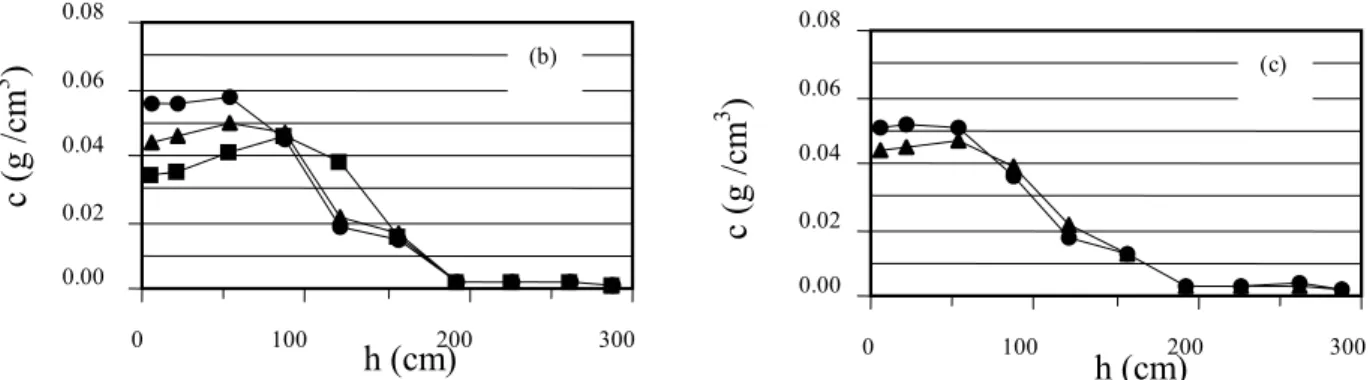
Particles of intermediate size (83-101 µm) are present at the bottom of the bed (Figure 5), but in a concentration that is lower than the maximum value. As a result, their concentration increases from the bottom of the bed up to a maximum value and decreases in the lean bed. The fluid velocities affect the concentration at the bottom, the location of the
maximum point, and the concentration profiles. The increase in liquid velocity makes the profiles steeper, while the increase in gas velocity causes axial dispersion of particles.
As shown in Figure 6, particles in the 123-150 µm size class have a nearly constant concentration in the dense bed, followed by a decrease in the lean bed. For these particles the axial concentration profiles are less dependent on the velocities of the fluids.
Particles in the 272-331 µm size class, which are the largest ones in this study, have monotonically decreasing concentration profiles, as shown in Figure 7. For low gas and high liquid velocities, these particles tend to concentrate at the bottom of the bed, while under the same fluidization conditions smaller particles tend to concentrate at the top (Figure 4).
0.000
0.001
0.
002
0.003
0.004
0
100 200 300
0.177
0.443
0.887
ul x10
3 (m/s)
(a)
c
(
g /cm
3
)
h (cm)
d
e
(
µ
m)
0.000
0.001
0.002
0.003
0
100 200 300
(b)
c
(
g /cm
3
)
h (cm)
0.000 0.001 0.002 0.003
0 100 200
300
h (cm)
c (g
/
cm
3
)
(c)
Figure 4: Particle concentration profiles for 37-46 µm class. (a) ug = 0.687×10⁻³; (b) ug = 1.338×10⁻³; (c) ug = 2.370×10⁻³ m/s.
0.00 0.02 0.04 0.06 0.08
0 100 200 300
0.177
0.443
0.887 ul x 103 (m/s)
(a)
h (cm)
c
(g
/m
d
e(
µ
m)
0.00 0.02 0.04 0.06 0.08
0 100 200 300
c (
g
/
cm
3 )
(b)
h (cm)
d
e(
µ
m)
0.00 0.02 0.04 0.06 0.08
0 100 200 300
h (cm)
c (
g
/
cm
3 )
(c)
d
(
)
Figure 5: Particle concentration profiles for 83-101 µm class. (a) ug = 0.687×10⁻³; (b) ug = 1.338×10⁻³; (c) ug = 2.370×10⁻³ m/s.
0.00 0.04 0.08 0.12 0.16
0 100 200 300
0.177
0.443
0.887
ul x 10 3(m/s)
(a)
c
(g
/c
m
3 )
h (cm)
d
e(
µ
m)
0.00 0.04 0.08 0.12 0.16
0 100 200 300
u
(b)c
(g
/c
m
3 )
h (cm)
d
e(
µ
m)
0.00 0.04 0.08 0.12 0.16
0 100 200 300
h (cm)
(c)
c
(g
/c
m
3 )
d
(
)
Figure 6: Particle concentration profiles for 123-150 µm class. (a) ug = 0.687×10⁻³; (b) ug = 1.338×10⁻³; (c) ug = 2.370×10⁻³ m/s.
0.00 0.01 0.02 0.03 0.04
0 100 200 300
0.177
0.443
0.887 ul x 103 (m/s)
(a)
c (
g
/cm
3
)
d
e
(
µ
m)
0.00 0.04
0 100 200 300 (b)
c (
g
/cm
3
)
h
(cm)0.01 0.02 0.03
d
e
(
µ
m)
0.00 0.04
0 100 200 300
h
(cm)(c)
c (
g
/cm
3
)
0.030.02
0.01
d
(
)
Figure 7: Particle concentration profiles for 272-331 µm class. (a) ug = 0.687×10⁻³; (b) ug = 1.338×10⁻³; (c) ug = 2.370×10⁻³ m/s.
Estimation of Particle Superficial Velocity
The curves in Figures 4 to 7 indicate that the increase in gas velocity causes an increase in particle dispersion throughout the bed, resulting in less steep concentration profiles. This can be explained by the increase in particle flux, caused by the flow of gas bubbles that transport particles in their wakes. In order to test this assumption, the equations that describe the wake model (Eqs. 6, 9, 11, and 15) were applied to the experimental points in order to estimate particle velocity for three experimental conditions. The results are shown in Figure 8. In the dense bed, particle velocity (Figure 8a) is barely affected by liquid velocity, but the increase in gas velocity leads to a significant increase in particle velocity, although total particle holdup remains almost constant (Figure 8b). In contrast, total particle holdup is mostly affected by liquid velocity, i.e., for a given liquid velocity an increase in gas velocity does not significantly affect particle holdup. This results in an increase in internal particle flux, since under the steady-state regime superficial particle velocity in the upward direction must be the same as that in the downward direction. This results in the
higher dispersion in the concentration profiles shown in Figures 4 to 7.
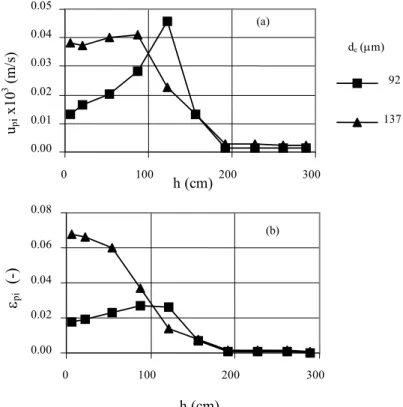
In the wake model, the k parameter is related to size of wake, which is lower in concentrated systems but increases as the concentration becomes lower in the lean bed, according to Eq. 11. As a consequence, in the lean bed there is a tendency to increase particle carryover by increasing wake size. However, solid flux tends to be lower, since in the lean phase the wakes are less concentrated. As a result, the point of maximum particle velocity is located in a somewhat higher axial position than the point of maximum concentration. This can be observed in Figure 8 for total particle velocity and with better resolution in Figure 9, which shows particle velocity and
concentration profiles for two size classes: 92 µm (ul
= 0.887×10⁻³, u
g = 0.687×10⁻³) and 137 µm (ul =
0.177×10⁻³
, ug = 2.370×10⁻³ m/s). Particles in the 92 µm size class reach a maximum for both concentration and velocity profiles. However, particles in the 137 µm size class have a decreasing concentration profile, but a point of maximum velocity. Thus, in the higher positions in the column, although the wakes reach larger sizes, the particle flux can be lower due to the lower particle concentration.
0.0 0.2 0.4 0.6 0.8
0 100 200 300
x
10
/
)
ul
u
(m/s x103)
0.887 2.370 0.177 0.687 0.887 0.687
(a) ui ug
(m/s x103)
up
x1
0
3 (
m/
s)
0.0 0.1 0.2 0.3 0.4 0.5
0 100 200 300
h(cm)
εp
(-)
(b)
Figure 8: Axial profiles for calculated particle superficial velocity and experimental solid holdup under three operating conditions.
0.00 0.01 0.02 0.03 0.04 0.05
0 100 200 300
upi
x10
3 (m
/s
)
92
137 (a)
de (µm)
0.00 0.02 0.04 0.06 0.08
0 100 200 300
h (cm)
εpi
(-)
(b)
h (cm)
Figure 9: Axial profiles for calculated particle superficial velocity and experimental solid holdup for two particle classes.
CONCLUSIONS
The three-phase fluidized bed is divided into two parts: a dense lower bed with an approximately constant total particle concentration and a lean upper bed with a decreasing concentration, resulting from particle carryover by the bubble wakes. For the particles chosen for this study, a tendency to segregate the solid throughout the bed was observed. This tendency is increased by liquid velocity, while gas velocity has the opposite effect, leading to a more dispersed system. From the equilibrium of dispersion and segregation, different patterns have
been identified for the profile for concentration of particles throughout the bed. Thus, smaller particles can be totally segregated at the top of the bed, while larger particles accumulate at the bottom or reach a maximum concentration at different bed heights, with different degrees of dispersion.
Chen, A., Grace, J.R., Epstein, N. and Lim, C.J., Steady State Dispersion of Mono-size, Binary and Multi-size Particles in a Liquid Fluidized Bed Classifier. Chemical Engineering Science, 57(6), 991-1002 (2002a).
particle superficial velocities. Thus, the results of the wake model can explain the large influence of liquid velocity on particle segregation and that of gas velocity on particle dispersion.
Chen, A., Grace, J.R., Epstein, N. and Lim, C.J., Unsteady State Hydrodynamics Model and Dynamic Behavior of a Liquid Fluidized Bed Classifier. Chemical Engineering Science, 57(6), 1003-1010 (2002b).
NOMENCLATURE
A column cross section area, m2
c particle concentration, kg/m3
Chern, S.-H., Fan, L.-S. and Muroyama, K., Hydrodynamics of Concurrent Gas-Liquid-Solid Semifluidization with a Liquid as the Continuous Phase. AIChE Journal, 30(2), 288-294 (1984).
de particle diameter, m
g acceleration due to gravity, m/s2
h sample point height, m
k ratio of wake volume to bubble volume,
dimensionless El-Temtamy, S.A. and Epstein, N., Bubble Wake Solids Content in Three-phase Fluidized Beds.
Int. J. Multiphase Flow, 4, 19 (1978). Mp particle mass, kg
P pressure, Pa Fan, L.-S., Gas-Liquid-Solid Fluidization
Engineering. Butterworth´s Series in Chemical Engineering, Butterworth Publishers, U.S.A (1989).
Ret terminal particle Reynolds number
(=ρl.ut.de/µl), dimensionless
u superficial velocity, m/s
Hughmark, G.A., Holdup and Mass Transfer in Bubble Columns. Ind. Eng. Chem. – Proc. Des. Dev., 6, 218 (1967).
v interstitial velocity (related to the column
wall), m/s
x ratio of wake concentration to suspension
concentration, dimensionless Khang, S.J., Schwartz, J.G. and Buttke, R.D., A
Practical Wake Model for Estimating Bed Expansion and Holdup in Three-phase Fluidized Systems. AIChE Symposium Series, 79(222), 47-54 (1983).
z axial column axis, m
Greek Symbols
Koide, K., Takazawa, A. and Komura, M., Gas Holdup and Volumetric Liquid-phase Mass Transfer Coefficient in Solid-suspended Bubble Columns. Journal of Chemical Engineering of Japan, 17, 459 (1984).
ε holdup in the fluidized bed, dimensionless
Φ holdup in wake or suspension phases,
dimensionless µl liquid viscosity, Pa.s
Kreischer, B.E., Moritomi, H. and Fan, L.-S., Wake Solids Holdup Characteristics Behind a Single Bubble in a Three-dimensional Liquid-Solid Fluidized Bed. Int. J. Multiphase Flow, 16(2), 187-200 (1990).
ρ density, kg/m3
Subscripts
g gas
Larachi, F., Cassanello, M., Marie, M., Chaouki, J. and Guy, C., Solids Circulation Patterns in Three-phase Fluidized Beds Containing Binary Mixtures of Particles as Inferred from RPT. Trans IChemE, 73(A), 263-268 (1995).
i particle class; sampling point
l liquid p particle s suspension
Larachi, F., Cassanello, M., Chaouki, J. and Guy, C., Flow Structure of the Solids in a 3-d Gas-Liquid-Solid Fluidized Bed. AIChE Journal, 42(9), 2439-2452 (1996).
t terminal
T total column height w wake
Matsumoto, T., Hidaka, N., Takenouchi, H. and Morooka, S., Segregation of Solid Particles of Two Sizes in Bubble Columns. Powder Technology, 68, 131-136 (1991).
REFERENCES
Bird, R.B., Stewart, W.E. and Lightfoot, E.N., Transport Phenomena. Wiley International Edition, John Wiley and Sons (1960).
Particles Suspended in Bubble Columns. Ind. Eng. Chem. Res., 31(6), 1562-1568 (1992). Matsumoto, T., Hidaka, N., Takebayasi, Y. and
Morooka, S., Axial Mixing and Segregation in a Gas-Liquid-Solid Three-phase Fluidized Bed of Solid Particles of Different Sizes and Densities. Chemical Engineering Science, 52(21/22), 3961-3970 (1997).
Murray, P. and Fan, L.-S., Axial Solid Distribution in Slurry Bubble Columns. Ind. Eng. Chem. Res., 28(11), 1697-1703 (1989).
Smith, D.N., Ruether, J.A., Shah, Y.T. and Badgujar, M.N., Modified Sedimentation-Dispersion Model for Solids in a Three-phase Slurry Column. AIChE Journal, 32(3), 426-436 (1986).
Tang, W.-T. and Fan, L.-S., Hydrodynamics of a Three-phase Fluidized Bed Containing
Low-density Particles. AIChE Journal, 35(3), 355-364 (1989).
Tsuchiya, K., Song, G.-H., Tang, W.-T. and Fan, L.-S., Particle Drift Induced by a Bubble in a Liquid-Solid Fluidized Bed with Low-density Particles. AIChE Journal, 38(11), 1847-1851 (1992).
Tsuneda, S., Auresenia, J., Inoue, Y., Hashimoto, Y. and Hirata, A., Kinetic Model for Dynamic Response of Three-phase Fluidized Bed Biofilm Reactor for Wastewater Treatment. Biochemical Engineering Journal, 10(1), 31-37 (2002).