ISSN 0104-6632 Printed in Brazil www.abeq.org.br/bjche
Vol. 27, No. 04, pp. 583 - 589, October - December, 2010
Brazilian Journal
of Chemical
Engineering
DEVELOPMENT AND CHARACTERIZATION OF
HIGHLY ORIENTED PAN NANOFIBER
M. Sadrjahani
1, S. A. Hoseini
1, V. Mottaghitalab
2and A. K. Haghi
2*1
Textile Engineering Faculty, Isfahan University of Technology, PO Box 84156, Isfahan, Iran. 2
Textile Engineering Department, Faculty of Engineering, Phone: +98-131-6690270, Fax: +98-131-6690271, PO Box 3756, University of Guilan, Rasht, Iran.
E-mail: [email protected]
(Submitted: June 26, 2009 ; Revised: March 13, 2010 ; Accepted: April 23, 2010)
Abstract - A simple and non-conventional electrospinning technique was employed for producing highly
oriented Polyacrylonitrile (PAN) nanofibers. The PAN nanofibers were electrospun from 14 wt% solution of PAN in dimethylformamid (DMF) at 11 kv on a rotating drum with various linear speeds from 22.5 m/min to 67.7 m/min. The influence of take up velocity was investigated on the degree of alignment, internal structure and mechanical properties of collected PAN nanofibers. Using an image processing technique, the best degree of alignment was obtained for those nanofibers collected at a take up velocity of 59.5 m/min. Moreover, Raman spectroscopy was used for measuring molecular orientation of PAN nanofibers. Similarly, a maximum chain orientation parameter of 0.25 was determined for nanofibers collected at a take up velocity of 59.5 m/min.
Keywords: Polyacrylonitrile; Nanofiber; Orientation; Eletrospinning.
INTRODUCTION
With potential applications ranging from protective clothing, tissue engineering and filtration technology to reinforcement of composite nanomaterials, nanofibers offer a remarkable opportunity toward development of multifunctional nanostructural systems (Huang et al., 2003; Ramakrishna et al., 2005; Fennessey et al., 2004; Pan, 2006). The emergence of various applications is inspired by outstanding properties of nanofibers such as huge surface area per mass ratio (Huang et al., 2003) and high porosity along with small pore size (Ramakrishna et al., 2005). Moreover, for diverse applications, highly oriented and flexible nanofiber with superior mechanical properties is extremely demanded. The electrospinning process is a sophisticated technique for producing nanofibers based on applying a high voltage DC electric potential between the end of a capillary tube and a collector. When the applied electric field overcomes the surface tension of the droplet, a charged jet of
demonstrated the use of a wheel-like bobbin as the collector to position and align individual PAN nanofibers into parallel arrays with an orientation factor of 0.34 at a collection speed of 5 m/s. In another study, aligned PAN nanofibers collected across the gap between the two grounded strips of aluminum foil showed an obvious improvement of mechanical properties in the modulus of the resultant carbon nanofibers, as a consequence of an increase in the orientation factor from 0 to 0.127 (Gu et al., 2005).
The current study focuses on preparation of aligned and molecularly oriented PAN nanofibers using two needle pumps in a highly productive approach. Various take up velocities were examined to obtain the highest possible collection speed capable of producing aligned nanofiber. Non-destructive techniques like angular power spectra (APS) and Raman spectroscopy were utilized for characterization of alignment and molecular orientation in nanofibers.
EXPERIMENTAL
Material and Reagents
Industrial polyacrylonitrile (PAN) with average molecular weight of 100000 g/mol and highly pure dimethylformamide (DMF, 99%) were supplied respectively by Iran Polyacryle and Merck companies. All PAN/DMF solutions were prepared using constant power magnetic stirrer at room temperature.
Electrospinning Setup
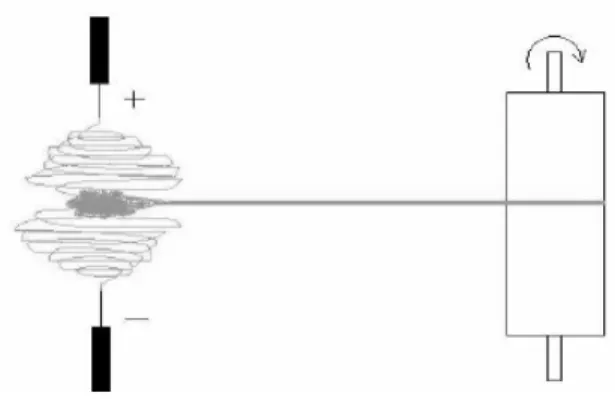
The electrospinning apparatus consists of a high voltage power supply; two syringe pumps, two stainless steel needles (0.7 mm OD) and a rotating collector equipped to an inverter for controlling linear speed (Fig 1). In this setup, unlike the conventional technique, two needles were installed in opposite directions and polymer solutions were pumped to needles by two syringe infusion pumps with same injection rate. The flow rate of solutions to the needle tip is maintained constant so that a pendant drop remains during electrospinning. The horizontal distance between the needles and the collector was 20-25 cm. When high voltages (9-11 KV) were applied to the needles with opposite voltage, jets were ejected simultaneously. Then the jets with opposite charges attracted each other, stuck together and a cluster of fibers is formed. For collecting aligned nanofibers, the cluster of fibers
formed between the two needles was towed manually to a rotating drum.
Figure 1: Schematic of electrospinning setup for
collection of continuous aligned nanofiber
Characterization Techniques
Development and Characterization of Highly Oriented PAN Nanofiber 585 RESULTS AND DISCUSSION
Well-aligned PAN nanofibers with very long lengths were electrospun using a simple and unconventional method. In this technique, the electric field only exists between two syringe needles (not between needle ad collector) and, thus, the movement of nanofibers in the drawing area (distance between the needles and the collector) is due to mechanical force caused by the rotating drum and electric field and therefore has no impact on the drawing mechanism. Various operational and material parameters were adjusted in order to obtain optimum and productive conditions. PAN nanofibers prepared at 14 and 15 wt% have lower rupture compared to 13 wt% polymer solution, presumably due to a higher level of chain entanglement. The conditions pertinent to minimum number of rupture for nanofibers prepared at different concentrations are shown in Table 1.
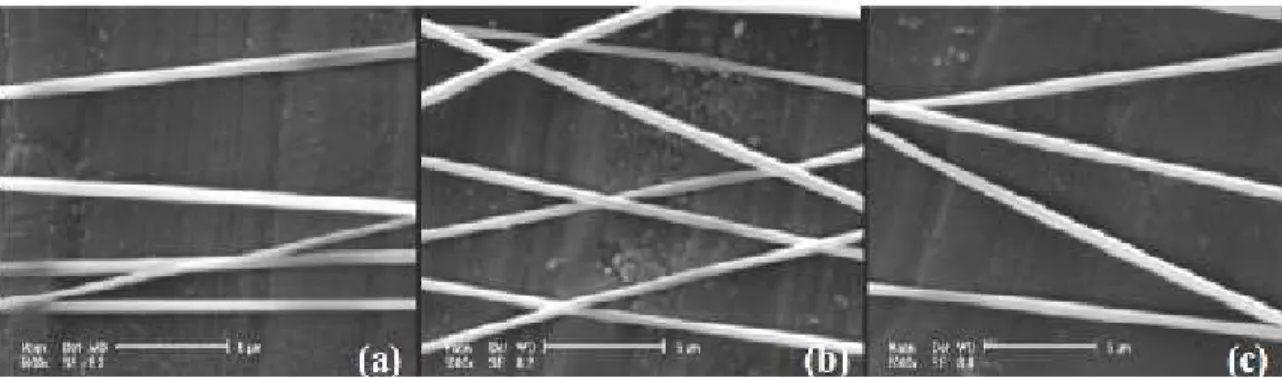
Fig 2 shows SEM images of PAN nanofibers electrospun in optimum conditions. The generated nanofibers have uniform structure without any bead formation. The average diameter of nanofibers increases with increasing polymer concentration because of lower extension of the jet at higher concentration and viscosity. Based on SEM images, the average diameter of nanofibers produced from 13 wt% polymer solutions is about 323 ± 31 nm, which is about 100 nm less than the diameter of those fibers collected from 15 wt% polymer solution (Ziabari et al., 2009). This is probably due to the greater
stretching resistance of the solution with increasing solid content (Ramakrishna et al., 2005). However the 14 wt% concentration was chosen for producing of PAN nanofibers due to a lower number of rupture and higher diameter uniformity.
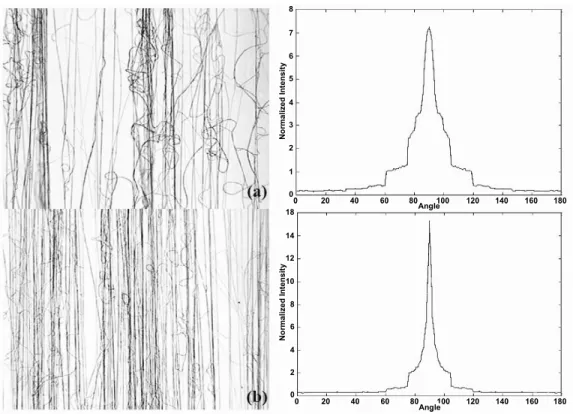
Alignment analysis of nanofibers collected at different take up speeds from 22.5 m/min to 67.7 m/min was carried out using the angular power spectrum (APS) based on micrographs captured by an optical microscope. Acquired image was processed using MATLAB software to produce angular power spectrum as the square of the Fourier power spectrum. APS is a plot of how much the orientation varies from point to point on the web of nanofibers versus the angular frequency (the x-axis variable). The sharpness of the peak at an angle of 90° on the APS shows the degree of alignment of nanofibers in the vertical direction and the area of that peak shows the density of aligned nanofibers (Jalili et al., 2006). Furthermore, the plot of the normalized APS (ratio of intensity of the APS to the corresponding mean intensity of the Fourier power spectrum) versus angle was used for calculating the degree of alignment (Fig 3). Disorientation of nanofibers generates a broad spectrums around 90°, which reflects directly a low degree of alignment. The ratio of peak area at 90o±3 o to total area of the APS plot was utilized to calculate the density of aligned nanofibers. Table 2 shows the influence of the linear take up speed of the rotating collector on the degree of alignment of the nanofibers.
Table 1: Various conditions used for nanofiber preparation
Solution concentration (wt%)
Applied voltage (kv)
Feed rate (mL/h)
Distance between two needles
(cm)
Distance between needles and collector
(cm)
Total number of rupture at (15 minutes)1 13
10.5 0.293 13 20 12
14
11 0.293 13 20 6
15
11 0.293 15 20 6
1
It was measured visually by counting the number of rupture of fiber flow between electrospinning needles and rotating collector.
0 20 40 60 80 100 120 140 160 180 Angle
0 2 4 6 8 10 12 14 18
N
o
rm
a
li
ze
d
In
te
n
s
it
y
0 1 2 3 4 5 6 7 8
N
o
rm
a
li
z
e
d
In
te
n
s
it
y
Angle
0 20 40 60 80 100 120 140 160 180
0 20 40 60 80 100 120 140 160 180 Angle
0 20 40 60 80 100 120 140 160 180 Angle
0 2 4 6 8 10 12 14 18
0 2 4 6 8 10 12 14 18
N
o
rm
a
li
ze
d
In
te
n
s
it
y
0 1 2 3 4 5 6 7 8
0 1 2 3 4 5 6 7 8
N
o
rm
a
li
z
e
d
In
te
n
s
it
y
Angle
0 20 40 60 80 100 120 140 160 180
0 20 40 60 80 100 120 140 160 180
Figure 3: Optical micrograph of electrospun PAN nanofibers with the corresponding
normalized APS at take up speeds of (a) 22.5 m/min (b) 59.5 m/min
Table 2: The degree of alignment at different take-up speeds
Take up speed 22.5 31.6 40.6 49.6 59.5 67.7 Degree of alignment 24.6±3.9 34.4±5.2 32.7±7.65 29.5±5.97 37.5±5.2 29.4±7.1
The higher the take up speed, the more aligned is the nanofiber collected. As the rotation speed increases, the effective draw (difference between the surface velocity of the drum and the final velocity of the fiber) is increased, resulting in better alignment of the collected fiber and less deviation between the fiber and rotation direction. However, the positive impact of linear take up velocity on degree of alignment passes through a maximum of 37.5% at 59.5 m/min and the trend of the data reverses after this collection speed. The decrease of the degree of alignment after a specific take up speed presumably is due to insufficient time for arrangement of the molecular chains in the drawing mechanism. The drawing mechanism inherently uncoils the molecular chain to reach higher orientation, but after an optimum take up speed the breaking force acting on the molecular chain starts to build up. At the early stage, the decrease of nanofiber alignment can be observed due to partial segregation of the polymer chains and reforming of the coiled structure. Meanwhile, if the take up speed increase is continued, complete fracture occurs in the nanofiber
Development and Characterization of Highly Oriented PAN Nanofiber 587 1400 1200 1000 800 600 400 5000 4000 3000 2000 1000 6000 1400 1200 1000 800 600
400 600 800 1000 1200 1400 400 5000 4000 3000 2000 1000 6000 5000 4000 3000 2000 1000 6000
Wave number(cm-1)
In te n s it y (a .u .) 1400 1200 1000 800 600 400 5000 4000 3000 2000 1000 6000 1400 1200 1000 800 600
400 600 800 1000 1200 1400 400 5000 4000 3000 2000 1000 6000 5000 4000 3000 2000 1000 6000
Wave number(cm-1)
In te n s it y (a .u .) 6000 5000 4000 3000 2000 1000 1400 1200 1000 800 600 400 6000 5000 4000 3000 2000 1000 6000 5000 4000 3000 2000 1000 1400 1200 1000 800 600
400 600 800 1000 1200 1400 400
Wave number(cm-1)
In te n s it y (a .u .) 6000 5000 4000 3000 2000 1000 1400 1200 1000 800 600 400 6000 5000 4000 3000 2000 1000 6000 5000 4000 3000 2000 1000 1400 1200 1000 800 600
400 600 800 1000 1200 1400 400
Wave number(cm-1)
In te n s it y (a .u .)
Wave number(cm-1)
In te n s it y (a .u .) (a) (b) 1400 1200 1000 800 600 400 6250 5000 3750 1500 1250 1400 1200 1000 800 600
400 600 800 1000 1200 1400 400 6250 5000 3750 1500 1250 6250 5000 3750 1500 1250
Wave number(cm-1)
In te n s it y (a .u .) 1400 1200 1000 800 600 400 6250 5000 3750 1500 1250 1400 1200 1000 800 600
400 600 800 1000 1200 1400 400 6250 5000 3750 1500 1250 6250 5000 3750 1500 1250
Wave number(cm-1)
In te n s it y (a .u .) 1400 1200 1000 800 600 400 1600 6250 5000 3750 1500 1250 1400 1200 1000 800 600
400 600 800 1000 1200 1400 1600
400 1600 6250 5000 3750 1500 1250 6250 5000 3750 1500 1250
Wave number(cm-1)
In te n s it y (a .u .) 1400 1200 1000 800 600 400 1600 6250 5000 3750 1500 1250 1400 1200 1000 800 600
400 600 800 1000 1200 1400 1600
400 1600 6250 5000 3750 1500 1250 6250 5000 3750 1500 1250
Wave number(cm-1)
In te n s it y (a .u .) (c) (d)
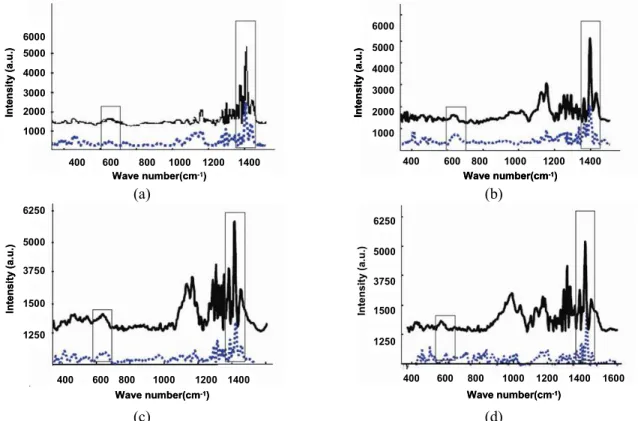
Figure 4: The Raman spectra under the VV mode: (a) 22.5 m/min; (b) 49.6 m/min; (c) 59.5 m/min;
(d) 67.7m/min. The angle between the fiber axis and the polarization plane for filled curve and dashed curve are 0° and 90°, respectively.
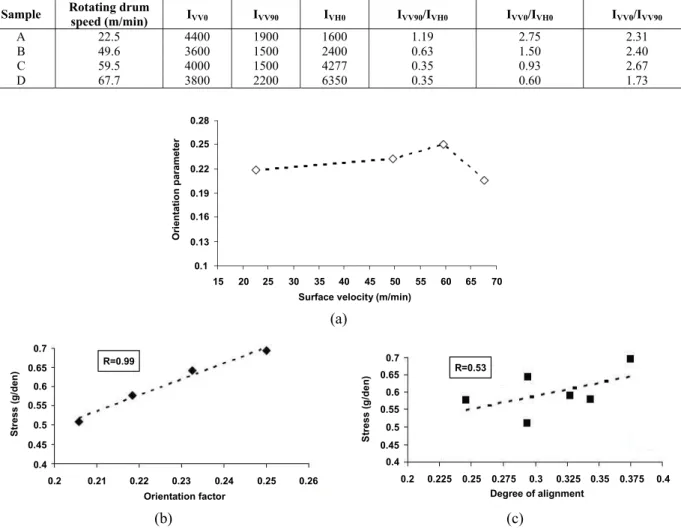
Similar to the VV configuration, the peak intensity observed for different samples in the VH configuration at ψ=0 characterized the degree of molecular orientation. According to the intensity ratios shown in Table 3, Raman spectra show a much stronger orientation effect in sample (C) compared to other spun nanofibers. It is clear that the higher take up speed is mostly responsible for the orientation of the molecular chains in the fiber direction. Therefore, as expected, a low orientation dependence of the Raman modes was observed for the lower take up speed. The orientation parameters of <P2 (cosθ)> and <P4 (cosθ)>, which are, respectively, the average values of the Legendre polynomials P2 (cosθ) and P4 (cosθ) for the bulk product, can be calculated based on the Raman intensity ratios in VV and VH modes given in Table 3 (Liu and Kumar 2003).
More specifically, <P2(cosθ)> is known as the Herman orientation factor (f), which varies between values of 1 and 0, corresponding, respectively, to a nanofiber fully oriented in the take up direction and a fully non-oriented nanofiber distribution. The Herman orientation factor for different samples varies between 0.20 and 0.18 when the take up speed increases from 22.5 m/min to 67.7 m/min (Fig 5-a).
It can be clearly seen that the degree of orientation reaches a maximum point at 59.5 m/min
Table 3: The intensity ratios of the enhanced peak at 1394 cm-1using VV and VH configuration
Sample Rotating drum
speed (m/min) IVV0 IVV90 IVH0 IVV90/IVH0 IVV0/IVH0 IVV0/IVV90
A 22.5 4400 1900 1600 1.19 2.75 2.31 B
49.6 3600 1500 2400 0.63 1.50 2.40 C
59.5 4000 1500 4277 0.35 0.93 2.67 D
67.7 3800 2200 6350 0.35 0.60 1.73
Surface velocity (m/min)
70 65 60 55 50 45 40 35 30 25 20 15 0.28 0.25 0.22 0.19 0.16 0.13 0.1 O ri e n ta ti o n p a ra m e te r
Surface velocity (m/min)
70 65 60 55 50 45 40 35 30 25 20
15 20 25 30 35 40 45 50 55 60 65 70
15 0.28 0.25 0.22 0.19 0.16 0.13 0.1 0.28 0.25 0.22 0.19 0.16 0.13 0.1 O ri e n ta ti o n p a ra m e te r (a) R=0.99 Orientation factor 0.25 0.24 0.23 0.22 0.21 0.2 0.26 0.65 0.6 0.55 0.5 0.45 0.4 0.7 S tr e s s (g /d e n ) R=0.99 R=0.99 Orientation factor 0.25 0.24 0.23 0.22 0.21
0.2 0.21 0.22 0.23 0.24 0.25 0.26
0.2 0.26 0.65 0.6 0.55 0.5 0.45 0.4 0.7 0.65 0.6 0.55 0.5 0.45 0.4 0.7 S tr e s s (g /d e n ) 0.3 0.275 0.25 0.225
0.2 0.325 0.35 0.375 0.4
Degree of alignment R=0.53 0.65 0.6 0.55 0.5 0.45 0.4 0.7 S tr e s s ( g /d e n ) 0.3 0.275 0.25 0.225
0.2 0.325 0.35 0.375 0.4
Degree of alignment R=0.53 0.65 0.6 0.55 0.5 0.45 0.4 0.7 S tr e s s ( g /d e n ) 0.3 0.275 0.25 0.225
0.2 0.225 0.25 0.275 0.3 0.325 0.35 0.375 0.4
0.2 0.325 0.35 0.375 0.4
Degree of alignment R=0.53 R=0.53 0.65 0.6 0.55 0.5 0.45 0.4 0.7 0.65 0.6 0.55 0.5 0.45 0.4 0.7 S tr e s s ( g /d e n ) (b) (c)
Figure 5: (a) Orientation parameter versus take up speed determined by Raman spectroscopy; (b) Stress
versus molecular orientation parameter; (c) Stress versus degree of alignment.
Figures 5 (b), (c) represent, respectively, the plots of stress versus molecular orientation parameter and degree of alignment. The higher the degree of alignment, the greater the number of fibers oriented in the tension direction. The higher correlation factor of 0.99 (stress- orientation factor curve) compared to 0.53 (stress- degree of alignment curve) suggests that the molecular orientation is more responsible for good mechanical properties of the resultant nanofibers than degree of alignment. The former factor is at the molecular level and controls the degree of crystallinity and, therefore, the macroscopic properties.
CONCLUSION
A simple and non-conventional electrospinning technique using two syringe pumps was employed for producing highly oriented polyacrylonitrile
Development and Characterization of Highly Oriented PAN Nanofiber 589
was obtained for those nanofibers collected at a take up velocity of 59.5 m/min. Moreover, polarized Raman spectroscopy under VV configuration at ψ= 0º (parallel) and 90º (Vertical) versus polarization plane and also in VH configuration at ψ=0 was used as a standard technique for measuring molecular orientation of PAN nanofibers. Similarly, a maximum chain orientation parameter of 0.25 was determined for nanofibers collected at a take up velocity of 59.5 m/min.
REFERENCES
Fennessey, S. F. and Farris, R. J., Fabrication of aligned and molecularly oriented electrospun polyacrylonitrile nanofibers and the mechanical behavior of their twisted yarns. Polymer, 45, 4217 (2004).
Gu, S. Y., Ren, J. and Wu, Q. L., Preparation and structures of electrospun PAN nanofibers as a precursor of carbon nanofibers. Synthetic Metals,
155, 157 (2005).
Huang, Y. S. and Koenig, J. L., Raman spectra of polyacrylonitrile. Applied Spectroscopy, 25, 620-622 (1971).
Huang, Z. M., Zhang, Y. Z., Kotaki, M. and Ramakrishna, S., A review on polymer nanofibers
by electrospinning and their applications in nanocomposites. Composites Science and Technology, 63, 2223 (2003).
Jalili, R., Morshed, M. and Hosseini Ravandi, S. A., Fundamental Parameters Affecting Electrospinning of PAN Nanofibers as Uniaxially Aligned Fibers. Journal of Applied Polymer Science, 101, 4350 (2006).
Liu, T. and Kumar, S., Quantitative characterization of SWNT orientation by polarized Raman spectroscopy. Chem. Phys. Lett, 378, 257 (2003). Pan, H., Li, L., Hu, L. and Cui, X., Continuous
aligned polymer fibers produced by a modified electrospinning method. Polymer, 47, 4901 (2006).
Ramakrishna, S., Fujihara, K., Teo, W. E., Lim, T. C. and Ma, Z., An introduction to electrospinning and nanofibers. World Scientific, Singapore (2005).
Ziabari, M., Mottaghitalab, V. and Haghi, A. K. Application of direct tracking method for measuring electrospun nanofiber diameter. Braz. J. Chem. Eng., 26, 1, 53 (2009).