ISSN 0104-6632 Printed in Brazil www.abeq.org.br/bjche
Vol. 27, No. 04, pp. 517 - 529, October - December, 2010
Brazilian Journal
of Chemical
Engineering
ENHANCEMENT OF CANTHAXANTHIN
PRODUCTION FROM
Dietzia
natronolimnaea
HS-1
IN A FED-BATCH PROCESS USING TRACE
ELEMENTS AND STATISTICAL METHODS
M. R. Nasri Nasrabadi
and S. H. Razavi
*Department of Food Science and Engineering, Faculty of Biosystem Engineering, College of Agriculture, University of Tehran, Phone/Fax: + 98 261 224 8804, P.O. Box 31587–78659, Karaj, Islamic Republic of Iran.
E-mail: [email protected]; *[email protected]
(Submitted: October 6, 2009 ; Revised: April 6, 2010 ; Accepted: July 15, 2010)
Abstract - Under fed-batch process conditions, the statistical analysis of trace elements was performed by
application of Plackett-Burman design (for screening tests) and response surface methodology (for predicting the optimal points) to achieve the highest level of canthaxanthin production from Dietzianatronolimnaea HS-1. Plackett-Burman design was conducted on eleven trace elements (i.e., aluminum, boron, cobalt, copper, iron, magnesium, manganese, molybdenum, selenium, vanadium and zinc) to select out elements that significantly enhance the canthaxanthin production of D. natronolimnaea HS-1. Plackett-Burman design revealed that Fe3+, Cu2+ and Zn2+ ions had the highest effect on canthaxanthin production of D.
natronolimnaea HS-1 (P<0.05). These three elements were used for further optimization. By means of response surface methodology for the fed-batch process, the optimum conditions to achieve the highest level of canthaxanthin (8923±18 g/L) were determined as follow: Fe3+ 30 ppm, Cu2+ 28.75 ppm and Zn2+ 27 ppm.
Keywords: Canthaxanthin; Fed-batch process; Trace elements; Dietzianatronolimnaea HS-1; Statistical designs.
INTRODUCTION
Carotenoids are synthesized de novo from isoprene units (ip) by a wide range of carotenogenic microbes (bacteria, fungi and yeasts) and photosynthetic organisms (green micro-algae, higher plants and lichens). These metabolites are the most extensively distributed class of natural pigments and more than 700 carotenoid molecules had been identified, characterized and classified up to 1999 (Tao et al., 2007). Carotenoids have essential nutraceutical functions in humans (Rao and Rao, 2007). Among them, canthaxanthin (β, β′-carotene-4, 4′-dione) is one of the most important xanthophylls from a commercial point of view because it is extensively applied in medicine, pharmaceuticals,
cosmetics, poultry, fishery and food industries (Perera and Yen, 2007). Canthaxanthin is synthesized by bacteria (D. natronolimnaea HS-1 (Khodaiyan et al., 2007), Dietzia sp. CQ4 (Tao et al., 2007), Dietzia natronolimnaios sp. nov. (Duckworth et al., 1998), Gordonia jacobaea
(Veiga-Crespo et al., 2005), Bradyrhizobium strain ORS278 (Hannibal et al., 2000), Corynebacterium michiganense (Saperstein and Starr, 1954),
Micrococus roseus (Cooney et al., 1996) and
Brevibacterium sp. KY-4313 (Nelis and De Leenheer, 1989)), green micro-algae (Chlorococcum
M. R. Nasri Nasrabadiand S. H. Razavi 518
Brazilian Journal of Chemical Engineering
be produced biotechnologically by different carotenogenic microbes, but they synthesize relatively low concentrations of canthaxanthin and so cannot compete economically with synthetic canthaxanthin (Nelis and De Leenheer, 1991). Among the above mentioned microbial sources of canthaxanthin, the bacterium D. natronolimnaea
HS-1 is reported as the one of the most promising sources for microbial production of canthaxanthin (Khodaiyan et al., 2007; Khodaiyan et al., 2008).
The carotenoid productivity of carotenogenic microbes can be improved by application of two strategies, including the supplementation of the culture broth by stimulators and the optimization of culture conditions via statistical experimental designs (Bhosale, 2004).
The effect of several types of stimulants on carotenoid production, e.g., trace elements or bio-elements, has been investigated by researchers (Bhosale, 2004). Trace elements have significant roles in microorganisms and act as cofactors of several enzymes involved in the biosynthetic pathway of valuable metabolites (Goodwin, 1984).
Optimization of culture conditions by use of statistical experimental designs is a fundamental strategy for microbial fermentations to achieve the highest level of valuable metabolites produced by target strains (Parekh et al., 2000). Statistical experimental designs such as Plackett-Burman design (PBD) and response surface methodology (RSM) are powerful tools that are extensively applied in various fields, including microbial processes, to determine the interactive influences of fermentation variables and optimize the significant factors for the target responses (Myers and Montgomery, 2002). Statistical designs have been successfully performed in different fields, including food engineering (Singh et al., 2008), bioprocess engineering (Oddone et al., 2007), medium composition and fermentation conditions (Vohra and Satyanarayana, 2002).
Plackett-Burman design (PBD) is a useful tool for ‘screening tests’ to identify and select the most effective variables with positive significant effect from others with negative effect on response level. This approach has been extensively used in various fields, including the optimization of culture conditions, the evaluation of culture requirements and food engineering (Soliman et al., 2005). Also, PBD has been successfully applied in the optimization of fermentative mediums for carotenoid production by carotenogenic strains (Liu and Wu, 2007).
On the other hand, response surface methodology (RSM), which includes certain statistical techniques, has been widely used in various fields for designing trials and determining the most significant factors and optimal conditions for the target responses (Harker et al., 2005). Also, this method leads to a better understanding of the effects of variables and, more importantly, the interaction of factors (Myers and Montgomery, 2002).
In this work, we supplemented cultures with trace elements to enhance the canthaxanthin production by
D. natronolimnaea HS-1. Then, a combination of Plackett-Burman design (PBD) with response surface methodology (RSM) was performed on the fed-batch process to select out the trace elements that significantly increased the canthaxanthin production of D. natronolimnaea HS-1 and determine their optimum concentrations.
MATERIAL AND METHODS
Reagents and Chemicals
The media ingredients, trace elements (aluminum as Al2(SO4)3·6H2O, iron as FeCl3·6H2O, cobalt as CoCl2·6H2O, magnesium as MgSO4·7H2O, selenium as Na2SeO3, manganese as MnCl2·4H2O, molybdenum as Na2MoO4·2H2O, vanadium as VOSO4, copper as CuSO4·5H2O, boron as H3BO3 and zinc as ZnSO4·7H2O), D(+)–glucose, yeast extract, peptone, malt extract, agar and Antifoam 289 were all purchased from the Sigma-Aldrich Chemical Company (Sigma-Aldrich Co., United States). Methanol, dichloromethane and acetonitrile (HPLC grade) were obtained from Merck (Merck Co., Germany). The pure ethanol (99.9%, v/v) was purchased from the Bidestan Company (Qazvin, Iran). The canthaxanthin standard was supplied by Dr. Ehrenstorfer Gmbh (Germany).
Source Microorganism and Culture Conditions
Enhancement of Canthaxanthin Production from Dietzianatronolimnaea HS-1 in a Fed-Batch Process 519
for 5 days and transferred to fresh plates every month, and then kept at 4°C.
Preparation of Inoculum
Inoculum was prepared in liquid YM medium as mentioned above but without agar in 500-mL Erlenmeyer flasks, containing 100 mL of YM medium each. The flasks were inoculated with a loopful of the bacterium D. natronolimnaea HS-1 from an agar plate and incubated in an orbital incubator (model Stuart S150; Staffordshire, United Kingdom) at 180 rpm and 28±1°C and, after 4 days, used to inoculate the bioreactor.
Experiments and Bioreactor Set-Up
For experiments, cultures were prepared with 15 (g/L) glucose, 6 (g/L) yeast extract and 10 (g/L) peptone. To determine the effects of trace elements on canthaxanthin production, they were added to the above mentioned medium according to Table 1 (for screening tests) and Table 2 (for the
optimization test). Fed-batch trials were performed in a 3 L bioreactor (model LiFlus, GSBiotron Inc., Korea) according to Table 1 and Table 2. The feeding flow rates were defined using the dynamic optimization techniques to optimize the stepwise feeding flow rate. The initial volume of fermentation medium in the fermentor was 1 L and the total volume of medium in the fermentor was 1.5 L. In all experiments, 500 mL of feeding solution was added to the fed-batch trials between 48 and 120 h (i.e., logarithmic growth phase) using the following flow rates: 48 to 56 h: 2.625 mL/h; 56 to 64 h: 3.75 mL/h; 64 to 72 h: 4.25 mL/h; 72 to 80 h: 5.75 mL/h; 80 to 88 h: 6.875 mL/h; 88 to 96 h: 7.75 mL/h; 96 to 104 h: 8.625 mL/h; 104 to 112: 10.75 mL/h; 112 to 120: 12.125 mL/h; and 128 to 136: 12.125 mL/h. The pH was automatically controlled at 7.5±0.1 by use of 2 M HCl and 2 M NaOH. The temperature was automatically controlled at 28±1°C. The dissolved oxygen concentration was maintained at above 40% of air saturation by controlling air flow-rate and agitation speed (300-900 rpm). Also, Antifoam 289 was used as an antifoam agent to prevent foaming.
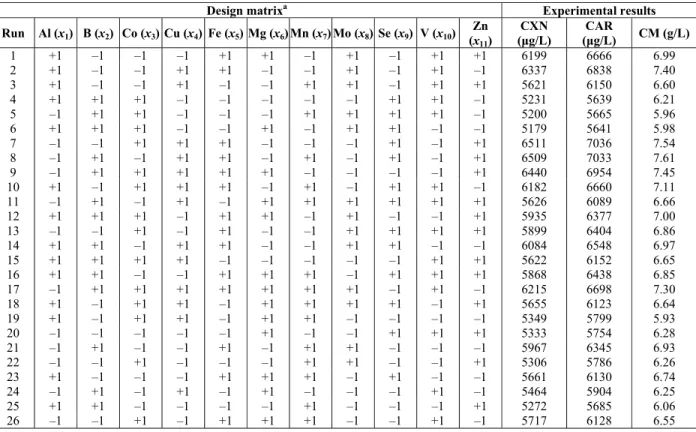
Table 1: Plackett-Burman design matrix and experimental results. aluminum (Al, ppm); boron (B, ppm); cobalt (Co, ppm); copper (Cu, ppm); iron (Fe, ppm); magnesium (Mg, ppm); manganese (Mn, ppm); molybdenum (Mo, ppm); selenium (Se, ppm); vanadium (V, ppm); zinc (Zn, ppm); canthaxanthin (CXN,
μg/L); total carotenoid (CAR, μg/L); cell mass (CM, g/L)
Design matrixa Experimental results
Run Al (x
1) B (x2) Co (x3) Cu (x4) Fe (x5) Mg (x6) Mn (x7) Mo (x8) Se (x9) V (x10)
Zn (x11)
CXN (μg/L)
CAR
(μg/L) CM (g/L)
1 +1 –1 –1 –1 +1 +1 –1 –1 +1 +1 +1 6199 6666 6.99
2 +1 –1 –1 +1+1 –1 –1 –1 +1 –1 +1 6337 6838 7.40
3 +1 –1 –1 –1 +1 –1 +1 –1 +1 +1 +1 5621 6150 6.60
4 +1 +1 +1 –1 –1 –1 –1 –1 +1 +1 –1 5231 5639 6.21
5 –1 +1 +1 –1 –1 –1 +1 +1+1 +1 –1 5200 5665 5.96
6 +1 +1 +1 –1 –1 +1 –1 +1+1 –1 –1 5179 5641 5.98
7 –1 –1 +1 +1 +1 –1 –1 –1 +1 –1 6511 +1 7036 7.54
8 –1 +1 –1 +1+1 –1 +1 –1 +1 –1 6509 +1 7033 7.61
9 –1 +1 +1 +1 +1 +1 –1 –1 –1 –1 +1 6440 6954 7.45
10 +1 –1 +1 +1 +1 –1 –1 +1 +1+1 –1 6182 6660 7.11
11 –1 +1 –1 –1 +1 +1+1 +1 +1 +1 +1 5626 6089 6.66
12 +1 +1 +1 –1 +1+1 –1 –1 +1 –1 5935 +1 6377 7.00
13 –1 –1 +1 –1 –1 +1 –1 +1+1 +1 5899 +1 6404 6.86
14 +1 +1 –1 +1+1 –1 –1 +1+1 –1 –1 6084 6548 6.97
15 +1 +1 +1 +1 –1 –1 –1 –1 –1 +1 +1 5622 6152 6.65
16 +1 +1 –1 –1 +1+1 +1 –1 +1 +1+1 5868 6438 6.85
17 –1 +1 +1 +1 +1 +1 +1 +1 –1 –1 +1 6215 6698 7.30
18 +1 –1 +1+1 –1 +1+1 +1 +1 –1 +1 5655 6123 6.64
19 +1 –1 +1+1 –1 +1+1 –1 –1 –1 –1 5349 5799 5.93
20 –1 –1 –1 –1 –1 +1 –1 –1 +1 +1 +1 5333 5754 6.28
21 –1 +1 –1 –1 +1 –1 +1 +1 –1 –1 –1 5967 6345 6.93
22 –1 –1 +1 –1 –1 –1 +1 +1 –1 –1 +1 5306 5786 6.26
23 +1 –1 –1 –1 +1 +1 +1 –1 +1 –1 –1 5661 6130 6.74
24 –1 +1 –1 +1 –1 +1 –1 –1 –1 +1 –1 5464 5904 6.25
25 +1 +1 –1 –1 –1 –1 –1 +1 –1 –1 +1 5272 5685 6.06
M. R. Nasri Nasrabadiand S. H. Razavi 520
Brazilian Journal of Chemical Engineering
Continuation Table 1
Design matrixa Experimental results
Run Al (x1) B (x2) Co (x3) Cu (x4) Fe (x5) Mg (x6) Mn (x7) Mo (x8) Se (x9) V (x10) Zn (x11)
CXN (μg/L)
CAR
(μg/L) CM (g/L)
27 –1 –1 –1 +1 –1 +1 –1 +1 +1 –1 –1 5532 5918 6.60
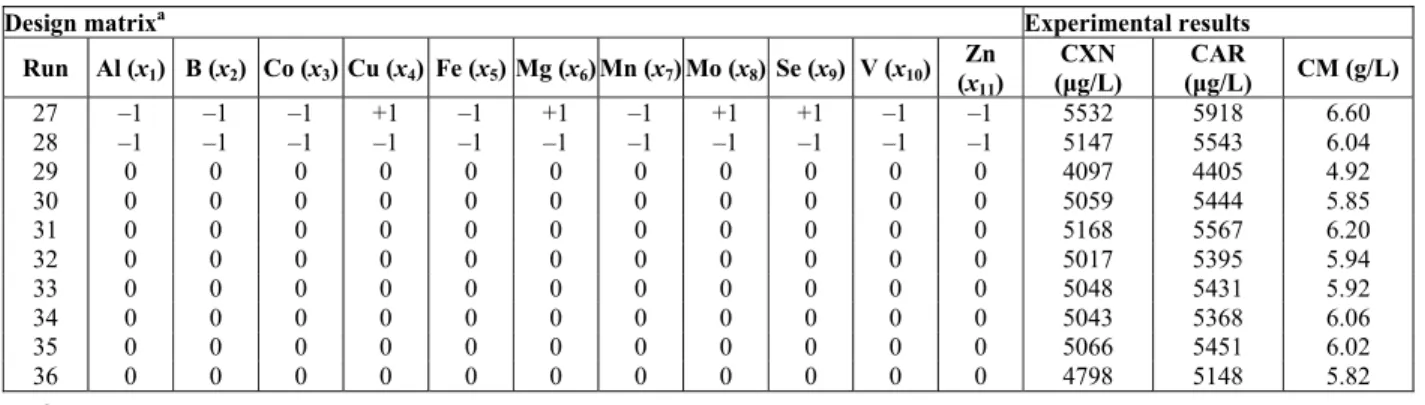
28 –1 –1 –1 –1 –1 –1 –1 –1 –1 –1 –1 5147 5543 6.04 29 0 0 0 0 0 0 0 0 0 0 0 4097 4405 4.92 30 0 0 0 0 0 0 0 0 0 0 0 5059 5444 5.85 31 0 0 0 0 0 0 0 0 0 0 0 5168 5567 6.20 32 0 0 0 0 0 0 0 0 0 0 0 5017 5395 5.94 33 0 0 0 0 0 0 0 0 0 0 0 5048 5431 5.92 34 0 0 0 0 0 0 0 0 0 0 0 5043 5368 6.06 35 0 0 0 0 0 0 0 0 0 0 0 5066 5451 6.02 36 0 0 0 0 0 0 0 0 0 0 0 4798 5148 5.82
a
Fed-batch runs in the bioreactor.
Table 2: Coded levels and actual values of the variables tested in response surface methodology (RSM):
canthaxanthin (CNX, μg/L); total carotenoid (CAR, μg/L); cell mass (CM, g/L)
Design matrix Experimental results
Cu2+ (x4) Fe3+ (x5) Zn2+ (x11) CXN (μg/L) CAR (μg/L) CM (g/L) Runa Code Level
(ppm) Code
Level
(ppm) Code
Level (ppm)
1 –1 10 –1 10 –1 10 5160 5503 5.88
2 –1 10 +1 35 –1 10 6685 7266 7.86
3 +1 35 –1 10 –1 10 6729 7356 7.66
4 +1 35 +1 35 –1 10 8231 8898 8.98
5 –1 10 –1 10 +1 35 6527 7010 7.28
6 –1 10 +1 35 +1 35 7932 8805 8.98
7 +1 35 –1 10 +1 35 7831 8543 8.96
8 +1 35 +1 35 +1 35 8483 9114 9.24
9 0 22.5 –1.682 1.5 0 22.5 6174 6697 6.81
10 0 22.5 +1.682 43.5 0 22.5 8361 9056 9.19
11 –1.682 1.5 0 22.5 0 22.5 6371 6837 7.26
12 +1.682 43.5 0 22.5 0 22.5 8139 8747 8.97
13 0 22.5 0 22.5 –1.682 1.5 6508 6991 7.32
14 0 22.5 0 22.5 +1.682 43.5 8039 8843 8.92
15 0 22.5 0 22.5 0 22.5 8574 9392 9.40
16 0 22.5 0 22.5 0 22.5 8573 9319 9.49
17 0 22.5 0 22.5 0 22.5 8671 9387 9.44
18 0 22.5 0 22.5 0 22.5 8573 9357 9.58
19 0 22.5 0 22.5 0 22.5 8573 9207 9.36
20 0 22.5 0 22.5 0 22.5 8399 9130 9.27
a
Fed-batch runs by bioreactor.
Analytical Determinations
Extraction and Estimation of Carotenoid
At appropriate time intervals (i.e., during the fermentation process, samples were taken from the bioreactor every 8 h), aliquots (10 mL) of cultures were taken from each fed-batch trial and centrifuged at 10,000 ¯g for 5 min at 4°C to remove supernatant. The supernatant was collected to measure the glucose content. Then, cell pellets were washed twice with physiological water (NaCl; 9 g/L in deionized water) and centrifuged again. Then, cells were resuspended in 2 mL of pure ethanol by vortexing for 5 min, and the
Enhancement of Canthaxanthin Production from Dietzianatronolimnaea HS-1 in a Fed-Batch Process 521 9
474 s
1 % 1 cm
(A ) (V ) (10 ) Total carotenoid ( g/L)
(A ) (100)
× ×
μ =
×
where A474 is the absorbance maximum of total carotenoid in ethanol, Vs the volume of sample solution, and A1%1 cm is the specific absorption coefficient of total carotenoid for a 1% solution in a 1 cm cell. In ethanol, A1%1 cm =2200. The
canthaxanthin concentration was determined by high performance liquid chromatography (HPLC) (model Knauer, Germany) using a Symmetry analytical C18 column (150 mm×4.6 mm, 300 Å) with a 3.5 m sphere diameter (Waters, United States) (Razavi et al., 2007). The ultraviolet (UV) detector (model K-2600, Knauer, Germany) was operated at 420-500 nm and the column temperature was maintained at 35°C. The mobile phase was 1 mL/min of an isocratic acetonitrile-methanol-dichloromethane solvent mixture (71:22:7, v/v/v).
Cell Biomass and Sugar Content Measurement
For biomass dry weight measurement, culture samples (5 mL) were filtered through 0.2 µm-pore-size polyamide membrane filters (Sigma-Aldrich Co., United States) (dried at 65°C for 12 h), washed twice with distilled water, and dried at 105°C to constant weight (48 h).
For glucose content measurement, the supernatant from ethanol extraction of carotenoid pigments was filtered through 0.2 µm filters. Then, glucose content (reducing sugar) was measured via Miller (3, 5-dinitrosalicylic acid) method (Miller, 1959).
Experimental Design and Data Analysis
Plackett-Burman design (for screening tests) and response surface methodology (for predicting the optimal points) were applied to perform the optimization strategy. For the experimental design and statistical calculations, the variables Xk were coded as xk by means of the following equation:
* k k k
k
X X
x
X
−
= Δ (1)
In this equation, xk is the dimensionless coded value of the variable Xk; X the value of *k Xk at the
center point; and ΔXk is the step change.
To evaluate the effect of trace elements on cell mass, total carotenoid and canthaxanthin production by D. natronolimnaea HS-1, screening trials were conducted on all eleven variables (n=11) by the use of Plackett-Burman design. This approach resulted in 28 experimental runs and eight center points in the fed-batch process (Table 1). The coded levels and natural values of the eleven trace elements (factors) examined via Plackett-Burman design (screening tests) are shown in Table 3. To identify and select the most effective variables with positive significant effect from others with an insignificant effect on response level, we employed a pareto chart and a normal probability plot at an alpha level of 0.05. To optimize the selected variables (significant factors) from Plackett-Burman design, a response surface methodology was performed according to Table 2 for the fed-batch process. The data obtained by this approach were fit with a second-order polynomial equation by application of a multiple regression method. To predict the optimal points of selected variables, the following quadratic polynomial model was used:
3 3 3
2
0 k i k, k k k, i k i k 1 k 1 k 1 i k
Pr α α x α x α x x
= = = <
= +
∑
+∑
+∑∑
(2)In this model, the subscripts (i.e., k and i) range from 1 to the number of variables, Pr is the predicted response, α0 is the intercept term, αk are the linear coefficients, αk, k are the quadratic coefficients, and
M. R. Nasri Nasrabadiand S. H. Razavi 522
Brazilian Journal of Chemical Engineering
Table 3: Factors to be screened in Plackett-Burman design (screening tests) and actual values for the three levels of the variables
Levels
Low Middle High Factors (Variables) Symbols
Coded level Actual value
(ppm) Coded level
Actual value
(ppm) Coded level
Actual value (ppm)
Aluminum (Al) x1 –1 10 0 22.5 +1 35
Boron (B) x2 –1 10 0 22.5 +1 35
Cobalt (Co) x3 –1 10 0 22.5 +1 35
Copper (Cu) x4 –1 10 0 22.5 +1 35
Iron (Fe) x5 –1 10 0 22.5 +1 35
Magnesium (Mg) x6 –1 10 0 22.5 +1 35
Manganese (Mn) x7 –1 10 0 22.5 +1 35
Molybdenum(Mo) x8 –1 10 0 22.5 +1 35
Selenium (Se) x9 –1 10 0 22.5 +1 35
Vanadium (V) x10 –1 10 0 22.5 +1 35
Zinc (Zn) x11 –1 10 0 22.5 +1 35
RESULTS AND DISCUSSION
Screening of the Significant Factors
In statistical experimental designs, screening tests are extensively applied to select the most effective variables with positive significant effect from others with and insignificant effect on target responses (Myers and Montgomery, 2002). In this work, we employed a Plackett-Burman design for the fed-batch process as screening tests to evaluate the influence of eleven trace elements (i.e., aluminum, boron, cobalt, copper, iron, magnesium, manganese, molybdenum, selenium, vanadium and zinc) on canthaxanthin, total carotenoid and cell mass production. The design matrix and experimental
results (dependent variables) for canthaxanthin, total carotenoid and cell mass production that resulted from the 36-trial Plackett-Burman test under fed-batch process conditions are shown in Table 1. The data obtained by this approach were subjected to regression analysis and analysis of the variance (ANOVA). The main influences of eleven trace elements (independent variables) were evaluated via the fit of first order models to the experimental data. At the 95% confidence level, the F-value was used to determine the significance of the models. On the basis of the data obtained from the analysis of the variance (ANOVA) and the regression coefficients, it is clear that the first order models for canthaxanthin, total carotenoid and cell mass production are satisfactory (Table 4).
Table 4: Summarized data of analysis of variance* (ANOVA) of the second-order model obtained for
canthaxanthin production according to the experimental design defined in Table 2
Source of variation dfa
Sum of squares Mean square F-value P-value
Canthaxanthin production model (Eq. (3))
Regression 9 21259555 2362173 165.94 <0.0001
Linear 3 13378144 4459381 313.27 <0.0001
Square 3 7490128 2496709 175.39 <0.0001
Interaction 3 391282 130427 9.16 0.003
Residual Error 10 142350 14235
Lack-of-Fit 5 103537 20707 2.67 0.153
Pure Error 5 38813 7763
Total 19 21401905
Model terms Coefficients Values dfa
Standard error t-value P-value
Intercept α0 8560.60 1 48.66 175.92 <0.0001
x4 (Cu2+) α4 581.65 1 32.29 18.01 <0.0001
x5 (Fe 3+
) α5 641.64 1 32.29 19.87 <0.0001
x11 (Zn2+) α11 479.14 1 32.29 14.84 <0.0001
2 2 2
4
x (Cu+* Cu+) α4, 4 –459.37 1 31.43 –14.61 <0.0001
2 3 3
5
x (Fe+* Fe )+ α5, 5 –454.77 1 31.43 –14.47 <0.0001
2 2 2
11
x (Zn+* Zn+) α11, 11 –452.89 1 31.43 –14.41 <0.0001
x4x5 (Cu2+ * Fe3+) α4, 5 –97.04 1 42.18 –2.30 0.044
x4x11 (Cu2+ * Zn2+) α4, 11 –157.50 1 42.18 –3.73 0.004
x5x11 (Fe 3+
* Zn2+
) α5, 11 –121.19 1 42.18 –2.87 0.017
* r2
=99.3% and adjusted r2
=98.7%.
a
Enhancement of Canthaxanthin Production from Dietzianatronolimnaea HS-1 in a Fed-Batch Process 523 E ff e c t E st im a te ( A b so lu te V a lu e ) Co Se B V Mo Al Mn Mg Zn Cu Fe 9 8 7 6 5 4 3 2 1 0
p = 0.05
0.02 0.05 0.19 0.23 0.33 –0.35 –0.54 –0.73 2.68 4.79 8.74
Pareto Chart of the Standardized Effects; Response: Total Carotenoid; p = 0.05
E ff e c t E st im a te ( A b so lu te V a lu e ) V Se B Co Mo Al Mg Mn Zn Cu Fe 9 8 7 6 5 4 3 2 1 0
p = 0.05
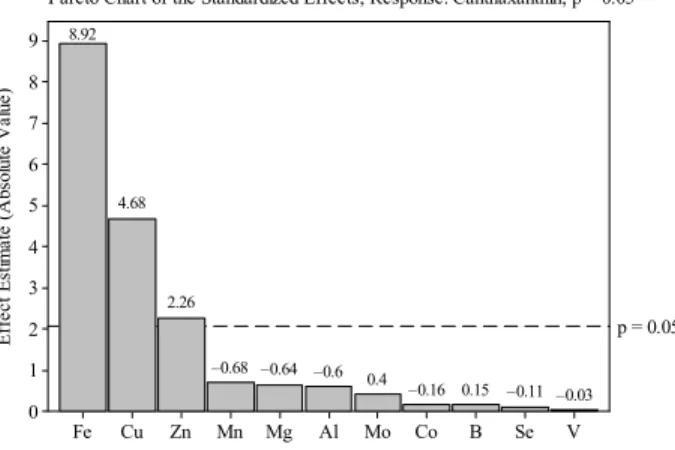
–0.03 –0.11 0.15 –0.16 0.4 –0.6 –0.64 –0.68 2.26 4.68 8.92
Pareto Chart of the Standardized Effects; Response: Canthaxanthin; p = 0.05
Figure 1: Pareto chart of the main effects for
Plackett-Burman design on total carotenoid production. Al (aluminum, ppm); B (boron, ppm); Co (cobalt, ppm); Cu (copper, ppm); Fe (iron, ppm); Mg (magnesium, ppm); Mn (manganese, ppm); Mo (molybdenum, ppm); Se (selenium, ppm); V (vanadium, ppm); Zn (zinc, ppm)
Figure 2: Pareto chart of the main effects for
Plackett-Burman design on canthaxanthin production. Al (aluminum, ppm); B (boron, ppm); Co (cobalt, ppm); Cu (copper, ppm); Fe (iron, ppm); Mg (magnesium, ppm); Mn (manganese, ppm); Mo (molybdenum, ppm); Se (selenium, ppm); V (vanadium, ppm); Zn (zinc, ppm)
The pareto chart can be used in statistical experimental design to identify the most important effects of independent variables on the target responses (Haaland, 1989). For this reason, it was employed for determining the significant factors in this work. It should be noted here that the length of each bar on the pareto chart is proportional to the absolute value of its estimated effect or associated regression coefficient (Haaland, 1989) (Fig. 1 and Fig. 2). The pareto chart and the normal probability plot for total carotenoid and canthaxanthin production are shown in Fig. 1 and Fig. 2, respectively. From these figures, it is clear that, of the eleven trace elements tested, only Fe3+, Cu2+ and Zn2+ ions have a significant effect (P<0.05) on canthaxanthin and total carotenoid production by D.
natronolimnaea HS-1. For this reason, only these three trace elements were chosen as the significant variables and used in the subsequent optimization trials.
Optimization of Canthaxanthin Production
Because more than 90% of the total carotenoid produced by D. natronolimnaea HS-1 is canthaxanthin, we focused on the optimization of canthaxanthin production in this work.
Under fed-batch process conditions, the optimum concentration of the trace elements (i.e., Fe3+, Cu2+ and Zn2+) selected from Plackett-Burman design to achieve the highest level of canthaxanthin was determined by application of a response surface methodology (RSM). The optimization process was performed according to
Table 2. Ferric, zinc and copper ions, each at five levels and six replicates at the center point were used in the fed-batch process. It should be noted here that the use of center points is necessary to account for pure internal error in optimization processes (Myers and Montgomery, 2002) (Table 4). The design matrix and experimental results for canthaxanthin, total carotenoid and cell mass production that resulted from the 20-trial response surface test for the fed-batch process are shown in Table 2.
The data obtained by RSM (Table 2) were fit with a second-order polynomial equation (Equation 2), which created the second-order response surface model in the form of analysis of variance (ANOVA) (Table 4). According to ANOVA, the model obtained was significant because the lack-of-fit test, which measures the fitness of the model, did not result in a significant P-value (P=0.153), and only 0.70% of the total variance was not explained by the model (r2=99.3%). The value of the adjusted determination coefficient, which is a measure of fitness of the regressed model, was also high (r2adj=98.7%), suggesting that the experimental data are in good agreement with predicted values and that higher-order terms are not necessary (Myers and Montgomery, 2002). As a result, the polynomial model describing the correlation between canthaxanthin synthesized by D. natronolimnaea
HS-1 and the three variables (x4=Cu2+, x5=Fe3+ and
M. R. Nasri Nasrabadiand S. H. Razavi 524
Brazilian Journal of Chemical Engineering
4 5 11
2 2 2
4 5 11
4 5 4 11 5 11
Canthaxanthin production
8560.60 581.65x 641.64x 479.14x
459.37x 454.77x 452.89x
97.04x x 157.5x x 121.19x x
=
+ + +
− − −
− − −
(3)
Where the xk are the coded independent factors (Table 2 and Table 4).
The contour plots (two-dimensional plots) were established from the quadratic model (Equation 3) summarized in Table 4 and applied to show the influence of the three independent variables (Cu2+, Fe3+, and Zn2+ ions) on the dependent variable (canthaxanthin production) and the interaction of the independent variables. In these plots, two variables alter in the range of the experimental design (Table 2), while the third factor remains constant at its optimal value (Fig. 3). The contour plots provide useful information on the process conditions necessary to achieve the desired value of the response. All contour plots were convex, containing the maximum response inside the design boundary (Fig. 3).
Fig. 3(a) shows that canthaxanthin synthesized by
D. natronolimnaea HS-1 is promoted by increasing Fe3+ or Cu2+ concentration up to around 30 and 28 ppm, respectively. Also, when the concentration of Fe3+ or Cu2+ stayed steady, canthaxanthin synthesis reduced with increasing level of Fe3+ or Cu2+ above 30 and 28 ppm, respectively. Fig. 3(b) shows the response arising from the interaction between Fe3+ and Zn2+ concentrations. On the basis of this plot, canthaxanthin synthesis is promoted by enhancing both the variables (Fe3+ and Zn2+) up to around 30 and 27 ppm, respectively. From this plot, it is clear that a further increase in Fe3+ and Zn2+ concentration resulted in a reduction in canthaxanthin synthesis by
D. natronolimnaea HS-1. The interaction of Cu2+ and Zn2+ is shown in Fig. 3(c). In this graph, canthaxanthin synthesis is promoted by increasing
Cu2+ and Zn2+ concentration up to around 28 and 27 ppm, respectively. However, canthaxanthin synthesis is reduced at higher concentrations of mentioned variables.
The results in Table 4 and Eq. (3) reveal that the interactions between variables are significant (P<0.05). In other words, the quadratic factors (Fe3+ * Fe3+, Cu2+ * Cu2+, and Zn2+ * Zn2+) and the interaction between variables (Fe3+ * Cu2+, Fe3+ * Zn2+, and Cu2+ * Zn2+) showed the more pronounced stimulatory influences on canthaxanthin synthesis (response) (P<0.05).
On the basis of the above mentioned results, the optimal concentrations Fe3+, Cu2+ and Zn2+ ions to achieve the highest level of canthaxanthin are around 30, 28 and 27 ppm, respectively.
Equation 3 was solved and the optimum point for the achievement of maximal canthaxanthin production was determined to be at x4=0.50, x5=0.60, and x11=0.36, corresponding to the actual values of Cu2+ 28.75 ppm, Fe3+ 30 ppm, and Zn2+ 27 ppm, respectively. Under optimal conditions, the model predicts that the highest level of canthaxanthin production is 8988 g/L.
Validation of the Optimal Conditions and Model
Under the optimal conditions, an additional series of fed-batch experiments in three replicates (confirmatory experiments) was carried out to assess the validity of the quadratic model. Accordingly, the maximal content of canthaxanthin resulting from the fed-batch experiments was 8923±18 g/L on the 7th day of fermentation. This result is very near to the canthaxanthin content predicted by application of response surface methodology under optimal conditions (8988 g/L). This suggests that there is a good agreement between the values predicted by the model and experimental data, and confirms that the model is a good predictor of the experimental results.
(a) (b) (c)
Figure 3: Contour plots (two-dimensional surface plots) of the model equation fitted to the data. (a) interaction
Enhancement of Canthaxanthin Production from Dietzianatronolimnaea HS-1 in a Fed-Batch Process 525
The time courses of cell mass, canthaxanthin and total carotenoid production are shown in Fig. 4. For the optimal condition test, the experiments were carried out for 240h, as in Figure 4, and the feed solution was added until 120 h. The samples for analysis were collected from the bioreactor every 8 h. This plot shows that, by using the optimal conditions for the fed-batch process, the maximal content of cell mass (9.11±0.12 g/L) was obtained on the 6th day of fermentation, while the maximal content of canthaxanthin (8923±18 g/L) and total carotenoid (9684±22 g/L) were achieved on the 7th day of fermentation. This means that the maximal content of canthaxanthin synthesized by D. natronolimnaea
HS-1 occurs at the end of the exponential growth phase. It should be mentioned here that carotenoid molecules are synthesized from isoprene units (ip) produced via the mevalonate biosynthetic pathway (MVA), which is one of the most important secondary metabolic pathways in carotenogenic
microbes (Bailey and Ollis, 1986). Canthaxanthin synthesized by D. natronolimnaea HS-1 is a partially growth-associated product because it is produced during the growth phases and its accumulation occurs at the end of the exponential growth phase (Khodaiyan et al., 2008). A similar pattern has also been observed in some other carotenogenic strains such as Phaffia rhodozyma (Vazquez et al., 1997), Chlorococcum sp. (Zhang and Lee, 2001), Rhodotorula mucilaginosa
(Aksu and Eren, 2005), Gordonia jacobaea (Veiga-Crespo et al., 2005), and Sporobolomycesruberrimus
H110 (Razavi et al., 2007).
In this work, our results revealed that ferric, zinc and copper ions have the greatest stimulatory effect on the canthaxanthin biosynthesis of D.
natronolimnaea HS-1. In previously work, without the use of trace elements, Khodaiyan et al. (2007) showed that the maximum canthaxanthin production was 5.29 mg/L. Table 5 shows the comparison between microbial sources of canthaxanthin.
0 5 10 15 20 25 30 35
0 24 48 72 96 120 144 168 192 216 240 264
Time (h)
C
el
l ma
ss
(
g
/L
)
0 1000 2000 3000 4000 5000 6000 7000 8000 9000 10000 11000
C
a
n
th
axan
th
in
(
μ
g/
L
)
an
d
T
o
ta
l c
a
ro
te
n
o
id
(
μ
g/
L
)
Cell mass (g/L) Canthaxanthin ( g/L) Total carotenoid ( g/L)
Figure 4: Time-course of canthaxanthin, total carotenoid and cell mass
production by Dietzianatronolimnaea HS-1 in the fed-batch process under the optimum conditions (i.e., Fe3+ 30 ppm, Cu2+ 28.75 ppm and Zn2+ 27 ppm)
Table 5: A comparison between important canthaxanthin-producing strains
Microbial source Microorganism
type Canthaxanthin (μg/L)
Canthaxanthin
(μg/g) Reference
Bradyrhizobium strain ORS278 *
bacterium 780 1340 Hannibal et al. (2000)
Brevibacterium KY-4313 *
bacterium 7200 --- Nelis and De Leenheer (1989)
Chlorellaemersonii*
green mico-alga 600 --- Arad et al. (1993)
Chlorellazofingiensis*
green mico-alga --- 2970 Pelah et al. (2004)
Chlorococcum sp. strain MA-1 *
green mico-alga --- 1950 Zhang and Lee (2001)
Dictyococcuscinnabarinus*
green mico-alga --- 1000 Gribanovski-Sassu (1973)
Dietzianatronolimnaea HS-1a *
bacterium 5320 700 Khodaiyan et al. (2007)
Dietzianatronolimnaea HS-1b *
bacterium 5290 --- Khodaiyan et al. (2007)
Dietzianatronolimnaea HS-1 **
bacterium 8923 --- This work
Gordoniajacobaea MV-1 *
bacterium 3200 227 De Miguel et al. (2000)
Haloferaxalexandrinus TMT*
archaea 2190 690 Asker and Ohta (2002)
Micrococcusroseus*
bacterium 1700 --- Cooney et al. (1966)
Xanthophyllomycesdendrorhous*
yeast 2950 --- Vazquez et al. (1997)
a
Results obtained from Shake-flask culture.
b
Results obtained from batch fermenter system.
*
without trace elements.
**
M. R. Nasri Nasrabadiand S. H. Razavi 526
Brazilian Journal of Chemical Engineering
It was found that carotenogenesis in other carotenogenic strains was induced in the presence of trace elements. For example, Kobayashi et al. (1992) supplemented the medium of Haematococcus pluvialis with ferric salts and showed the improvement of astaxanthin synthesized by this green micro-alga (Kobayashi et al., 1992). Also, Mahattanatavee and Kulprecha (1991) reported that the supplementation of the growth medium with iron, zinc and copper ions improved the carotenoid production of Rhodotorula strains (Mahattanatavee and Kulprecha, 1991). Bhosale and Gadre (2001) showed that iron, zinc, and calcium ions had the highest stimulatory influence on both the cellular accumulation (mg/g) and volumetric production (mg/L) of carotenoids by the yeast Rhodotorula glutinis. Furthermore, it was reported that the carotenogenesis of mated Blakeslea trispora was enhanced in the presence of copper, iron and magnesium ions, a several-fold increase being observed in the final yield. In other research, copper, cobalt, calcium, and barium ions stimulated the carotenogenesis of the pink yeast Rhodotorularubra
(Atamanyuk and Razumorskii, 1974; Daushvili and Elisashvili, 1990; Gammal and Rizk, 1989). Komemushi et al. (1994) demonstrated that divalent cations (such as barium) act as inducers for growth of Rhodotorula glutinis (Komemushi et al., 1994). Furthermore, statistical analysis of trace elements by means of response surface methodology revealed that Co2+ and Mn2+ ions had the highest effect on total carotenoid production of the red yeast
Rhodotorulagraminis (Buzzini et al., 2005).
It has been reported that heavy metals such as cobalt promote carotenoid production from the cyanobacterium Spirulina platensis at very low concentrations. Similarly, Wang et al. (1999) reported that heavy metal ions such as lanthanum, cerium and neodymium induce the carotenoid synthesis of the yeast Xanthophyllomyces dendrorhous. For the stimulatory effect of heavy metal ions on carotenogenesis of carotenogenic microbes, it has been reasoned that these ions are commonly associated with uptake systems and intracellular binding sites, which is turn enhance carotenoid synthesis (Bhosale, 2004). In contrast, in our study cobalt had no significant effect on canthaxanthin production of D. natronolimnaea HS-1 (Fig. 2). This suggests a difference between the various species of carotenogenic microbes in carotenogenesis.
Although the above mentioned reports and their data confirm the stimulatory effect of trace elements on carotenogenesis, bio-elements have not yet been
assigned a definite function in carotenoid synthesis and no detailed study or research has been performed on the optimum concentration of trace elements to ensure high carotenoid synthesis by carotenogenic microbes.
The stimulatory effect of trace elements on carotenogenesis of the carotenogenic strains can be explained according to the following hypotheses. It can be assumed that trace elements affect the enzymes involved in carotenogenesis (Goodwin, 1980). For example, some trace elements such as Fe2+, Zn2+, Mg2+ and Mn2+ ions are known to act as cofactors for enzymes involved in the carotenoid biosynthetic pathway and, therefore, they enhance carotenoid production at certain concentrations (Sandmann, 1994; Sandmann, 2001). Another suggested hypothesis is that the generation of active oxygen radicals (e.g., 1O2 and HO●) in the culture broth stimulates carotenoid synthesis. On the basis of this hypothesis, the stimulatory effect of ferrous ions on carotenogenesis might be due to the hydroxyl radical generated via the ‘Fenton reaction’ (H2O2 + Fe2+´ Fe3+ + HO− + HO●), which would in turn increase the biosynthesis of carotenoids (Tjahjono et al., 1994).
Compared to the concentration of canthaxanthin produced by other microbial sources of this pigment, such as various bacteria, including
Dietzia sp. CQ4 (Tao et al., 2007), D.
natronolimnaios sp. nov. (Duckworth et al., 1998),
Brevibacterium KY-4313 (Nelis and De Leenheer, 1989), Bradyrhizobium strain ORS278 (Hannibal et al., 2000), and Gordoniajacobaea MV-1 (De Miguel et al., 2000); the halophilic archaeon Haloferax alexandrinus TMT (Asker and Ohta, 2002) and various green micro-algae, including Chlorella pyrenoidosa (Czygan, 1964), Chlorococcum sp. strain MA-1 (Zhang and Lee, 2001), and Chlorella zofingiensis (Li et al., 2006), there is clear potential for employing D. natronolimnaea HS-1 to synthesize canthaxanthin. Table 5 shows a comparative study between microbial sources of canthaxanthin.
CONCLUSION
Enhancement of Canthaxanthin Production from Dietzianatronolimnaea HS-1 in a Fed-Batch Process 527
NOMENCLATURE
A474 the absorbance maximum of total carotenoid in
ethanol
1% 1 cm
A the specific absorption coefficient of total carotenoid for a 1% solution in a 1 cm cell ANOVA analysis of variance
Al Aluminum x1, ppm
B Boron x2, ppm
Co Cobalt x3, ppm
Cu Copper x4, ppm
Fe Iron x5, ppm
Mg Magnesium x6, ppm
Mn Manganese x7, ppm
Mo Molybdenum x8, ppm
Se Selenium x9, ppm
V Vanadium x10, ppm
Zn Zinc x11, ppm
HO● hydroxyl radical 1
O2 singlet oxygen Pr predicted response
PBD Plackett-Burman design g/L RSM response surface
methodology
r2adj adjusted determination coefficient
r2 the coefficient of determination
Vs the volume of sample solution
mL
xk the dimensionless coded value of the variable Xk
* k
X the value of the Xk at the center point
α0 the intercept term
αk the linear coefficients
αk, k the quadratic coefficients
αk, i the interaction coefficients
ΔXk the step change
REFERENCES
Aksu, Z., Eren, A. T., Carotenoids production by the yeast Rhodotorula mucilaginosa: Use of agricultural wastes as a carbon source, Process Biochem., 40, p. 2985 (2005).
Arad, S., Cohen, E., Ben Amotz, A., Accumulation of canthaxanthin in Chlorella emersonii. Physiol Plantarum., 87, p. 232 (1993).
Asker, D., Ohta, Y., Haloferaxalexandrinus sp. nov., an extremely halophilic canthaxanthin-producing archaeon from a solar saltern in Alexandria (Egypt). Int. J. Sys. Evol. Microbiol., 52, p. 729 (2002). Atamanyuk, D. I., Razumorskii, P. N., Effect of
ammonium perchlorate on carotene formation by
Rhodotorulagracilis K-1. Ser. Biol. Khim. Nauk., 1, p. 89 (1974).
Bailey, J. E., Ollis, D. F., Biochemical Engineering Fundamentals. McGraw-Hill Book Co., Singapore, pp. 983-985 (1986).
Bhosale, P., Environmental and cultural stimulants in the production of carotenoids from microorganisms. Appl. Microbiol. Biotechnol., 63, p. 351 (2004). Bhosale, P. B., Gadre, R. V., Production of
beta-carotene by a mutant of Rhodotorula glutinis. Appl. Microbiol. Biotechnol., 55, p. 423 (2001). Buzzini, P., Martini, A., Gaetani, M., Turchetti, B.,
Pagnoni, U. M., Davoli, P., Optimization of carotenoid production by Rhodotorula graminis
DBVPG 7021 as a function of trace element concentration by means of response surface analysis, Enzyme. Microb. Technol., 36, p. 687 (2005).
Cooney, J. J., Marks, H. W., Smith, A. M., Isolation and identification of canthaxanthin from
Micrococcusroseus. J. Bacteriol., 92, p. 342 (1966). Czygan, F. C., Canthaxanthin as a secondary
carotenoid in certain green algae. Experientia., 20, p. 573 (1964).
Daushvili, L. P., Elisashvili, V. I., Optimization of nutrient medium content for the biosynthesis of carotenoids of Mycobacterium rubrum 44 by mathematical experiment planning. Soobshcheniya Akademii. Nauk. Gruzinskoi SSR., 139, p. 589 (1990).
De Miguel, T., Sieiro, C., Poza, M., Villa, T. G., Isolation and taxonomic study of a new canthaxanthin-containing bacterium, Gordonia jacobaea MV-1 sp. nov, Int. Microbiol., 3, p. 107 (2000).
Duckworth, A. W., Grant, S., Grant, W. D., Jones, B. E., Meijer, D., Dietzia natronolimnaios sp, nov., a new member of the genus Dietzia isolated from an East African soda lake. Extremophiles., 2, p. 359 (1998).
Gammal, S. M., Rizk, M. I., Effect of cations, sodium chloride and sodium deoxycholate on lipase production by some yeasts. Egypt. J. Bot., 30, p. 1 (1989).
M. R. Nasri Nasrabadiand S. H. Razavi 528
Brazilian Journal of Chemical Engineering
Goodwin, T. W., Biosynthesis of carotenoids. In: Goodwin, T. W., (ed.). The Biochemistry of the Carotenoids, Chapman and Hall, London, UK, pp. 33-76. (1980).
Gribanovski-Sassu, O., Biosynthesis of keto-carotenoids in Dictyococcus cinnabarinus. Ann. Ist. Super. Sanita., 9, p. 225 (1973).
Haaland, P. D., Experimental Design in Biotechnology, Marcel Decker, NY, USA, pp. 64-70, (1989). Hannibal, L., Lorquin, J., D'Ortoli, N. A., Garcia, N.,
Chaintreuil, C., Masson-Boivin, C., Dreyfus, B., Giraud, E., Isolation and characterization of canthaxanthin biosynthesis genes from the photosynthetic bacterium Bradyrhizobium sp. strain ORS278.J. Bacteriol., 182, p. 3850 (2000). Harker, M., Tsavalos, A. J., Young, A. J., Use of
response surface methodology to optimise carotenogenesis in the microalga Haematococcus pluvialis. J. Appl. Phycol., 7, p. 399 (1995). Khodaiyan, F., Razavi, S. H., Mousavi, S. H.,
Optimization of canthaxanthin production by
Dietzia natronolimnaea HS-1 from cheese whey using statistical experimental methods. Biochem. Eng. J., 40, p. 415 (2008).
Khodaiyan, F., Razavi, S. H., Emam-Djomeh, Z., Mousavi, S. M., Hejazi, M.A., Effect of culture conditions on canthaxanthin production by
Dietzia natronolimnaea HS-1. J. Microbiol. Biotechnol., 17, p. 195 (2007).
Kobayashi, M. K., Toshihide, N.M., Nagai, S., Effects of light intensity, light quality, and illumination cycle on astaxanthin formation in a green alga, Haematococcus pluvialis. J. Ferment. Bioeng., 74, p. 61 (1992).
Komemushi, S., Sakaki, H., Yokoyama, H., Fujita, T., Effect of barium and other metals on the growth of a D-lactic acid assimilating yeast
Rhodotorulaglutinis No 21. J. Antibact. Antifung. Agt., 22, p. 583 (1994).
Li, H. B., Fan, K. W., Chen, F., Isolation and purification of canthaxanthin from the microalga
Chlorella zofingiensis by high-speed counter-current chromatography. J. Sep. Sci., 29, p. 699 (2006).
Liu, Y., Wu, J. Y., Optimization of cell growth and carotenoid production of Xanthophyllomyces dendrorhous through statistical experiment design. Biochem. Eng. J., 36, p. 182 (2007).
Mahattanatavee, K., Kulprecha, S., Production of β -carotene by Rhodotorula sp. Y1621. Microbial. Utiliz. Renew. Resources., 7, p. 295 (1991). Miller, G. L., Use of dinitrosalicylic acid reagent for
determination of reducing sugar. Anal Chem., 31, p. 426 (1959).
Myers, R. H., Montgomery, R. C., Response Surface Methodology: Process and Product Optimization Using Designed Experiments. 2nd ed. Wiley, NY, USA (2002).
Nelis, H. J., De Leenheer, A. P., Reinvestigation of
Brevibacterium sp. strain KY-4313 as a source of canthaxanthin. Appl. Environ. Microbiol., 55, p. 2505(1989).
Nelis, H. J., De Leenheer, A. P., Microbial sources of carotenoid pigments used in foods and feeds. J. Appl. Bacteriol., 70, p. 181 (1991).
Oddone, G. M., Lan, C. Q., Rawsthorne, H., Mills, D. A., Block, D. E., Optimization of fed-batch production of the model recombinant protein GFP in Lactococcuslactis. Biotechnol. Bioeng., 96, p. 1127 (2007).
Parekh, S., Vinci, V., Strobel, R. J., Improvement of microbial strains and fermentation processes. Appl. Microbiol. Biotechnol., 54, p. 287 (2000). Pelah, D., Sintov, A., Cohen, E., The Effect of salt
stress on the production of canthaxanthin and astaxanthin by Chlorella zofingiensis grown under limited light intensity. World J. Microbiol. Biotechnol., 20, p. 483 (2004).
Perera, C. O., Yen, G. M., Functional properties of carotenoids in human health. Int. J. Food Properties., 10, p. 201 (2007).
Rao, A. V., Rao, L. G., Carotenoids and human health. Pharmacol Res., 55, p. 207 (2007).
Razavi, S. H., The Effects of Different Conditions on the Production of Torularhodine by a New Isolated Strain of Sporobolomyces ruberrimus. Ph.D. Thesis, Institut National Polytechnique De Lorraine, France (2004).
Razavi, S. H., Fabrice, B., Marc, I., UV-HPLC/APCI-MS method for separation and identification of the carotenoids produced by
Sporobolomycesruberrimus H110. Iran. J. Chem. Chem. Eng. 25, p. 1 (2006).
Razavi, S. H., Mousavi, S. M., Yeganeh, H. M., Marc, I., Fatty acid and carotenoid production by
Sporobolomycesruberrimus when using technical glycerol and ammonium sulfate. J. Microbiol. Biotechnol., 17, p. 1591 (2007).
Sandmann, G., Carotenoid biosynthesis in microorganisms and plants. Eur. J. Biochem., 223, p. 7 (1994).
Sandmann, G., Carotenoid biosynthesis and biotechnological application. Arch. Biochem. Biophys., 385, p. 4 (2001).
Saperstein, S., Starr, M. P., The ketonic carotenoid canthaxanthin isolated from a colour mutant of
Enhancement of Canthaxanthin Production from Dietzianatronolimnaea HS-1 in a Fed-Batch Process 529
Schiedt, K., Liaaen-Jensen, S., Isolation and analysis. In: Britton, G., Liaaen-Jensen, S., Pfander, H., (eds.). Carotenoids, Isolation and Analysis. Birkhäuser Verlag, Basel, Switzerland, pp. 81-108 (1995).
Singh, B., Panesar, P. S., Nanda, V., Optimization of osmotic dehydration process of carrot cubes in sucrose solution. J. Food Process. Eng., 31, p. 1 (2008).
Soliman, N. A., Berekaa, M. M., Abdel-Fattah, Y. R., Polyglutamic acid (PGA) production by Bacillus sp. SAB-26: application of Plackett-Burman experimental design to evaluate culture requirements. Appl. Microbiol. Biotechnol., 69, p. 259 (2005). Tao, L., Yao, H., Cheng, Q., Genes from a Dietzia sp.
for synthesis of C40 and C50 beta-cyclic carotenoids. Gene., 386, p. 90 (2007).
Tjahjono, A. E., Hayama, Y., Kakizono, T., Terada, Y., Nishio, N., Nagai, S., Hyper-accumulation of astaxanthin in a green alga Haematococcus pluvialis at elevated temperatures. Biotechnol. Lett., 16, p. 133 (1994).
Vazquez, M., Santos, V., Parajo, J. C., Effect of the carbon source on the carotenoid profiles of
Phaffia rhodozyma strains. J. Ind. Microbiol. Biotechnol., 19, p. 263 (1997).
Veiga-Crespo, P., Blasco, L., Rosa-Dos-Santos, F., Poza, M., Villa, T. G., Influence of culture conditions of Gordonia jacobaea MV-26 on canthaxanthin production. Int. Microbiol., 8, p. 55 (2005).
Vohra, A., Satyanarayana, T., Statistical optimization of the medium components by response surface methodology to enhance phytase production by
Pichia anomala. Process Biochem., 37, p. 999 (2002).
Wang, Y., Xiao, Y., Ding, Y., Wang, Z., Effects of La3+, Ce3+ and Nd3+ on growth and carotenoids content of Phaffia rhodozyma. Weishengwuxue, Tongbao., 26, p. 117 (1999).
Zhang, D. H., Lee, Y. K., Two-step process for ketocarotenoid production by a green alga,