ISSN 0104-6632 Printed in Brazil
www.abeq.org.br/bjche
Vol. 27, No. 04, pp. 545 - 554, October - December, 2010
Brazilian Journal
of Chemical
Engineering
OZONE APPLICATION IN WATER SOURCES:
EFFECTS OF OPERATIONAL PARAMETERS AND
WATER QUALITY VARIABLES ON OZONE
RESIDUAL PROFILES AND DECAY RATES
F. A. Lage Filho
Brasil Ozonio at CIETEC/IPEN-USP, Energy Research Institute IPEN, Phone/Fax + (55) (11) 3039-8307, CIETEC Building, ground floor, suite 7,
Cidade Universitaria, CEP: 055800-900, Butantã, São Paulo - SP, Brazil. E-mail: [email protected]
(Submitted: June 15, 2010 ; Revised: August 17, 2010 ; Accepted: August 23, 2010)
Abstract - Systematic ozonation tests were conducted by means of a mobile pilot plant. Water source 1 was a low turbidity stream with very low solids content and very low turbidity, apparent color and alkalinity. Water source 2 was reservoir water with higher turbidity, solids content and alkalinity than source 1. The ozone plant was a counter-current contactor composed of four columns in series. Variations in contact time, in the feed gas concentration (in terms of percent by weight of ozone) and in splitting of the total applied ozone dosage between columns 1 and 2 were tested. Concentration – time (CT) products were calculated and decay coefficients K were estimated from experimental data. The relative importance of water quality and certain operational parameters with regard to CT products and ozone decay was assessed. Total CT values seemed to increase with: (a) total applied ozone dosage, (b) percent by weight of ozone in the feed gas to the bubble contactor, (c) increasing contact time and (d) higher water quality, with regard to turbidity, apparent color, total organic carbon and particle counts. As the total applied ozone dosage was increased, the more important the contact time and ozone dosage configuration became for the total CT value. The apparent first order ozone decay rate constant (K) decreased with increasing total applied ozone dosage. The contact time appeared to exert a much stronger influence on total CT values than on K values, particularly so as the total applied ozone dosage was increased.
Keywords: Bubble contactor; Ozone residual profiles; CT products; Ozone decay; Percent ozone by weight.
INTRODUCTION
Systematic ozonation tests were conducted with two raw water sources over a two-week period, one week for each source, by means of a mobile pilot plant. Source #1 was a water stream with very low solids content and very low turbidity, apparent color and alkalinity. Source #2 was water from a reservoir with higher turbidity and much higher solids content
OZONE APPLICATION IN WATER: A REVIEW
Ozonation Principles
A number of processes occur simultaneously during ozone treatment in a reactor or ozonation contactor. These processes are: convection and back mixing processes in the liquid and gas phases flowing through the contacting cells or columns, the ozone mass transfer process, the ozone auto-decomposition process and competitive reaction processes of dissolved ozone with the constituents present in the water (adapted from Zhou, Smith and Stanley, 1994). In addition to these processes, the contactor configuration, the operating conditions and the water quality will influence the overall performance of the ozonation treatment (Zhou, 1995). Zhou and Smith (2000) studied ozone transfer in water utilizing a bench scale bubble column by simultaneously measuring bubble size distribution and mixing intensity. They concluded that the specific surface area of gas bubbles was strongly dependent on the gas flow rate, due to the higher gas holdup in the contactor. Consequently, the mass transfer coefficient increased as the gas flow rate increased.
Where contaminants and microbes are concerned, ozone reacts in two ways: (1) by direct oxidation and (2) through the action of hydroxyl radicals (•OH) generated during its decomposition. The consensus is that the action of ozone as a disinfectant is primarily dependent on its direct reactions; hence, it is the residual ozone itself that is important (Crittenden et al., 2005). Because of its high reactivity, ozone application at sufficiently high doses and for an appropriate length of time is highly unlikely to leave true ozone-resistant organisms in the water, thus ensuring that this will be an efficient disinfectant over time. The oxidizing capacity of ozone has two key impacts on microbial water quality: (1) it inactivates microorganisms in the bulk water that are resistant to other disinfectants and (2) it may enhance the possibility of downstream microbial growth due to the conversion of recalcitrant organic matter to a more biologically utilizable form (Prévost et al., 2005). With regard to this drawback, efficient removal of biodegradable organic carbon from ozonated water can be achieved by adsorption and posterior decomposition by biological activity in activated carbon filters.
Fine Bubble Diffusers
For several decades, the most common approach to ozonation has been to combine two components - (1) a mass transfer device for dissolving the ozone in water and (2) a contact chamber in which the disinfection reaction takes place - by introducing the ozone into the water in large, deep basins using porous diffusers. Both mass transfer and the disinfection reactions then take place in these basins. Most often, these contact basins are simulated on a pilot scale using tall bubble columns with diffusers (Crittenden et al., 2005). Current practice for fine bubble diffusers is to use two or more countercurrent stages in series (WEF, 1996). After the contactor has begun operation, tracer studies should be conducted to establish the actual contact time versus the theoretical hydraulic retention time. Baffles are occasionally used to decrease short-circuiting. Water depths above the diffusers typically range from 4.88 to 6.10 m (WEF, 1996). Deeper contactors are used at higher elevations to account for reductions in ozone transfer efficiency with increased elevation. There are a variety of bubble diffusers (such as glass, fritted and ceramic) available for contactors. They should be evaluated based on their capacity to promote mass transfer and reduce the possibility of ozone decomposition. The smaller the bubble size, the larger the area/volume ratio; thus, a larger surface area is provided for ozone gas transfer into the liquid phase. The effect of fine bubbles is to increase the transport rate of ozone in the gas phase into the liquid phase. Langlais et al. (1991) presented a summary of gas-liquid contacting systems, pointing out general characteristics and associated advantages and disadvantages.
Ozone Decay
point from which an increase in ozone dosage resulted in increasing residual ozone. A pseudo first order ozone decay rate was verified. Oke et al. (1998) stated that the commonly used first order kinetics with a constant rate constant were unable to describe ozone decay behavior in cases where the initial ozone demand was significant. An explanation by the authors was that the water´s reactivity towards ozone changes substantially as the ozonation depletes the readily reactive compounds. According to Crittenden et al. (2005), the overall rate of ozone decay in water is generally consistent with first order kinetics, although the decay of ozone in some waters does not always follow this uniform first order decay model. However, although simple reactions serve as good phenomenological models for ozone decay, it is unlikely that they correctly characterize the actual mechanisms of decay (Crittenden et al., 2005). From work done in this area (Hermanowicz et al., 1999), it appears more likely that ozone decay consists of a large number of nth order reactions operating in parallel that, in sum, appear to be simple first order. Neumann et al. (2007) utilized sequencing batch reactors to investigate sources of parameter uncertainty in predicting preozonation performance during ozone application to lake water for disinfection and oxidation of micro-pollutants. They stated that the pseudo-first order rate constant of ozone decay was characterized as a time dependent parameter, with an apparent decrease with time of the rate constant.
The Concentration-Time (CT) Concept
The Environmental Protection Agency´s Enhanced Surface Water Treatment Rule (EPA, 1998) imposed stringent requirements for disinfection based on the CT concept. The Surface Water Treatment Rule specifies that the contact time T used in calculating CT values is T10, defined as the time it takes for 10% of a particular concentration to pass through a contact basin. EPA set rules related to reactor configuration to calculate a characteristic contact time to multiply an average concentration of disinfectant. The detention time T10 must be determined for each type of contactor by means of tracer tests. Those tests have been performed for various types of ozone contactors. For a classical bubble diffuser contactor, the ratio T10/Tc (where Tc = reactor volume divided by the design flow rate) is about
0.5 (Roustan et al., 1993). It is common practice to multiply the CT values obtained from ozone contactor profiling by a factor of 0.5. The Environmental Protection Agency has developed CT Tables that indicate what CT value is necessary for a certain level of pathogen inactivation credit. As an example, Table 1 depicts recommended CT values for viral and cyst inactivation by ozone (EPA, 2003). It shows the strong influence of water temperature on the required CT value. The lower the temperature, the lower ozone reactivity; thus, required CT values increase with decreasing water temperature.
Table 1: CT Values (mg x min/L) for log Inactivation by Ozone (EPA, 2003)
Water temperature (oC) ≤ 1 5 10 15 20 25
3-log (99.9%) inactivation
of Giardia cysts. 2.9 1.9 1.43 0.95 0.72 0.48
4-log (99.99%) inactivation
of viruses 1.8 1.2 1.0 0.6 0.5 0.3
MATERIALS AND METHODS
The ozone pilot plant was basically a counter-current contactor composed of four columns in series. Ozone concentration profiles in the columns were obtained for some arbitrary applied ozone dosages. Variations in contact time, in the feed gas concentration (in terms of percent by weight of ozone) and in splitting the total applied ozone dosage between columns 1 and 2 were tested. CT products were calculated and ozone decay rates K were estimated from the experimental data gathered. Figure 1 is a simplified scheme of the ozonation plant showing an option of feeding ozone into all four columns. The plant was composed of an air compressor, gas separation unit, ozone generation unit, four contact columns in series, feed gas and off-gas monitoring unit and ozone destruction unit. A steady air flow from the compressor fed the so-called gas separation unit, in which removal of dust, oil and moisture was accomplished followed by molecular-size separation of oxygen from air by molecular sieving. The resulting gas flow into the ozone generating unit was about 96% pure oxygen. Regarding the columns, each one was made of Plexiglas, with a 15 cm diameter and a 4.57 m height. At the bottom of each column, there was a bubble diffuser, with water entering each column from the top. Water flow rates tested were 27.57, 11.35 and 15.14 L/min; in this way, the effect of the contact time on the ozone residual profiles in the columns was assessed. A flow rate of 15.14 L/min corresponded to a total contact time of 20.6 minutes in the contactor, with 5.15 minutes per column. During the experimental runs, the total applied ozone dosage was either split between columns 1 and 2 or applied solely in column 1(the active columns). Columns 3 and 4 were always reaction columns, without ozone application. The ozone feed gas concentration (also termed purity of gas out of the generating unit) was set at 4.0% by weight (4% of ozone and 96% of oxygen) during testing, except for the investigation of the effects of ozone feed gas concentration, with tests run at 2.0, 4.0 and 5.5% by weight. The gas flow rate from the compressor into the gas separation unit was kept constant throughout testing. The changes in purity of the gas to feed the columns were obtained by changing the electrical current setting.
Ozone residual profiles in the columns: Each contact column or cell had eight sampling points, so
that the liquid phase ozone residual concentrations along each column could be monitored. A segmented analysis approach was used to calculate CT products from ozonation (CDM, 1994; CDM, 1995). The procedure, from setting up the water flow rate to the calculation of total CT products, was as follows:
(a) First of all, for a change in the water flow rate, the variation in the contact time was always taken into account, as well as the variation of the residual concentrations at the sampling points that took place with the variation of contact time.
(b) The residual ozone obtained for the sampling points in the columns were always determined at steady state conditions for water flow and the residuals themselves.
(c) For each liquid flow rate tested, the time intervals between successive sampling points in columns 1 through 4 of the contactor were established (since the column volume was known). Thus, the temporal position of each point as a function of the liquid flow rate was known.
(d) The plot of steady state residual ozone as a function of temporal position in the column series was carried out for each test. Next, an approximate segmented integration was performed as a function of contact time, established by the flow rate in the columns. So for each plot, the CT values for each column were obtained by calculating the area beneath the curves of C versus T and they were added to obtain the total CT value for the contactor.
(e) Thus, CT values were calculated from steady-state residual ozone in the columns (as per CDM, 1994; Crittenden et al., 2005) and then multiplied by a hydraulic efficiency factor to account for back mixing within each contact column.
Ozone Destruction Unit
Col. 4 Col. 3 Col. 2 Col. 1
Affluent water Exit
contactor
Generator Gas
Separation Unit
Air compressor Gas Monitor
(% by weight) Ozone Dosage
Control
Alarm
Pump Pump Pump Pump
Figure 1: Simplified schematics of the contact ozonator, showing the option of feeding ozone to all columns (not tested)
Ozone decay rate K: it was estimated for the reactive columns (without ozone application) for most of the experimental runs, assuming a first order decay rate, according to Crittenden et al. (2005), and K values (min-1) were calculated by Equation (1):
1 ci
K ln
Tf Ti cf
⎡ ⎤ ⎛ ⎞
=⎢ ⎥ ⎜ ⎟
−
⎣ ⎦ ⎝ ⎠ (1)
where
Ci, Cf = steady state ozone residuals at the beginning and at the end of profile in first reactive column of the contactor (mg/L).
Tf, Ti = time positions at the end and beginning of the ozone residual profile (min).
At each location of the mobile pilot plant, the water source of interest was pumped into a storage
hypochlorite solution, freshly prepared prior to each batch of tests and kept in an erlenmeyer flask with stopper in the dark in a refrigerator. The solution was re-standardized prior to each batch of sample collection. For most of the experimental runs, samples for metal (iron, manganese) and TOC analyses were sent to a regular lab. There, total iron and total manganese were determined according to Standard methods, 21st ed. (sections 3500-Fe,Mn), TOC was determined by means of a Model TOC V-CPH digester coupled with a computerized data logger.
RESULTS AND DISCUSSION
Table 2 shows average values of the water characteristics of the two water sources tested.
The data of Table 2 show that source 1 is of significantly better quality than source 2 with regard to solids content, particle number concentrations and organic matter. Furthermore, source 1 had a lower free chlorine demand than source 2. The water temperature was rather low for both sources during testing. It is known that temperatures below 15°C may impact the microbial inactivation power of ozone (CDM, 1995). Both sources presented negligible iron and manganese concentrations, which therefore did not exert significant ozone demand.
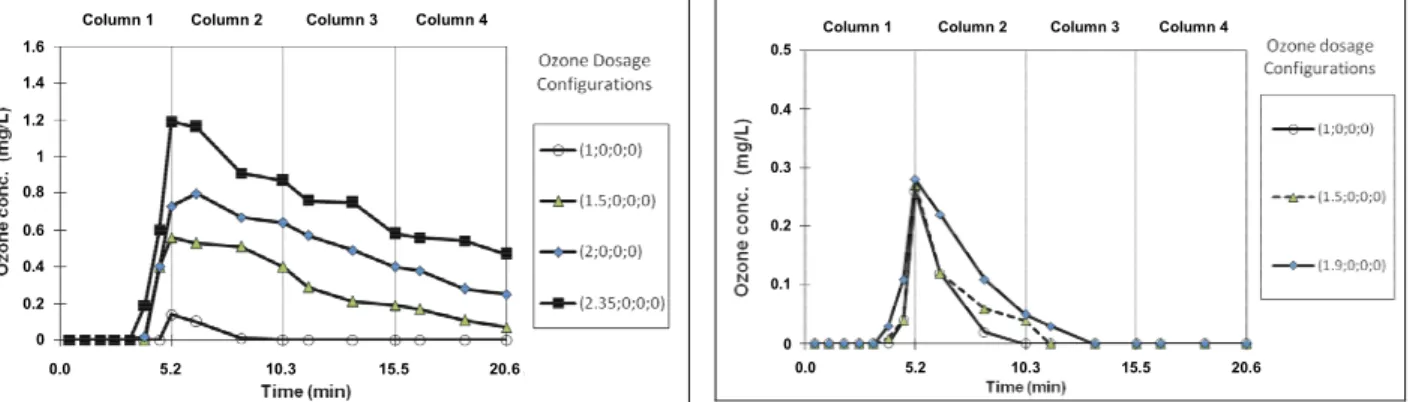
Figures 2 and 3 illustrate some residual ozone profiles in the ozone contactor obtained for sources 1 and 2, respectively, for selected ozone dosage configurations. Configurations refer to applied ozone dosage in each column. For instance, (1;0;0;0) means 1.0 mg/L applied in column 1, with columns 2 through 4 acting solely as reactive columns.
Table 2: Water quality during testing
Quality variable Source 1 Source 2 data points
pH 6.9 ± 0.5 7.9 ± 0.3 10
turbidity (NTU) 0.6 ± 0.2 1.5 ± 0.3 10
Apparent color (Pt-Co units) 17 ± 1 25 ± 2 10
temperature (oC) 12.5 ± 4.5 16.1 ± 4.0 10
alkalinity (mg CaCO3/L) 6.5 ± 1.0 110 ± 2 5
absorbance UV 254 nm (cm-1) 0.064 ± 0.008 0.116 ± 0.015 5
conductivity (μS/cm) 19 ± 3 329 ± 7 5
particle number concentration (# / mL),
size range 1-300 μm 3,750 ± 600 17,420 ± 1870 10
particle number concentration (# / mL),
size range 4 -10 μm 75 ± 15 480 ± 42 10
TOC (mg/L) 1.7 ± 0.2 4.9 ± 0.5 8
Total Iron (μg/L) 31 ± 10 27 ± 11 2
Total Manganese (μg/L) < 3 6 ± 1 2
2 hr - free chlorine demand (mg/L) (*) 0.4 ± 0.05 1.0 ± 0.2 8
(*) Initial free chlorine dose = 2.0 mg/L.
Column 1 Column 2 Column 3 Column 4
0.0 5.2 10.3 15.5 20.6 0
0.2 0.4 1
0.6 0.8 1.2 1.4 1.6
Column 1 Column 2 Column 3 Column 4 Column 1 Column 2 Column 3 Column 4
0.0 5.2 10.3 15.5 20.6 0.0 5.2 10.3 15.5 20.6 0
0.2 0.4 1
0.6 0.8 1.2 1.4 1.6
0 0.2 0.4 1
0.6 0.8 1.2 1.4 1.6
Column 1 Column 2 Column 3 Column 4
0.0 5.2 10.3 15.5 20.6 0
0.1 0.2 0.5
0.3 0.4
Column 1 Column 2 Column 3 Column 4 Column 1 Column 2 Column 3 Column 4
0.0 5.2 10.3 15.5 20.6 0.0 5.2 10.3 15.5 20.6 0
0.1 0.2 0.5
0.3 0.4
0 0.1 0.2 0.5
0.3 0.4
Figure 2: Residual ozone profiles, water source 1. Water flow rate = 15.14 L/min.
For the same ozone dosage configuration (total applied dosages of 1.5 and 1.9 mg/L), residual ozone profiles for source 1 were much higher than the corresponding profiles for source 2, except for the case with the lowest total applied dosage (1.0 mg/L). Experimental inaccuracies when conducting the indigo method might have produced “anomalous” results for relatively low dosages. For total applied dosages of 1.5 and 1.9 mg/L, Figures 2 and 3 suggest that the higher the applied ozone dosage, the slower was the drop in residual ozone concentration along the path of water flow (or contact time) in the reactive columns, regardless of the water source.
Effects of Contact Time on Total CT Values and Ozone Decay Rate
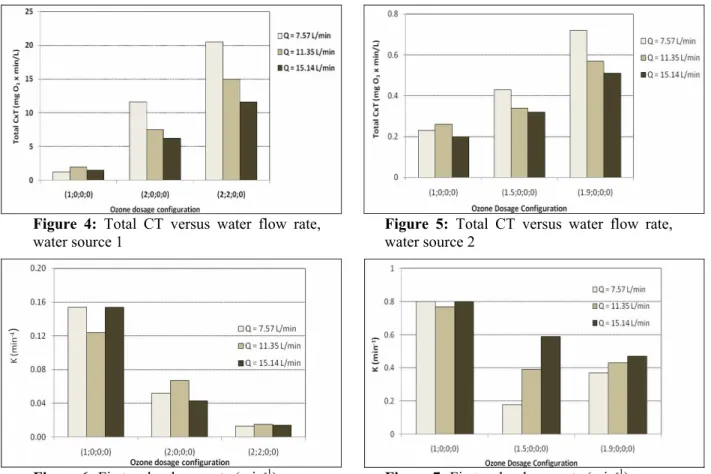
Figures 4 and 5 depict effects of water flow rate on the total CT values for selected ozone dosage configurations.
Figures 4 and 5 show that the total CT values obtained for water source 1 were much higher than the total CT values for water source 2, regardless of water flow rate. Source 1 must exert a much lower ozone demand than the lower quality source 2, due to
the latter´s much higher average values of TOC and particle number concentration. This fact implies lower residual ozone for source 2 as compared to source 1. Furthermore, from Figures 4 and 5 the higher the ozone dosage the greater the total CT value, regardless of water source.
Figures 6 and 7 depict effects of the flow rate representing the contact time on the first order ozone decay rate, for selected ozone dosage configurations.
As noted previously, source water quality affected ozone decay rates significantly. Decay rates were much higher for source 2, with significantly higher particle number concentrations and organic matter content (based on average TOC values) than source 1. Increasing the applied ozone dosages led to decreasing decay rates for water source 1, but a similar trend was not observed with water source 2, except at the highest flow rate tested (lowest contact time). Although source 2 had much higher alkalinity (acting as a reaction inhibitor, thus contributing to decreased ozone decomposition rates) than source 1, the effects of particle counts and TOC concentrations on increasing ozone decay rates were stronger than the effects of alkalinity.
Figure 4: Total CT versus water flow rate, water source 1
Figure 5: Total CT versus water flow rate, water source 2
Figure 6: First order decay rate (min-1) versus water flow rate, water source 1
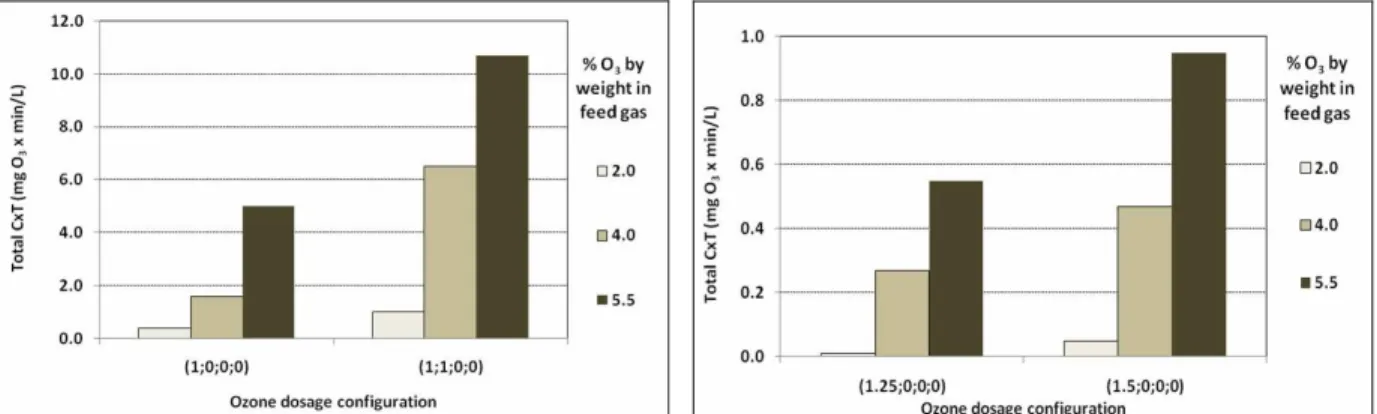
Effects of the Percent by Weight of Ozone in the Feed Gas on Total CT Values
Figures 8 and 9 show how total CT values varied with the percent by weight of applied ozone gas and ozone dosage configuration for water sources 1 and 2, respectively.
Regardless of water source and applied ozone dosage configuration in the columns, the higher the percent by weight of ozone in the feed gas, the higher the total CT values obtained. Again, the better quality water source 1 had much higher total CT values than source 2. In addition, the higher the applied ozone dosage, the higher the total CT value. These findings were supported by the results of the studies by CDM (1994; 1995).
Effects of Ozone Dosage Splitting Between Active Columns on Total CT Values
Figures 10 and 11 depict how splitting the total ozone dosage between columns 1 and 2 of the contactor changed the total CT values for sources 1 and 2.
The influence of dosage splitting on total CT values did not seem to be as strong as the influences of percent by weight of ozone gas and total ozone dosage. Apparently the higher the total applied ozone dosage, the more important it was for the total CT value to maximize the fraction of the total ozone dosage applied in the first column of the contactor. This finding is supported by the results obtained by Lage Filho and Ferreira Filho (1999) with settled water from a conventional water treatment plant.
Figure 8: Total CT versus percent by weight of ozone, water source 1.
Water flow rate = 15.14 L/min.
Figure 9: Total CT versus percent by weight of ozone, water source 2.
Water flow rate = 15.14 L/min.
Figure 10: Total CT values versus ozone dosage configuration and split factors, water source 1.
Water flow rate = 15.14 L/min.
Figure 11: Total CT values versus ozone dosage configuration and split factors, water source 2.
CONCLUSIONS
Total CT values from steady state residual ozone in the liquid phase increased with: (a) total applied ozone dosage, (b) percent by weight of ozone in the feed gas to the bubble contactor and (c) higher water quality regarding turbidity, apparent color, TOC and particle counts. As the total applied ozone dosage was increased, the more important the contact time and ozone dosage configuration became for the total CT value. The contact time appeared to exert a much stronger influence on total CT values than on the ozone decay constant (K), particularly as the total applied ozone dosage increased.
The apparent first order ozone decay rate constant (K) decreased with increasing total applied ozone dosage. No clear trend was observed for either water source regarding effects of the contact time on K. The importance of the splitting factors in dividing the total applied ozone dose into two columns of the contactor seemed to increase with increasing total ozone dosage.
NOMENCLATURE
Cf, Ci Residual ozone at the beginning and at the end of the ozone residual profile at steady-state in the last reactive column of the contactor
mg/L
K Liquid phase ozone decay coefficient
min -1
O3 Ozone
pH negative log10 of the hydrogen ion concentration T10 Characteristic contact time;
the time it takes for 10% of a particular concentration to pass through a contact basin
min
Tc Residence time = reactor volume/flow rate in ozonator
min
Tf, Ti Time position at the end and beginning of the ozone residual profile considered
min
TOC Total Organic Carbon mg/L
REFERENCES
APHA/AWWA/WEF, Standard Methods for the Examination of Water and Wastewater. 20th Ed. (1999).
Carlson, M., The Effect of Organic Carbon on Ozone Demand and Decay. In: Proceedings, AWWA Annual Conference on Water Quality Technology, p. 321-342 (1993).
CDM (Camp, Dresser & McKee Inc.), Hetch Hetchy Source: Treatability Report, Water Quality Planning Study. Final Report to the San Francisco Water Department (1994).
CDM (Camp, Dresser & McKee Inc.), Water Quality Planning Study, Task 16 – Sunol Treatability Report (1995).
Crittenden, J.C., Trussell, R. R., Hand, D. W., Howe, K. J., Tchobanoglous, G., (Editors), Water Treatment: Principles and Design. Second Edition, John Wiley & Sons (2005).
EPA (Environmental Protection Agency), Final Enhanced Surface Water Treatment Rule (1998). EPA (Environmental Protection Agency), Guidance
Manual LT1ESWTR Disinfection Profiling and Benchmarking (2003).
Hermanowicz, S. W., Bellamy, W. D., Fung, L. C., Variability of Ozone Reaction Kinetics in Batch and Continuous Flow Reactors. Water Research, 33, 2130-2138 (1999).
Hoigné, J., Bader, H.,Rate Constants of Reactions of Ozone with Organic and Inorganic Compounds in Water - I: Non-Dissociating Organic Compounds. Water Research, 17, 173 -183 (1983).
Lage Filho, F. A., Ferreira Filho, S. S., Significance of Ozone Dosage Configuration and Total Organic Carbon Removal in Contact Ozonation Systems. In: Proceedings of the 20th Brazilian Congress on Sanitary and Environmental Eng., Foz do Iguaçu, PR, Brazil (1999).
Lage Filho, F. A., Ozonation of Raw Water: a Discussion on Design Parameters. LEE Engineering Enterprises Inc., not published (1994).
Langlais, B., Reckhow, D., Brink, D. R., (Editors), Ozone in Water Treatment: Application and Engineering. Cooperative Research Report, A.W.W.A. Research Foundation and Compagnie Générale des Eaux. Lewis Publishers (1991).
Treatment Performance: The Case of Preozonation in Drinking Water Engineering. Water Research, vol. 41: 2371-2378 (2007). Oke, N. J., Smith, D. W., Zhou, H., An Empirical
Analysis of Ozone Decay Kinetics in Natural Waters. Ozone Sci. & Eng. 20, 361-379 (1998). Prévost, M., Laurent, P., Servais, P., Joret, J. C.,
(Editors), Biodegradable Organic Matter in Drinking Water Treatment and Distribution. AWWA Research Foundation (2005).
Roustan, M., Beck, C., Wable, O., Diguet, J. P., Mallevialle, J., Modeling Hydraulics of ozone Contactors. Ozone Sci. & Eng. 15: 213-226 (1993). WEF (Water Environment Federation), Wastewater
Disinfection: Manual of Practice FD-10 (1996). Yurteri, C., Gurol, M. D., Ozone Consumption in
Natural Waters: Effects of Background Organic Matter, pH and Carbonate Species. Ozone Sci. & Eng. 10, 277-290 (1988).
Zhou, H., Investigation of Ozone Disinfection Kinetics and Contactor Performance Modeling. PHD Thesis, Univ. of Alberta. Edmonton, Alberta, Canada (1995).
Zhou, H., Smith, D. W., Ozone Mass Transfer in Water and Wastewater Treatment: Experimental Observations Using a 2D Laser Particle Dynamics Analyzer. Water Research 34: 909-921 (2000).