ISSN 0104-6632 Printed in Brazil
www.abeq.org.br/bjche
Vol. 28, No. 03, pp. 393 - 402, July - September, 2011
Brazilian Journal
of Chemical
Engineering
PHOTOCATALYTIC DISCOLORATION OF
REACTIVE BLUE 5G DYE IN THE PRESENCE OF
MIXED OXIDES AND WITH THE ADDITION OF
IRON AND SILVER
M. C. P. Souza
1, G. G Lenzi
1*, L. M. S. Colpini
2, L. M. M. Jorge
1and O. A. A. Santos
11
Universidade Estadual de Maringá, Departamento de Engenharia Química, Phone: + (55) (44) 3011-4770, Fax: + (55) (44) 3011-4792, Av. Colombo 5790, CEP: 87020-900, Maringá - PR, Brazil.
E-mail: [email protected]
2
Universidade Federal do Paraná, Campus Palotina,
Curso Superior de Tecnologia em Biocombustíveis, Rua Pioneiro 2153, Jardim Dallas, CEP: 85950-000, Palotina - PR, Brazil.
(Submitted: December 12, 2010 ; Revised: May 18, 2011 ; Accepted: May 18, 2011)
Abstract - This work reports the use of cerium-titania-alumina-based systems modified with Ag and Fe by the wetness impregnation method for the discoloration of blue 5G dye. The techniques employed to characterize the photocatalysts were: temperature-programmed reduction (TPR), X-ray diffraction (XRD), specific surface area, average pore volume, and average pore diameter. The characterization results indicated that the photocatalysts had different crystalline structures and textural properties. Discoloration with the mixed oxide photocatalyst CeO2-TiO2-Al2O3 gave a result similar to that of TiO2. On the other hand, the addition of Ag and Fe to the mixed
oxide increased the discoloration and reaction rates of reactive blue 5G dyes.
Keywords: CeO2-TiO2-Al2O3 mixed oxides; Discoloration; Fe-CeO2-TiO2-Al2O3; Ag-CeO2-TiO2-Al2O3;
Reactive blue 5G dye; Characterization.
INTRODUCTION
Textile dyes and other industrial dyes are crucial organic compounds that cause an increase in environmental damage. From about 1% to 20% of the world’s dye production is wasted during the dyeing processes and released in textile effluents (Konstantinou and Albanis, 2004; Zollinger, 1991; Weber and Stickney, 1993; Ràfols and Barceló, 1997; Houas et al., 2001). Dyes make up an abundant class of organic compounds characterized by the presence of unsaturated groups (chromophores), such as –C═C–, –N═N– and –C≡N–, which are responsible for the dye colors, and functional groups responsible for their fixation to fibers, as for example
–NH2, –OH, –COOH and –SO3H (Molinari et. al., 2004). Due to the environmental impact of dye-containing effluents, new technologies have been researched for their degradation, such as heterogeneous photocatalysis, which belongs to the category of advanced oxidation processes (AOP) (Özkan et al., 2004; Colpini et al.,2008; Pelegrini
et al., 1999; Peralta-Zamora et al., 2003). Titania
394 M. C. P. Souza, G. G Lenzi, L. M. S. Colpini, L. M. M. Jorge, O. A. A. Santos
Brazilian Journal of Chemical Engineering
Thus, recent studies have focused on the modification of TiO2 (Yan et al., 2006). In order to investigate this further, mixed oxide
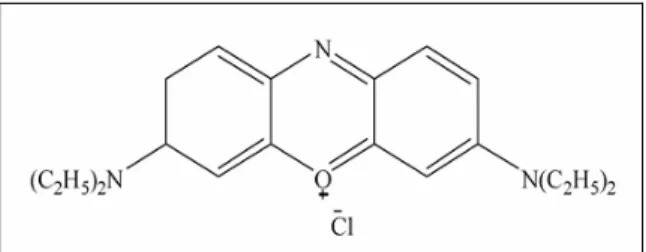
(CeO2-TiO2-γAl2O) modified with Ag and Fe was prepared and characterized for the discoloration of blue 5G dye (Figure 1).
Figure 1: Structure of Maxilon Blue 5G.
EXPERIMENTAL
Chemicals
The following chemicals were used as received for the catalyst preparation: i) aluminum oxide Al2O3 (supplied by Aldrich Sigma with over 99.9% purity); ii) titanium dioxide TiO2 (supplied by Aldrich with over 99.9% purity) used as a catalyst precursor; iii) cerium CeO2 IV (supplied by Acros Organics with over 99.9%); iv) iron(II) sulfate heptahydrate FeSO4.7H2O (supplied by Synth with over 99.9% purity); v) silver nitrate AgNO3 (supplied by Synth with over 99.9% purity).
Catalyst Preparation
To prepare the catalysts 8.8% Ag/CeO2-TiO2-Al2O3 and 8.6% Fe/CeO2-TiO2-Ag/CeO2-TiO2-Al2O3 by successive impregnation, the following methodology was used:
After calcining 5x10⁻³ kg of γ-alumina at 473.15 K for 7200s under a static air atmosphere, it was wetted with distilled water (5x10⁻⁶ m3) at room temperature and titanium dioxide (5x10⁻³ kg) was added. The solution was stirred at room temperature for 43200 s for complete homogenization. It was then dried in an oven at 373.15 K for 43200 s and calcined at 473.15 K for 10800s under a static air atmosphere. The same procedure was used for cerium oxide (5x10⁻³ kg). To the resulting sample, 7x10⁻⁶ m3 of distilled water and the metallic precursor were added (for the 8.8% Ag/CeO2-TiO2-Al2O3 catalyst, 2.5x10⁻³ kg AgNO3 was added and for 8.6% Fe/CeO2-TiO2-Al2O3 catalyst, 5x10⁻³ kg FeSO4.7H2O was added) and then stirred at room temperature for 43200 s. Finally, the catalyst was dried in an oven at 373.15 K for 43200 s and calcined at 473.15 K and 623.15 K for 10800 s
under a static air atmosphere. For more details, see Souza (2009).
Characterization
The characterization techniques used in this study were specific surface area, average pore diameter, pore volume, temperature programmed reduction, thermogravimetric analysis, and X-ray diffraction.
Pore Properties (B.E.T. Method)
The pore properties, such as specific surface area, average pore diameter, and pore volume, were determined with a QUANTACHROME Analyzer – Model Nova-1200, using N2 adsorption at 77 K. These analyses were carried out for calcined and non-calcined samples. Before analysis, the samples were submitted to thermal treatment at 573 K under vacuum for 7200 s to eliminate any water existing within the pores of the solids.
Temperature Programmed Reduction (TPR)
The measurements were conducted in a home-built TPR apparatus using a quartz tube packed with the catalyst sample inside. The samples (65x10-6 kg) were heated from room temperature to 1273.15 K at a heating rate of 4.72 K/s in a 1.75% H2/98.25% Ar gas flow at the rate of 5.0x10⁻⁷ m3/s. The thermocouple was located in the central position of the bed and the results were obtained from the hydrogen consumption, which was recorded by a thermal conductivity detector.
X-Ray Diffraction
The samples were measured in a Rigaku-Denki Diffractometer with Cu-Kα radiation ( = 1.5406 Å)
at a voltage of 140 V and a current of 40 mA. The patterns obtained were then compared with the diffraction dataset cards from the Joint Committee of Powder Diffraction Standards (JCPDS, 1997).
Photocatalytic Reaction
Photocatalysis
suspension at 8.3x10⁻⁹ m3.s-1. A 125 W medium pressure mercury lamp, surrounded by a quartz thimble, was used for irradiation. In order to maintain room temperature, the vessel was surrounded by a jacket in which cold water flows. The reactor had a magnetic stirrer to ensure the homogeneity of the reaction mixture. At regular intervals, an aliquot of the suspension was withdrawn and filtered through a 0.45 m Millipore filter. The discoloration of the solutions as a function of time was determined with a Shimadzu UV-1203 UV/Vis spectrophotometer. The color was the main parameter analyzed.
Adsorption Behavior of Dyes and Photolysis
The adsorption tests were accomplished in the same system, but in the dark, according to Kansal
et al. (2007). Experiments without a photocatalyst
(i.e., photolysis only) were also carried out (Rezaee
et al.,2008).
EXPERIMENTAL RESULTS
Table 1 shows the specific surface areas of TiO2, CeO2, Al2O3 and CeO2-TiO2-Al2O3, as well as of the Ag- and Fe-doped catalysts before and after calcination (473.15 and 623.15 K), respectively. The results of specific volume andmean diameter of pores of TiO2, CeO2, Al2O3, CeO2-TiO2-Al2O3 and of the Ag- and Fe-doped catalysts before and after calcinations at 473.15 K and at 623.15 K (Table 2) are presented. Figures 2, 3 and 4 show the XRD profiles for CeO2 -TiO2-Al2O3, Fe/CeO2-TiO2-Al2O3 and Ag/CeO2-TiO2-Al2O3,respectively. Figures 5 and 6 show the temperature-programmed reduction profiles for CeO2, TiO2, Al2O3, CeO2-TiO2-Al2O3, Ag/CeO2-TiO2-Al2O3 and Fe/CeO2-TiO2-Al2O3 calcined at 473.15 K and 623.15 K, respectively. Figures 7, 8 and 9 show the results for the adsorption of reactive blue 5G dye on the catalyst using CeO2-TiO2-Al2O3, Ag/CeO2-TiO2-Al2O3 and Fe/CeO2-TiO2-Al2O3 photocatalysts, non-calcined and calcined at 473.15 K and 623.15 K, respectively. Figures 10, 11 and 12 show the discoloration of reactive blue 5G dyes with the photocatalyst, non-calcined and calcined at 473.15 K and at 623.15 K, respectively.
DISCUSSION
The results (Table 1) indicate that the specific surface area of non-calcined materials follows the sequence Al2O3 > CeO2 > TiO2. When these three
oxides are combined, the specific surface area is 8.0x10³ m2/kg, which is the same as that observed for CeO2. With the addition of Ag, the surface area decreased, possibly due to pore blocking by the metal.
The surface area obtained for the catalyst containing Fe (4.7x10³ m2/kg) is smaller than for Ag (5.3x10³ m2/kg).
When the sample was calcined at 473.15 K, TiO2 presented an increase in specific surface area and external surface area, as compared with the non-calcined samples. For Al2O3 and Fe/CeO2-TiO2-Al2O3, this difference is of the same order of magnitude as the experimental error. On the other hand, a decrease in the micropore surface area occurs. This is possibly due to the removal of volatile contaminants (Lenzi et al., 2008), which favors an increase in the surface area, provoking sinterization of the catalyst particles and decreasing the micropore surface area.
For CeO2 and Ag/CeO2-TiO2-Al2O3, the specific surface area, external surface area and microspore area decreased, suggesting that some micropores form larger pores and contribute to the decrease in the specific surface area.
For the CeO2-TiO2-Al2O3 catalyst, a decrease in the specific surface area and external surface area occurs. However, the micropore surface area increased due to the crystalline structure change produced by the thermal treatment. The results indicated a change in the specific surface after the thermal treatment (calcinations at 623.15 K). Compared with the non-calcined photocatalyst, TiO2 and Al2O3 presented an increase in the specific surface area and specific external area. However, the specific micropore area decreased due to the removal of volatile contaminants. For the Fe/CeO2-TiO2-Al2O3 photocatalyst, the specific surface area, external surface area, and micropore surface area were not significantly altered.
For CeO2, CeO2-TiO2-Al2O3 and Ag/CeO2-TiO2-Al2O3, the specific surface area and specific external area decreased, and an increase in the micropore surface area occurred due to the crystalline structure change resulting from the thermal treatment.
396 M. C. P. Souza, G. G Lenzi, L. M. S. Colpini, L. M. M. Jorge, O. A. A. Santos
Brazilian Journal of Chemical Engineering
Table 1: Specific surface area of TiO2, CeO2, Al2O3, CeO2-TiO2-Al2O3, Ag/CeO2-TiO2-Al2O3 and Fe/CeO2
-TiO2-Al2O3- non-calcined, calcined at 473.15 K, calcined at 623.15 K.
Total pore volume (m3/kg)
Micropore volume (m3/kg)
Micropore surface area (m2/kg) (103) Material
non- calcined
473.15 K
623.15 K
non- calcined
473.15 K
623.15 K
non- calcined
473.15 K
623.15 K
TiO2 5.4 10.5 12.0 0.5 7.5 8.0 4.9 3.0 4.0
CeO2 8.0 3.0 6.0 6.0 2.6 3.5 2.0 0.4 2.5
Al2O3 9.0 9.1 10.0 4.5 5.7 6.0 4.5 3.4 4.0
CeO2-TiO2-Al2O3 8.0 6.2 6.0 5.7 2.6 3.4 2.3 3.6 2.5
Ag/CeO2-TiO2-Al2O3 5.3 4.1 4.0 3.5 2.5 2.0 1.8 1.6 2.0
Fe/CeO2-TiO2-Al2O3 4.7 4.8 4.8 3.1 3.4 3.2 1.6 1.4 1.6
Table 2: Specific volume and mean pore diameter of TiO2, CeO2, Al2O3, CeO2-TiO2-Al2O3, Ag/CeO2-TiO2
-Al2O3 and Fe/CeO2-TiO2-Al2O3- non-calcined, calcined at 473.15 K, calcined at 623.15 K.
Material Total pore volume
(m3/kg)
Micropore volume (m3/kg)
Mesopore volume (m3/kg)
Mean pore diameter (Å) non-
calcined 473.15
K
623.15 K
non- calcined
473.15 K
623.15 K
non- calcined
473.15 K
623.15 K
non- calcined
473.15 K
623.15 K
TiO2 3.5 14.3 16.0 2.6 1.8 2.1 1.0 12.5 13.7 25 50 49
CeO2 11.0 5.8 7.4 1.0 1.0 1.3 10.0 4.8 6.0 23 53 25
Al2O3 10.5 11.5 12.8 2.5 1.8 2.3 8.0 9.7 10.5 42 45 48
CeO2-TiO2-Al2O3 10.2 7.0 7.3 1.2 2.0 1.3 10.0 5.0 6.0 51 37 50
Ag/CeO2-TiO2-Al2O3 7.0 5.5 4.6 1.0 0.9 1.1 6.0 4.5 3.5 47 48 44
Fe/CeO2-TiO2-Al2O3 6.7 6.7 6.6 0.7 0.7 0.7 6.0 6.0 5.9 49 51 51
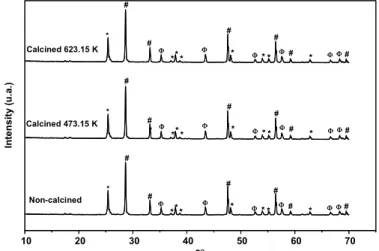
The XRD patterns of the photocatalyst CeO2-TiO2-Al2O3 (Fig. 2), non-calcined and calcined (473.15 and 623.15 K), indicated the formation of TiO2 anatase, CeO2 cerium oxide, and Al2O3 corundum. The thermal treatment did not modify the structure of the mixed oxides. The addition of Fe did not alter the crystalline structure of the material (Fig. 3). However, when Ag was added, there appeared four small peaks (Fig. 4) which were attributed to AgNO3, which is possibly due to residual Ag precursor impregnated in the sample. The XRD results in general indicate essentially crystalline phases for the original Ce, Ti and Al oxides.
The temperature-programmed reduction (TPR) profile obtained for TiO2 (Fig. 5b) and Al2O3 (Fig. 5c) did not show hydrogen consumption or reduction in the peaks. For CeO2 (Fig. 5a), one peak occurred
10 20 30 40 50 60 70 In te ns it y ( u .a. ) # * Calcined 623.15K Calcined 473.15K Non-calcined # # # 2θ * Φ ***
Φ * Φ
* * Φ# * Φ Φ#
# * # # # Φ ***
Φ * Φ
* * Φ# * Φ Φ#
# * # # # Φ ***
Φ * Φ
* * Φ# * Φ Φ#
Calcined 623.15 K
Calcined 473.15 K
Non-calcined
2
10 20 30 40 50 60 70
In te ns it y (u.a .) θ
10 20 30 40 50 60 70
In te ns it y ( u .a. ) # * Calcined 623.15K Calcined 473.15K Non-calcined # # # 2θ * Φ ***
Φ * Φ
* * Φ# * Φ Φ#
# * # # # Φ ***
Φ * Φ
* * Φ# * Φ Φ#
# * # # # Φ ***
Φ * Φ
* * Φ# * Φ Φ#
Calcined 623.15 K
Calcined 473.15 K
Non-calcined
2
10 20 30 40 50 60 70
In te ns it y (u.a .) θ
Calcined 623.15 K
Calcined 473.15 K
Non-calcined
2
10 20 30 40 50 60 70
In te ns it y (u.a .) θ
Figure 2: XRD pattern of the CeO2-TiO2-Al2O3 samples, where: (*) TiO2 anatase (JCPDS 21-1272), (#) CeO2 cerium oxide (JCPDS 78-0694) and (Φ) Al2O3 corundum (JCPDS 74-1081).
10 20 30 40 50 60 70
In ten s ity ( u .a .) # * Calcined 623.15K Calcined 473.15K Non-calcined # # # 2θ * Φ ***
Φ * Φ
* * Φ# * Φ Φ#
# * # # # Φ ***
Φ * Φ
* * Φ# * Φ Φ#
# * # # # Φ *** Φ *
Φ* * Φ#
* Φ Φ#
Calcined 623.15 K
Calcined 473.15 K
Non-calcined
2
10 20 30 40 50 60 70
In te n s ity (u .a .) θ
10 20 30 40 50 60 70
In ten s ity ( u .a .) # * Calcined 623.15K Calcined 473.15K Non-calcined # # # 2θ * Φ ***
Φ * Φ
* * Φ# * Φ Φ#
# * # # # Φ ***
Φ * Φ
* * Φ# * Φ Φ#
# * # # # Φ *** Φ *
Φ* * Φ#
* Φ Φ#
Calcined 623.15 K
Calcined 473.15 K
Non-calcined
2
10 20 30 40 50 60 70
In te n s ity (u .a .) θ
Calcined 623.15 K
Calcined 473.15 K
Non-calcined
2
10 20 30 40 50 60 70
In te n s ity (u .a .) θ
Figure 3: XRD pattern of the Fe/CeO2-TiO2-Al2O3 samples, where: (*) TiO2 anatase (JCPDS 21-1272), (#) CeO2 cerium oxide (JCPDS 78-0694) and (Φ) Al2O3 corundum (JCPDS 74-1081).
10 20 30 40 50 60 70
υ Ω δ
ς 0
Calcined 623.15 K
Calcined 473.15 K
Non-calcined In te nsit y (u .a.) 2θ # * # # # Φ
** Φ * Φ* * Φ# * Φ Φ#
#
* # #
#
Φ
** Φ * Φ* * Φ# * Φ Φ#
#
* # #
#
Φ
** Φ * Φ* * Φ# * Φ Φ#
398 M. C. P. Souza, G. G Lenzi, L. M. S. Colpini, L. M. M. Jorge, O. A. A. Santos
Brazilian Journal of Chemical Engineering
300 400 500 600 700 800 900 1000 1100 1200 1300
(f)
(e)
(d)
(c)
(b)
(a)
H
y
dr
ogen up
ta
ke
(a.u.
)
Temperature (°C)
Figure 5: TPR for catalysts calcined at 473.15 K, where: (a) CeO2, (b) TiO2, (c) Al2O3, (d) CeO2-TiO2-Al2O3, (e) Ag/CeO2-TiO2-Al2O3 and (f) Fe/CeO2-TiO2-Al2O3.
300 400 500 600 700 800 900 1000 1100 1200 1300
(f)
(e)
(d)
(c)
(b)
(a)
Hydrogen u
p
take (a.u.)
Temperature (K)
Figure 6: TPR for catalysts calcined at 623.15 K, where: (a) CeO2, (b) TiO2, (c) Al2O3, (d) CeO2-TiO2-Al2O3, (e) Ag/CeO2-TiO2-Al2O3 and (f) Fe/CeO2-TiO2-Al2O3.
The TPR profiles of CeO2, TiO2, Al2O3 and the CeO2-TiO2-Al2O3 photocatalyst calcined at 623.15 K (Fig. 6) were similar to those of the materials calcined at 473.15 K. However, the profiles for Ag/CeO2-TiO2-Al2O3 and Fe/CeO2-TiO2-Al2O3 show broader peaks, indicating that this may be the result of a larger dispersion of these metals on the catalyst surface (Kansal et al., 2007). For the photocatalyst Ag/CeO2-TiO2-Al2O3, the reduction Ag+→Ag0 occurs.
The analysis of the adsorption tests (Fig. 7, 8 and 9) indicates that the presence of Fe favors greater discoloration and that its effect becomes more efficient as the calcination temperature increases,
with the largest adsorption being observed for the photocatalyst calcined at 623.15 K.
The CeO2-TiO2-Al2O3 mixed-oxide photocatalysts calcined at 473.15 and 623.15 K had similar structures and surface areas. However, the photocatalyst calcined at 473.15 K presented a larger adsorption of reactive blue 5G dye due to its larger micropore surface area of 3.6x10³ m2/kg as compared to 2.5x10³ m2/kg when calcined at 623.15 K.
0 500 1000 1500 2000 2500 3000 3500 0
5 10 15 20 25 30 35 40 45 50 55 60 65 70 75
CeO2-TiO2-Al2O3 Ag/CeO2-TiO2-Al2O3
Fe/CeO2-TiO2-Al2O3 Al2O3
CeO2 TiO2
Co
ncentrati
on (ppm
)
Time (min)
Figure 7: Adsorption of reactive blue 5G dye on non-calcined photocatalysts.
0 500 1000 1500 2000 2500 3000 3500
0 5 10 15 20 25 30 35 40 45 50 55 60 65 70 75
TiO2
CeO2-TiO2-Al2O3
Fe/CeO2-TiO2-Al2O3
CeO2
Al2O3
Ag/CeO2-TiO2-Al2O3
Co
ncen
trati
o
n (pp
m
)
Time (min)
Figure 8: Adsorption of reactive blue 5G dye on photocatalyst calcined at 473.15 K.
0 500 1000 1500 2000 2500 3000 3500
0 5 10 15 20 25 30 35 40 45 50 55 60 65 70 75
Fe/CeO2-TiO2-Al2O3
8,8% Ag/CeO2-TiO2-Al2O3
CeO2-TiO2-Al2O3
Al2O3
TiO2
CeO2
Co
ncent
rat
ion (
ppm
)
Time (min)
400 M. C. P. Souza, G. G Lenzi, L. M. S. Colpini, L. M. M. Jorge, O. A. A. Santos
Brazilian Journal of Chemical Engineering
The result for the photolysis test without a catalyst indicated a discoloration of the reactive blue 5G dye solution of around 8.57% in 3600 s.
The discoloration occurs quickly under these conditions for the photocatalyzed reactions, as observed in Figs. 10, 11 and 12, except for Al2O3 and CeO2. However, the discoloration times were different. This can be observed from the values inside the figures, which show the results of the kinetic study of the disappearance of the dyes for an initial concentration of 70 kg/m3. The values show that the photocatalytic discoloration of dyes in an aqueous solution can be described by a first order kinetic model, ln(C0/C) = kt, where C0 is the initial concentration and C is the concentration at any t time.
The results for the non-calcined photocatalyst (Fig. 10) were better for Fe/CeO2-TiO2-Al2O3 and TiO2, which discolored 100% of the solution with 70 ppm of reactive blue 5G dye. The time for total discoloration (100%) was shorter for Fe/CeO2-TiO2-Al2O3 (30 min). CeO2, Fe/CeO2-TiO2-Al2O3, CeO2-TiO2-Al2O3 and Ag/CeO2-TiO2-Al2O3 produced 7.8%, 21.8%, 95.5% and 99.7% discoloration, respectively.
Figure 11 shows that the photocatalyst calcined at 473.15 K produced 100% discoloration of reactive blue 5G dye in this order: Fe/CeO2-TiO2-Al2O3 > Ag/CeO2-TiO2-Al2O3 > TiO2. The reaction rate was different for each catalyst, and the shortest discoloration time was obtained for Fe/CeO2-TiO2-Al2O3 with an apparent catalyst rate constant of 3.5x10⁻³ s-1. The CeO2, Al2O3 and CeO2-TiO2-Al2O3 oxides and mixed oxides produced 15.5, 14.3 and
96.3% discoloration, respectively.
Complete discoloration (100%) (Fig. 12) followed this order: Fe/CeO2-TiO2Al2O3 > Ag/CeO2-TiO2-Al2O3 > TiO2 for the photocalysts calcined at 623.15 K. CeO2, Al2O3 and CeO2-TiO2-Al2O3 showed discolorations of around 8.2, 21.6 and 96.4%, respectively.
It was observed that the time for discoloration was influenced by thermal treatment; when the calcinations temperature increased, the time of discoloration decreased. The modification of the specific surface area of the photocatalyst may have favored the photocatalytic discoloration under the conditions studied.
It can be observed in Figures 11 and 12 that the mixed oxides produced around 96% discoloration of reactive blue 5G dye in 3600 s of reaction time, while the oxide TiO2 produced 100%. However, with the addition of Fe, the discoloration time decreased to 15 min for Fe/CeO2-TiO2-Al2O3 calcined at 473.15 K.
For the photocatalysts TiO2, CeO2-TiO2-Al2O3, CeO2 and Al2O3 calcined at different temperatures, no significant changes in discoloration time took place. Non-calcined Ag/CeO2-TiO2-Al2O3 had similar characteristics (B.E.T. and XRD) after calcination, although the time of discoloration for the photocatalyst calcined at 623.15 K was shorter, possibly due to the larger elimination of contaminants from the surface of the photocatalyst, which may have favored the reaction. Fe/CeO2-TiO2-Al2O3 catalysts calcined at 473.15 and 623.15 K had similar discoloration times.
0 500 1000 1500 2000 2500 3000 3500
0 10 20 30 40 50 60 70
(k=2.6x10⁻³
R2
=0.9738)
(k=8.2x10⁻⁴
R2
=0.9930)
(k=1.1x10⁻³
R2=0.9496)
(k=1.9x10⁻³
; R2
=0.9865)
(k=6.7x10⁻⁵
; R2
=0.9829)
CeO2-TiO2-Al2O3
Fe/CeO2-TiO2-Al2O3
Ag/CeO2-TiO2-Al2O3
TiO2
CeO2
Al2O3
C
once
n
tra
tion (pp
m
)
Time (min)
(k=2.4x10⁻⁵
; R2
=0.9864)
0 500 1000 1500 2000 2500 3000 3500 0 10 20 30 40 50 60 70 (k=3.5x10⁻³
R2=0.9989)
(k=1.9x10⁻³
; R2
=0.9865)
(k=8.7x10⁻⁴ ; R2=0.9725)
(k=1.1x10⁻³ ; R2
=0.9572) (k=4.1x10⁻⁵
; R2
=0.8799)
(k=5.0x10⁻⁵ ; R2=0.8936)
CeO2
TiO2
Al2O3
CeO2-TiO2-Al2O3
Ag/CeO
2-TiO2-Al2O3
Fe/CeO2-TiO2-Al2O3
C
o
nc
entration (ppm)
Time (min)
Figure 11: Photocatalytic discoloration of reactive blue 5G dye with CeO2, TiO2, Al2O3, CeO2-TiO2-Al2O3, Ag/CeO2-TiO2-Al2O3 and Fe/CeO2-TiO2-Al2O3 photocatalysts calcined at 473.15 K.
0 500 1000 1500 2000 2500 3000 3500
0 10 20 30 40 50 60 70
(k=3.1x10⁻³ ; R2=0.9666) (k=9.1x10⁻³
; R2 =0.8285)
(k=8.7x10⁻⁴ R2
=0.9725) (k=1.1x10⁻³
; R2 =0.9579)
(k=6.7x10⁻⁵ ; R2
=0.9829) (k=2.7x10⁻⁵
; R2 =0.9321)
CeO2-TiO2-Al2O3 Fe/CeO
2-TiO2-Al2O3
Al2O3
TiO2
Ag/CeO2-TiO2-Al2O3 CeO 2 C onc e n tra tio n (p pm ) Time (min) 0 10 20 30 40 50 60 70 C onc ent rat io n (p p m) Time (min) (k=8.7x10⁻⁴ R2=0.9725) (k=1.1x10⁻³; R2=0.9579)
(k=2.7x10⁻⁵; R2=0.9321)
(k=6.7x10⁻⁵; R2=0.9829)
(k=9.1x10⁻³; R2=0.8285)
(k=3.1x10⁻³; R2=0.9666)
CeO2-TiO2-Al2O3
Fe/CeO2-TiO2-Al2O3
Al2O3
TiO2
Ag/CeO2-TiO2-Al2O3
CeO 2
0 500 1000 1500 2000 2500 3000 3500
0 500 1000 1500 2000 2500 3000 3500
0 10 20 30 40 50 60 70
(k=3.1x10⁻³ ; R2=0.9666) (k=9.1x10⁻³
; R2 =0.8285)
(k=8.7x10⁻⁴ R2
=0.9725) (k=1.1x10⁻³
; R2 =0.9579)
(k=6.7x10⁻⁵ ; R2
=0.9829) (k=2.7x10⁻⁵
; R2 =0.9321)
CeO2-TiO2-Al2O3 Fe/CeO
2-TiO2-Al2O3
Al2O3
TiO2
Ag/CeO2-TiO2-Al2O3 CeO 2 C onc e n tra tio n (p pm ) Time (min) 0 10 20 30 40 50 60 70 0 10 20 30 40 50 60 70 0 10 20 30 40 50 60 70 C onc ent rat io n (p p m) Time (min) (k=8.7x10⁻⁴ R2=0.9725) (k=1.1x10⁻³; R2=0.9579)
(k=2.7x10⁻⁵; R2=0.9321)
(k=6.7x10⁻⁵; R2=0.9829)
(k=9.1x10⁻³; R2=0.8285)
(k=3.1x10⁻³; R2=0.9666)
CeO2-TiO2-Al2O3
Fe/CeO2-TiO2-Al2O3
Al2O3
TiO2
Ag/CeO2-TiO2-Al2O3
CeO 2
CeO2-TiO2-Al2O3
Fe/CeO2-TiO2-Al2O3
Al2O3
TiO2
Ag/CeO2-TiO2-Al2O3
CeO 2
0 500 1000 1500 2000 2500 3000 3500
0 500 1000 1500 2000 2500 3000 3500
Figure 12: Photocatalytic discoloration of reactive blue 5G dye with CeO2, TiO2, Al2O3, CeO2-TiO2-Al2O3, Ag/CeO2-TiO2-Al2O3 and Fe/CeO2-TiO2-Al2O3 photocatalysts calcined at 623.15 K.
CONCLUSIONS
The obtained catalysts have different characteristic textures. However, a larger specific surface area does not imply better photocatalytic activity. The results indicate that the calcination temperature has an influence on the discoloration of reactive blue 5G dye. The oxides CeO2 and Al2O3 showed low catalytic activity. However, the CeO2-TiO2-Al2O3 mixed oxide gave results similar to TiO2, with 96% and 100% discoloration, respectively, for all the calcination temperatures. The addition of Fe and Ag to the mixed oxide increased the rate of discoloration of reactive blue 5G dye. The only
exception was the non-calcined sample Ag/CeO2-TiO2-Al2O3, which presented 97.7% discoloration.
REFERENCES
Chen, D.-W., Ray, A. K., Photocatalytic kinetics of phenol and its derivatives over UV irradiated TiO2. Appl. Catal., B: Environ., 23, 143 (1999). Colpini, L. M. S., Alves, H. J., Santos, O. A. A.,
402 M. C. P. Souza, G. G Lenzi, L. M. S. Colpini, L. M. M. Jorge, O. A. A. Santos
Brazilian Journal of Chemical Engineering
Houas, A., Lachheb, H., Ksibi, M., Elaloui, E., Guillard, C., Hermann J. M. Photocatalytic degradation pathway of methylene blue in water. Appl. Catal., B: Environ, 31, 145 (2001).
JCPDS, Internacional Centre for Diffraction Data. PCPDFWIN, 130 (1997).
Kansal, S. K., Singh, M., Sud, D., Studies on photodegradation of two commercial dyes in aqueous phase using different photocatalysts. Journal of Hazardous Materials, 141, 581 (2007). Konstantinou, I. K., Albanis T. A., TiO2-assisted
photocatalytic degradation of zo dyes in aqueous solution: kinetic and mechanistic investigations. A review. Appl. Catal. B: Environ., Amsterdam, 49, 1 (2004).
Lenzi, G. G., Lenzi, M. K., Baesso, M. L., Bento, A. C., Jorge, L. M. M., Santos, O. A. A., Cobalt, nickel and ruthenium-silica based materials synthesized by the sol-gel method. Journal of Non-Crystalline Solids, 354, 4811 (2008).
Molinari, R., Pirillo, F., Falco, M., Loddo, V., Palmisano, L., Photocatalytic degradation of dyes by using a membrane reactor. Chem. Eng. Process, 43, 1103 (2004).
Özkan, A., Özkan, M. H., Gürkan, R., Akcay, M., Sökmen, M., Photocatalytic degradation of a textile azo dyes, Sirius Gelb GC on TiO2 or Ag-TiO2 particles in the absence and presence of UV/VIS irradiation: The effects of some inorganic anions on the photocatalysis.
J. Photochem. Photobiol., 163, 29 (2004). Pelegrini, R., Peralta-Zamora, P., Andrade, A. R.,
Reyes, J., Duran, N., Electrochemically assisted photocatalytic degradation of reactive dyes. Appl. Catal. B Environ., 22, 83 (1999).
Peralta-Zamora, P., Pereira, C. M., Tiburtius, E. R. L., Moraes, S. G., Rosa, M. A., Minussi, R. C., Durán, N., Decolorization of reactive dyes by immobilized laccase. Appl. Catal. B Environ., 42, 131 (2003).
Ràfols, C., Barceló, D. Determination of mono- and disulphonated azo dyes by liquid chromatography– atmospheric pressure ionization mass spectrometry. J. Chromatogr. A., 777, 177 (1997).
Rezaee, A., Taghi Ghaneian, M., Hashemian, S. J., Moussavi, G., Khavanin, A., Ghanizadeh, G., Decolorization of Reactive Blue 19 Dye from Textile Wastewater by UV/H2O2. Process Journal of Applied Sciences, 6, 1108 (2008).
Souza, M. C. P., M. Sc.Thesis (In Portuguese), Universidade Estadual de Maringá (2009).
Weber, J., Stickney, V. C., Hydrolysis kinetics of Reactive Blue 19-vinyl sulfone. Water Res. 27, 63 (1993).
Yan, L., De-Zhi, S., Lin, C., Yan-Ping, L., Preparation and characterization of Fe203-Ce02-TiO2-γA1203 catalyst for degradation dye wastewater. Journal of Environmental Sciences, 18, 189 (2006).