Dissertação de Mestrado
“Precipitação de escorodita a partir de soluções industriais contendo arsênio”
Autora: Michelle Lara Caetano Orientadora: Profª. Virgínia S. T. Ciminelli Co-Orientadora: Profª. Sônia D. Ferreira Rocha
UNIVERSIDADE FEDERAL DE MINAS GERAIS
Curso de Pós-Graduação em Engenharia Metalúrgica e de Minas
Michelle Lara Caetano
Precipitação de escorodita a partir de soluções industriais contendo arsênio
Scorodite precipitation from industrial solutions containning arsenic
Dissertação de Mestrado apresentada ao Curso de Pós-Graduação em Engenharia Metalúrgica e de Minas da Universidade Federal de Minas Gerais
Área de Concentração: Tecnologia Mineral Orientadora: Profª. Virgínia S. T. Ciminelli Co-Orientadora: Profª. Sônia D. Ferreira Rocha
Belo Horizonte
AGRADECIMENTOS
É chegado o término de mais uma etapa, e com ele a sensação de alívio e realização, aliados a incerteza e saudade. Se cheguei até aqui, sei que não foi sozinha. Assim, agradeço aqueles que contribuiram direta e indiretamente para mais uma realização:
À Professora Virgínia Ciminelli, pela oportunidade, o suporte fundamental e por todos os ensinamentos profissionais e pessoais adquiridos ao longo desses dois anos.
À Professora Sônia, pela compreensão exata de quais eram meus objetivos ao sair da graduação, e assim ter me indicado o caminho da hidrometalurgia. Obrigada pelo apoio, carinho, amizade e acima de tudo por acreditar em mim.
Sandro, Madalena e Judith do Laboratório de Análises Químicas pela compreenção, amizade, prestatividade e boa vontade. Patrícia (MEV), Andréia (Difração de Raios-X) e Sica (RAMAN), pelo suporte técnico.
Aos amigos do Laboratório de Hidrometalurgia, obrigada por tudo: Ilda, João, Bruno, Maycon, Raquel, Júlio, Christina, Katharina e Rodrigo (mais que um amigo). Não posso deixar de destacar as valiosas colaborações da Cláudia (obrigada por todas as idéias compartilhadas, pelo apoio e incentivo) e do Fernando (não só pelas idéias, pelo carinho e amizade, mas também pela ajuda direta na montagem do sistema contínuo entre muitas outras coisas que fez por mim: Muito Obrigada!). Aqui encontrei pessoas que, mesmo que o tempo e a distância insistam, sempre estarão presentes no meu coração e na minha vida.
Aquele que mais colaborou para a realização desse trabalho, sem o qual certamente eu não não teria conseguido resultados tão positivos: Mateus Calonge, muito mais que Muito Obrigada !!!!!! Pelo carinho, dedicação, empenho e amizade.
À minha mãe e minhas irmãs, Gagau e Andreza, base do meu sucesso; e aos meus sobrinhos, que apesar da bagunça e do constante stress, conseguem encher minha vida de alegria. Amo vocês, sempre!
TABLE OF CONTENTS
1 INTRODUCTION ... 1
2 LITERATURE REVIEW ... 4
2.1 ARSENIC CHEMISTRY SPECIATION... 4
2.2 THE DISPOSAL OF ARSENICAL WASTES: TECHNOLOGIES AND ENVIRONMENTAL CONSIDERATIONS... 7
2.3 SOLUBILITIES AND STABILITIES OF FERRIC ARSENATE COMPOUNDS... 12
2.3.1 Crystallinity ... 12
2.3.2 Fe:As molar ratio ... 14
2.3.3 Carbonation with atmospheric CO2... 15
2.3.4 Transformation into goethite ... 15
2.4 FUNDAMENTALS OF PRECIPITATION... 15
2.4.1 Precipitation processes (Söhnel and Garside, 1992)... 15
2.4.2 The driving force for crystallization... 18
2.4.3 Nucleation... 19
2.4.4 Crystal growth... 20
2.4.5 The Mixed Suspension Mixed Product Removal (MSMPR) precipitator 21 3 ARSENIC REMOVAL FROM DILUTE INDUSTRIAL EFFLUENTS BY SCORODITE PRECIPITATION... 26
3.1 INTRODUCTION... 26
3.2 EXPERIMENTAL PROCEDURE... 31
3.3 RESULTS AND DISCUSSION... 34
3.3.1 Effect of pH and Initial arsenic concentration... 34
3.3.2 Effect of seed concentration ... 38
3.3.3 Comparison of gypsum and scorodite seeds ... 41
3.3.5 Characterization of the Precipitates and Evaluation of TCLP - leachability 45
3.4 CONCLUSIONS... 57
3.5 REFERENCES... 58
4 SCORODITE PRECIPITATION IN A CONTINUOUS SYSTEM: EVALUATION OF ARSENIC REMOVAL AND PRODUCT STABILITY ... 61
4.1 INTRODUCTION... 61
4.2 EXPERIMENTAL PROCEDURE... 63
4.3 RESULTS AND DISCUSSION... 66
4.3.1 Characterization of the Precipitates and Evaluation of TCLP - leachability 71 4.3.2 Application of the crystallizer model... 79
4.4 CONCLUSIONS... 82
4.5 REFERENCES... 83
5 REFERENCES ... 85
6 APPENDICES ... 90
6.1 APPENDIX A:X-RAY DIFFRACTION PATTERNS OF SOLIDS PRECIPITATED IN BATCH TESTS WITH DIFFERENT SPI... 90
6.2 APPENDIX B:X-RAY DIFFRACTION PATTERNS OF THE TWO SYNTHESES OF SCORODITE SEEDS IN AUTOCLAVE. ... 92
6.3 APPENDIX C:RESULTS OF THE CHEMICAL ANALYSES –BATCH TESTS... 94
6.4 APPENDIX D:RESULTS OF THE CHEMICAL ANALYSES –DETERMINATION OF THE EXPERIMENTAL ERROR... 100
LIST OF FIGURES
Figure 2.1 – (a) Arsenite and (b) arsenate speciation as a function of the pH (ionic strength of about 0.01M) (Smedley and Kinniburgh, 2002)...5
Figure 2.2 – Eh-pH diagram for As–H2O system at 25ºC and 0.1 mol/ kg H20, considering only the derivatives of the acid arsenic and arsenious acids (HSC Chemistry, 1999). ...6
Figure 2.3 – Kinetic processes involved in precipitation (Söhnel and Garside, 1992)...17
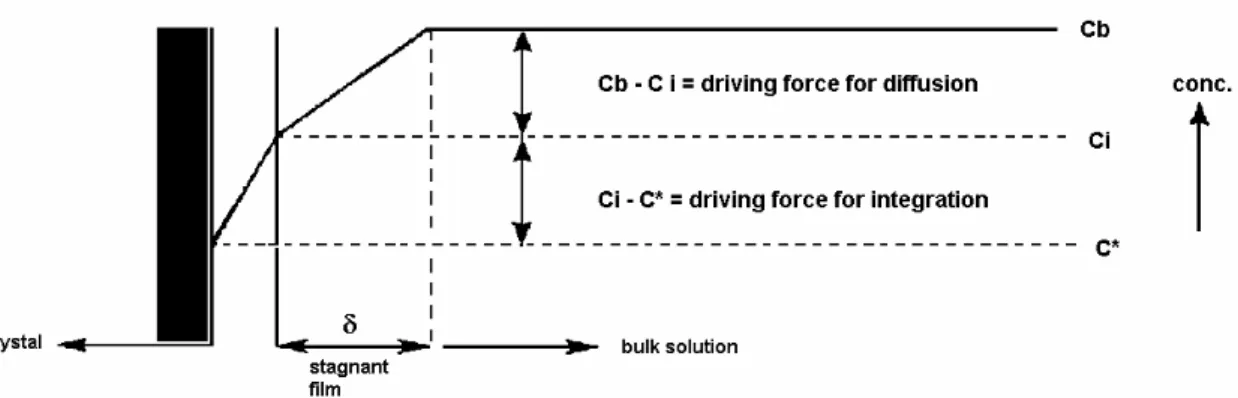
Figure 2.4 – Concentration profile perpendicular to the crystal surface during growth (IPT, 1997). ...20
Figure 2.5 – Schematic representation of an MSMPR reactor of effective volume V (L) being fed by a solution of concentration ci (mol/L) at rate Qi (L/s) and
suspension discharge at rate Q0 (L/s) with solute concentration c0 (mol/L). ...22
Figure 2.6 – Deviation from the straight line (a) due to mechanical effects (b) due to kinetic effects (Mersmann et al., 2001). ...25
Figure 3.1 – Supersaturation control area for atmospheric precipitation of scorodite, where Ceq is the equilibrium concentration and Ccr is the critical
supersaturation (95ºC, Fe:As = 1.0, and sulfate media) (Demopoulos, 2005)...28
Figure 3.2 – Block diagram of the experimental procedure in tests carried out in batch system...33
Figure 3.3 – Critical supersaturation line (Ccr), defined by an induction pH measured at
ambient temperature. ...37
Figure 3.4 – Scorodite precipitation at different initial arsenic concentrations (T = 95ºC, scorodite seeds concentration = 40g/L). ...38
Figure 3.6 – Arsenic removal with the surface area available for the crystals growth ( ). Data calculated from Caldeira et al. (2005) ( ). ...40
Figure 3.7 – Arsenic precipitation from the industrial solution using gypsum and scorodite seeds (T = 95ºC, seeds concentration = 40g/L)...42
Figure 3.8 – Nucleation on the foreign particle for different contact angles (Mersmann et al., 2001). ...43
Figure 3.9 – Arsenic precipitation under different sulfate concentrations (T = 95ºC, scorodite seeds concentration = 40g/L, pH = 0.9)...45
Figure 3.10 – Variation in the solid production index (SPI) as a function of seed concentration. Initial arsenic concentration of 1.1g/L, pH 0.9 and scorodite seeds produced in autoclave. ...46
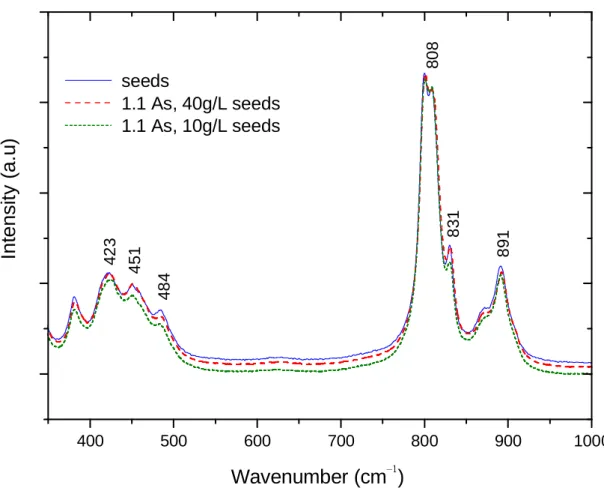
Figure 3.11 – Raman spectra in the range of 300-1000 cm-1 for the scorodite seeds produced in autoclave and precipitates from batch tests. ...47
Figure 3.12 – X-ray diffraction patterns of solids precipitated in batch tests with different SPI (An amplified vision is presented in the Appendix A)...48
Figure 3.13 – SEM image of scorodite seeds produced by hydrothermal process (synthetic solutions of Fe(III) and As(V); 150ºC; 2 hours; pH = 1.5; Fe:As = 1:1). ...49
Figure 3.14 – SEM image of formed solids, after 8 hours of batch precipitation tests at ambient pressure conditions. ...49
Figure 3.15 – Raman spectra in the range of 100-1200 cm-1 for the gypsum seeds. ...50
Figure 3.16 – X-ray diffraction patterns of the gypsum seeds...51
Figure 3.17 – X-ray diffraction patterns of the solids formed in batch tests with gypsum seed. ...52
Figure 3.19 – Analysis by energy dispersive spectrometry (EDS) on the flat areas (1) and on the crust formed on gypsum surface (2)...55
Figure 3.20 – Raman spectra in the range of 100-1200 cm-1 for the solids formed in the batch tests with gypsum seeds (arsenic concentration = 10g/L). ...56
Figure 4.1 – Dependence of induction pH on arsenic concentration at 95ºC (adapted from Debekaussen et al., 2001; by Caldeira et al., 2005). ...62
Figure 4.2 – Schematic representation of the continuous precipitation system with recycle of solids (MSMPRR)...64
Figure 4.3 – Block diagram of the experimental procedure for continuous precipitation. 65
Figure 4.4 – Arsenic concentration in the solution leaving the reactor for tests carried out with (MSMPRR reactor) and without (MSMPR reactor) recycle of seeds (T = 95ºC, seeds concentration = 40g/L, Fe:As = 1.0)...68
Figure 4.5 – Variation of the solids concentration for tests carried out in the MSMPRR and MSMPR reactors (T = 95ºC, initial seeds concentration = 40g/L, Fe:As = 1.0). ...69
Figure 4.6 – Arsenic concentration in the exit solution for different Fe/As molar ratio, pH values and seeds with different specific surface area (T = 95ºC, seeds concentration = 40g/L)...71
Figure 4.7 - SEM images obtained in the two syntheses in autoclave (a) arsenic concentration of 25g/L and pH 1.5; D50 = 2.5µm; SSA = 13.96m2/g (b) arsenic concentration of 33g/L and pH 1.3; D50 = 1.6µm; SSA = 14.42m2/g (magnification of 10.000 times). ...73
Figure 4.8 – X-ray diffraction patterns of solids obtained under different Fe:As molar ratios. ...74
Figure 4.9 – Specific surface area and particle size of the solids (exit stream) as a function of time for consecutive runs in a MSMPRR reactor. ...76
Figure 4.11 – SEM micrographs of scorodite seeds produced in autoclave and of precipitates after 20, 28, 42, 52 and 60 hours (magnification of 10.000 times). ...77
Figure 4.12 – Variation in the TCLP solubility with the time of recycle of solids (T = 95ºC; seeds concentration = 40g/L). ...79
Figure 4.13 – Population density versus crystal size for a sample taken from the slurry after 9 hours of reaction (with recycle of seeds)...81
LIST OF TABLES
Table II.1 – Summary of industrial operating practice (as of years 2000/2001) (Harris, 2003). ...8
Table II. 2 – Considerations on long term stability for the various arsenic disposal options (Swash and Monhemius, 1995). ...13
Table III.1 – Removal obtained at different initial arsenic concentration (seeds concentration = 40g/L, T = 95ºC). ...36
LIST OF SYMBOLS
AsFH = arsenical ferrihydrite Bº= nucleation rate
C = solute concentration
Ceq and c* = equilibrium concentration
cb =the bulk concentration Cc = critical supersaturation
ci = concentration at the crystal-solution interface and fed concentration solution c0 = solute concentration discharge
D50 = average diameter G = growth rate
G1 = growth rate of crystals of size L1
G2 = growth rate of crystals of size L2
Keq = equilibrium constant
L = crystal size
L1 and L2 = crystal size in the fed and in the discharge, respectively
MPL = maximum permitted level
MSMPR = Mixed Suspension Mixed Product Removal
MSMPRR = Mixed Suspension Mixed Product Removal with Recycle _
i
n = average population density
nº = population density of the embryo-size crystals n1 and n2 = population density
Q0 = rate of suspension discharge
Qi = volumetric flow rate in the fed
S = saturation ratio
Sc = critical supersaturation ratio
SSA = specific surface area SPI = solid production index t = period of time
WHO = World Health Organization z = valency of the ions
γΑand γΒ= activities coefficient of the species A and B
δ = stagnant film thickness
θ = contact angle formed between the crystalline solid and the foreign solid phase
RESUMO
Escorodita (FeAsO4*2H2O) tem sido considerada a forma preferida para a disposição de resíduos contendo arsênio. Comparada com a ferridrita arsenical, a escorodita oferece vantagens que combinam elevado teor de arsênio e solubilidade em água menor que 1mg/L em pH 5. O presente trabalho investigou a remoção de arsênio de uma solução diluída (1g/L As) produzida na torre de lavagem de gases do processo de ustulação de um minério refratário de ouro. Pela primeira vez foi mostrado que soluções industriais com baixas concentrações de arsênio (1,1 – 0,1g/L) podem ser tratadas em um estágio de precipitação de escorodita sob condições de pressão ambiente, com uma remoção na faixa de 80,5 a 94,6% .
A precipitação foi
realizada a 95ºC. Visando controlar a supersaturação e evitar a nucleação
heterogênea que leva a produção do arsenato férrico amorfo, o pH foi ajustado
de acordo com a concentração inicial de arsênio. A remoção aumentou com o
aumento da concentração de sementes de escorodita até 20g/L. Foi
demonstrado que uma área superficial maior que 270 m
2/g As em solução foi
necessária para promover uma remoção de arsênio de aproximadamente 85%.
ABSTRACT
1 INTRODUCTION
Arsenic is one of the contaminants of concern in wastes from metallurgical and mining industries. Due to arsenic’s high toxicity, the environmental regulations are becoming increasingly stringent regarding the use and disposal of As compounds. In Brazil, the maximum permitted level (MPL) in waters used for the human consumption is of 0.01mg As/L, following recommendations of the World Health Organization (Portaria Nº 1469/2000; WHO 1993). The regulation on pollutant discharges in waters of the state of Minas Gerais establishes a limit of arsenic concentration of 0.2mg As/L (Deliberação Normativa COPAM 10/86). Thus, the arsenic removal from industrial effluents becomes often necessary in order to comply with the environmental legislation. However, it is also important that arsenic residues are disposed in a safe form, in order to avoid its further release to the environment.
The environmental concern has led to the development of disposal technologies that are environmentally safe and costly attractive. In the mineral industry, the most commonly methods used to treat effluents containing arsenic are the precipitation of arsenical ferrihydrite - AsFH at ambient temperature and the hydrothermal precipitation of iron arsenates (Harris, 2003). The AsFH process route generates large volumes of waste with low arsenic concentration (3-6%) (Caldeira et al., 2005). Thus, large areas for the final disposal are needed, which in turn results in additional costs of operation.
costs associated with the requirement of an autoclave and is economically attractive only if it can be combined with the processing of a valuable concentrate, such as gold. Due to the aforementioned advantages related of the precipitation of arsenic as scorodite, there have been attempts to develop a process under more benign conditions. Demopoulos and co-workers (Demopoulos et al., 1995; Filippou and Demopoulos, 1997; Debekaussen et al., 2001; Demopoulos, 2005; Singhania et al., 2005) demonstrated the possibility to precipitate scorodite at ambient pressure conditions, and temperatures below the water boiling point (95ºC). This process of scorodite production is cheaper than the hydrothermal process and can be applied regardless to the metal recovery (Singhania et al., 2006). Feasibility studies of scorodite precipitation at ambient pressure indicated that the process is competitive with the ferryhydrite process in terms of capital cost. Regarding the operation, the largest costs are associated with the use of Fe2(SO4)3 (60%) and H2O2 (20%) (Filippou and Demopoulos, 1997). The ambient-pressure precipitation technique involves the supersaturation control and the addition of seeds, in order to favor crystal growth instead of homogeneous nucleation.
ambient pressure is competitive with the arsenic ferrihydrite process (adopted by the industry) for the treatment of effluents with arsenic concentrations in a level of 1 g/L.
2 LITERATURE REVIEW
2.1 Arsenic chemistry speciation
The determination of the concentration of different solid and aqueous species in water is defined as speciation analysis. All the species together will dictate the total element concentration in the sample, and the individual physico-chemical forms may include particulate matter in water and dissolved species, such as inorganic or organic species. As the various species exhibit different toxicity levels, the analysis of arsenic speciation in the environment is of considerable importance (Kumaresan and Riyazuddin, 2001).
Inorganic arsenic is mostly found in aqueous systems as arsenite As(III) and arsenate As(V) species. The dominant arsenic species will be determined mainly by pH and redox potential. Figures 2.1 and 2.2 show the species distributions as a function of the pH and Eh. The thermodynamically stable species in surface (aerated) waters is arsenate. The pentavalent species may exist as the four derivatives of arsenic acid: H3AsO4, H2AsO4-, HAsO42- and AsO43-. The neutral molecule predominates only at extremely low pH (<2), being further replaced by H2AsO4
-
and HAsO4
at pH 2-11. Therefore, these are the most likely species to occur in surface water and relatively high Eh. Arsenite may occur in aqueous solutions as the derivatives of the arsenous acid: H3AsO3, H2AsO3-, HAsO3-2 and AsO3-3. The uncharged arsenite species (H3AsO3) will predominate under reducing conditions and relatively low Eh, up to pH 9.2, being then replaced by H2AsO3-. The HAsO32- form appears only when pH exceeds 12. At low pH and in the presence of sulphide, HAsS2 can be formed; under extreme reducing conditions arsine, arsine derivatives and arsenic metal may also occur (Smedley and Kinniburgh, 2002; Dutré and Vandecasteele, 1998; Cheng et al., 1994).
result of its weaker, reversible adsorption on soil constituents, such as iron and aluminum oxyhydroxides (Ladeira and Ciminelli, 2004).
Figure 2.1 – (a) Arsenite and (b) arsenate speciation as a function of the pH (ionic strength of about 0.01M) (Smedley and Kinniburgh, 2002).
prevents sorption and co-precipitation, thus increasing the arsenic mobility in soil and in aquatic systems (Kumaresan and Riyazuddin, 2001).
Figure 2.2 – Eh-pH diagram for As–H2O system at 25ºC and 0.1 mol/ kg H20, considering only the derivatives of the acid arsenic and arsenious acids (HSC Chemistry, 1999).
hydrogen peroxide is the environmentally preferred agent, because it has a high oxidation potential, is easily handled and the reactions products, water and oxygen, are harmless.
2.2 The disposal of arsenical wastes: technologies and environmental considerations
The arsenic is one of the most toxic pollutants found in the industrial effluents of the metals extraction, mainly copper, zinc, lead, gold and silver (Mambote et al., 2001). It can be released in the beneficiation of ores containing arsenic, during hydrometallurgical or pyrometallurgical processes (Demopoulos, 2005). The production far exceeds demand and, because of the more restrictive discharge limits for arsenic emission, increasingly larger amounts of arsenic should be recovered and disposed. The stricter environmental laws on the use of arsenic has also reduced its consumption for wood preservatives, fungicides, glass, ceramics, non-ferrous alloys and other lesser uses. These factors contribute to increase the problems of oversupply and the need for safe methods of disposal (Swash and Monhemius, 1995).
wastewater due to cost constraints. A work published by Harris (2003) shows a survey on industrial methods that are currently applied for the removal and disposal of arsenic from process solutions in the mining industry. Table II.1 presents a summary of the industrial operating practices.
Table II.2.I – Summary of industrial operating practice (as of years 2000/2001) (Harris, 2003).
Operation Comments
Arsenical Ferrihydrite Agua Rica, Argentina Amorphous process planned
Barrick Goldstrike Used for groundwaters
Billiton Fairview Sufficient Fe from BIOX to fix arsenic during neutralization
Codelco – Chuquicamata
Investigating BioCOP process with Billiton, wherein arsenic will be fixed during neutralization of BioCOP
liquors
Deloro, Ontario Poorly controlled. Plant shut down, but remains an environmental liability
Falconbridge, Kristiansand In operation for several years – sludge stored in secure area
Giant Yellowknife
Effluent treatment – highly effective for many years, still being operated. Most arsenic, however, was stored as As2O3, and needs re-treatment
Goldcorp, Red Lake
Ferric treatment of mill tailings, but currently no arsenic oxidation; sludges believed to be mostly in reduced form
Hudson’s Bay Smelter dust fixed in neutralization along with pressure leach residue
Inco CRED Well proven – consistently very low As in discharge. High Fe/As molar ratio
Morro Velho
In-situ oxidation of ferrous sulphate. Process was not well controlled, resulting in groundwater contamination. Ecological treatment being investigated
Noranda Horne Well proven – includes base metals to make up for Fe shortfall
Outokumpu, Kokkoka Included in jarosite peocess Pasminco Included in paragoethite process Placer Dome Getchell Sludge ponded
São Bento BIOX residue uses Fe from pressure leach, and two are mixed prior to ponding
Union Minière Sludge disposed of in secure areas. Few details Western Mining
Corporation
Very high Fe/As ratio, but from alkaline medium. Passes all regulatory
High Temperature Minerals Arcata, Peru Autoclave under consideration
General Gold, Mauritânia Autoclave chosen. Project seeking financing
Giant Mine Autoclave was one option considered. No definitive selection has yet been made
Goldcorp, Red Lake Autoclave being constructed for concentrate. Same logic as for Campbell next door
Hudson’s Bay Arsenic fixed during pressure leach of zinc concentrate Miramar Con Mine Recently switched to the mineral from arsenic trioxide
Table II.1 – Summary of industrial operating practice (as of years 2000/2001) (Harris, 2003), cont..
Placer Dome Campbell
Type II mineral – has been in sucessful operation for over a decade. Autoclave replaced roaster for arsenic environmental reasons
São Bento, Brazil
Most of arsenic fixed in autoclave as Type II mineral. Sufficient iron from this to BIOX material as arsenical ferryhydrite. Residues are combined
TVX Hellas, Greece Autoclave was planned, in conjunction with BIOX
Lime Neutralization – Calcium Arsenate/Arsenite Anglo Platinum, South
Africa
Lime, but under consideration
Codelco - Chuquicamata
Current process. Very little iron, and residue sent to secure area. Conditions are, however, arid. Alternatives being seriously investigated
Codelco – El Teniente
Calcium arsenate is calcined to impart crystallinity. Material passes TCLP most of the time. However, government has mandated changes of process
Codelco – Potrerillos Current process
MDK, Bulgaria No longer acceptable. Ferrihydrite process planned Noranda Altonorte Current process. Very little iron, and residue sent to
secure area. Conditions are, however, arid Copper Arsenate
Cominco, Trail Process in operation for several years. Product sold in US
Inco, Thompson Process developed, but not implemented
Mount Isa
Process in operation for several years, combined with solvent extraction. Product sold directly to wood preservative companies in Australia
Outokumpu, Pori Product sold as wood preservative San Luis Potosi, Mexico Developed process, but no market
Arsenic Sulphide
Rio Tinto Kennecott Process Successfully operated for several years. Believed to be studying alternatives processes
Arsenic Trioxide
ASARCO No longer practiced
Barrick El Indio Product sold. Stockpile being re-treated Boliden No longer practiced
Giant Mine Evaluation of methods for stockpiled product
Placer Dome Campbell Replaced by autoclave operation to form stable mineral
La Oroya Product mostly sold. Off-spec material stockpiled, needs to be re-treated
The author’s comments on the data shown in Table II are summarized in the following paragraphs (Harris, 2003). The most widely applied method for arsenic removal from mining effluents is the co-precipitation with ferric iron as amorphous ferric arsenates. These precipitates have shown to be adequately stable if the Fe:As molar ratio is higher than 4 (Harris and Krause, 1993); addition of extra ferric iron to the system is often required. It is reported that Inco’s CRED plant in Sudbury has been operating for close to thirty years, with no sign of ferrihydrite breakdown, or of arsenic release. The incorporation of small amounts of both cations and anions into the ferrihydrite matrix was shown to delay the recrystallization process of the more stable goethite or hematite, and hence the consequent release of adsorbed ions (Dutrizac and Jambor, 1998). The US EPA considers the arsenical ferrihydrite process as the BDAT (Best Available Demonstrated Technology), and operations applying it correctly have not reported any contamination of local groundwaters. The second most popular approach is the formation of ferric arsenates in autoclaves, at high temperatures. This process has been applied for many years by the gold industry, with success. Similarly, no problem has been identified if the process is carried out in a proper form.
The operations of Noranda and Codelco in Chile are still based on simple lime neutralization. However, the residue formed is not environmentally stable and can react with atmospheric carbon dioxide, releasing soluble arsenic. The Chilean government has indicated that such practices disposal will probably not be tolerated by much longer time, thus research has been carried out to find out alternatives to treat the arsenic wastes. The most obvious conclusion to be drawn is that operations have adopted generally site-specific practices, and the cheapest approach.
methods are carried out in aqueous solution, these being sulphide precipitation and the manufacture of copper arsenate. With regard to copper arsenate, it has been demonstrated that arsenic is not released to the environment. However, there is an understandably strong environmental lobby against its use. Copper arsenate has been an effective wood preservative, however this market is small. The sulphide precipitation method is effective, and can remove arsenic to very low levels. However, there are some problems associated with its use, such as the release of toxic gases by formation of hydrogen sulphide. The possibility of encapsulating arsenic sulphide within a glassy block of elementary sulphur is also being investigated. Such materials pass in the TCLP test (Toxicity Characterization Leach Procedure; EPA, 1992), but it was still not demonstrated that the slow devitrification, and the consequent release of arsenic, does not take place.
2.3 Solubilities and stabilities of ferric arsenate compounds
The formations of arsenical ferrihydrites and calcium arsenates are attractive options as these require lower investment and simple technology if compared to the arsenical cements and hydrothermal precipitation routes. However, it is important to consider the long-term stabilities of the different arsenical products (Swash and Monhemius, 1995). Practical alternatives for arsenic disposal together with some considerations about the long-term stability of the arsenical products are shown in Table II.2. Many factors can influence the stability of the solid wastes. Among them, crystallinity, the Fe:As molar ratio and the possible phenomenon of transformation into other solid phases, such as calcium carbonate and goethite can be highlighted. These factors will be discussed in the following sections.
2.3.1 Crystallinity
Table II. 2.II – Considerations on long term stability for the various arsenic disposal options (Swash and Monhemius, 1995).
Arsenical compound Long term disposal considerations
• Dehydration leading to a more unstable compound.
Arsenical ferryhydrite (Fe:As > 3:1)
Ambient temperature precipitation • Possibility of long-term structural reordering to more stable compounds, e.g. goethite.
• High intrinsic solubilities.
• Ca-arsenates converted to CaCO3 by CO2 with release of arsenic.
Calcium-arsenates + Calcium-arsenites
• High lime levels in the precipitated solids results in high pH (11-12), but lime is slowly converted to CaCO3 – leading to reduced pH and increased solubility of the Ca-arsenate compounds.
• Low solubility over long period of time.
• Little physical or chemical change with time. Crystalline ferric arsenates
(Scorodite or Type-2)
• Long-term stability?
• Long-term stability unknown – quenched slags show low solubility.
• Possibility of recrystallisation – devitrification. Arsenical slags
(up to 10% arsenic)
• Requires highly specific conditions for incorporation into slag.
Arsenical cements
• Rely mainly on encapsulation for the stabilization of arsenic.
• Arsenic may be chemically bond as calcium arsenate phases that are soluble.
The increase of both the size of particle and crystallinity, primarily via high temperature precipitation or hydrothermal processing are advantages claimed for scorodite precipitation. This would have the effect of decreasing the arsenic release rate by reducing the exposed area of scorodite. According to Welham et al. (2000), the more negative free energy determined for the crystalline scorodite indicates that this is the most stable phase and could be expected to be the end product of an amorphous phase transformation at longer time.
2.3.2 Fe:As molar ratio
Different Fe:As ratios in the effluent liquors leads to solid products with different stabilities. The effectiveness of arsenic precipitation and settling rate increases with increasing Fe:As molar ratio (Papassiopi et al., 1996). Swash and Monhemius (1994) demonstrated that the amorphous solids should exceed the Fe:As ratio of 3:1 for the product to be stable in terms of arsenic release and suitable for disposal. If the precipitation takes place with a Fe:As molar ratio greater than 1.0, the ratio will gradually return to 1.0 with the ageing process of the precipitate (Papassiopi et al., 1996). These authors demonstrated that precipitates obtained at higher Fe:As molar ratios were even more stable (leached at 25ºC at pH = 5.0), resulting in a solubility of 0.05mg/L As.
2.3.3 Carbonation with atmospheric CO2
Calcium arsenate compounds, may react with atmospheric CO2, thus being transformed into calcium carbonate, and leading to the release of chemically bound arsenic. The calcium arsenate precipitation carried out with lime (Ca(OH)2) results in a high pH level of 11-12 in the metallurgical wastes. However, the excess lime is converted to calcium carbonate (CaCO3), leading to reduced pH and increased calcium arsenate solubility (Swash and Monhemius, 1995).
2.3.4 Transformation into goethite
According to Krause and Ettel (1989), crystal-aging causes the amorphous ferric oxyhydroxide to be transformed into goethite (α-FeOOH) as a result of the loss of unstructured water. With time it is possible the transformation to α-Fe203 (hematite). The many transformations occurring during this process can be expressed by the following equation:
α-FeOOH(aq) ⇒α-FeOOH ⇒α-Fe203(aq) ⇒α-Fe203 (2.1)
It is possible that the stability of basic ferric arsenates is influenced by phase changes of a similar nature. However, the kinetics of decomposition to FeOOH is not known. The presence of scorodite after the aqueous oxidation of arsenopyrite suggests that the conversion rate is geologically slow (Welham et al., 2000).
2.4 Fundamentals of precipitation
2.4.1 Precipitation processes (Söhnel and Garside, 1992)
can grow. A number of secondary processes such as ageing, ripening, coagulation and agglomeration may occur if the precipitated crystals are sufficiently small, and these processes can cause significant changes in the final particle size distribution and in the product chemical stability. The precipitation processes usually take place at constant temperature. Frequently, the necessary supersaturation results from a chemical reaction, being important to consider the mixing mechanism because many such reactions are fast.
The properties of the precipitated particles have a great importance on its applications, in particular, the crystal size distribution and the corresponding solid specific surface area. Together with the particle habit or morphology, the particle size distribution has a major impact on the particle-processing characteristics. Many precipitated products can form a range of polymorphs, amorphous phases. In most of the applications, only one specific phase is acceptable and so the precipitation conditions need to be controlled in order to ensure the formation of the desired product. Also, the crystallinity degree of the product may be important.
Figure 2.3 – Kinetic processes involved in precipitation (Söhnel and Garside, 1992).
2.4.2 The driving force for crystallization
To induce crystallization or precipitation from a solution, the thermodynamic state of the system has to be shifted away from the conditions of phase equilibrium, so a driving force is needed. In these processes, the driving force is called supersaturation, and there are many ways to induce it in a solution. If solubility increases with temperature, cooling may be used to supersaturate the solution. On the other hand, for systems where the solubility decreases with temperature, heating can be used. Evaporation is typically used when the solubility is not a strong function of temperature. Elevated pressures may be mechanism to precipitate a particular crystal phase, which is not stable at atmospheric pressure. Another form to induce supersaturation is to add another component (anti-solvent)in the solution, reducing in this way the solubility of the solute. In precipitation processes the insoluble species are produced by chemical reaction (Söhnel and Garside, 1992).
The crystallization rate is often determined by the supersaturation degree, and the crystallization process takes place only in supersaturated phases (Mersmann et al., 2001). The supersaturation (S) can be expressed as a difference in concentration (∆C = C – Ceq) or as a relative supersaturation
eq
C
C
S
=
(2.2)where C is the solute concentration and Ceq the equilibrium solubility of the solute at
the temperature and pressure of the system. However, considering ionic species, the dissociation into anions and cations can occur, as presented in the equation 2.3.
− ++
→
← z z
y
xB xA yB
A (2.3)
where z is the valency of the ions. In this case, the equilibrium constant may be expressed by the following equation:
(
) (
)
y eqB x eqAeq
a
a
where aeq is the equilibrium activity; the supersaturation may be expressed by
(
) (
)
(x y)eq y B x A
K
C
C
S
+
=
1 (2.5)For x = y = 1 and γΑ = γΒ = 1, where γΑ and γΒ are the activity coefficients of the
species A and B, the equation 2.5 will be reduced to
Keq
C
C
C
C
S
A Beq
=
=
(2.6)Crystallization is usually the result of the three processes; (i) nucleation, (ii) growth and (iii) secondary changes, for example, agglomeration, ageing and recrystallization. Depending on the reaction conditions, these processes can proceed either in series or in parallel, during whole or only a part of the crystallization.
2.4.3 Nucleation
The formation of a solid phase by nucleation from a liquid is only possible if this liquid is supersaturated. The nucleation can occur by two different mechanisms called primary and secondary nucleation. Primary nucleation is the creation of a new phase from a clear liquid. This type of nucleation can be classified into homogeneous and heterogeneous. In the homogeneous nucleation, a solid substrate is absent and the formation of a new phase results from local fluctuations in concentration caused by the formation of numerous clusters. The occurrence of homogeneous nucleation is rare in practice; heterogeneous nucleation is in general the dominant mechanism. In heterogeneous nucleation, a foreign substrate (seeds), usually comprised of very small particles is present in solution on which nucleation will start (Söhnel and Garside, 1992).
called as: (i) initial breeding, when dry seed crystals are introduced into the solution; (ii) dendritic breeding, where the corners and edges of the crystals suffer a higher supersaturation than the middle of the faces; (iii) contact nucleation that results from collision between the crystals and the impeller blades, the crystals and vessels walls or between crystals; and (iv) fluid shear breeding, that happens due to the turbulent fluid shear forces exerted on a crystal surface (IPT, 2004).
The mechanisms, which govern primary and secondary nucleation, are different, thus resulting in very different rate expressions. Therefore, the relative importance of each nucleation process varies with each specific precipitation reaction.
2.4.4 Crystal growth
After nucleation has taken place, the next step is to reduce the free energy of the small nuclei by growing it to larger sizes (Lawrence et al., 1986). The growth rate of the crystal faces determines the crystal shape, and also the surface structure and the purity of the crystal (IPT, 1997). Crystal growth can be controlled by diffusion through the crystal surface, reaction at the interface, and incorporation of the growth units into the crystal lattice. Generally, in an unstirred system the growth rate is diffusion-controlled. On the other hand, in the agitated system it is considered that the surface reaction becomes the rate-limiting step (Lawrence et al., 1986). The concentration profile perpendicular to the crystal surface during the growth process is shown in Figure 2.4.
The bulk concentration is represented by cb, ci is the concentration at the crystal-solution interface and c* is the equilibrium concentration - the concentration where will happen the incorporation into the crystal surface, and consequently the crystal growth.
For very soluble compounds, the surface integration is not rate limiting, and the growth rate is determined by diffusion through the stagnant film with thickness δ at the interface. The driving force for the diffusion is then defined as cb-c*, since ci = c*. On the order hand, for compounds with very low solubility the incorporation of the growth units into the crystal lattice is rate limiting, and the driving force for this process is given by cb-c*, since ci = cb. However, for the great part of the compounds both the diffusion through the crystal surface and the incorporation of the growth units into the crystal surface has to be taken into account. For very concentrated solutions, the transport of crystallization heat through the bulk phases becomes a third rate-limiting step (IPT, 1997).
2.4.5 The Mixed Suspension Mixed Product Removal (MSMPR) precipitator
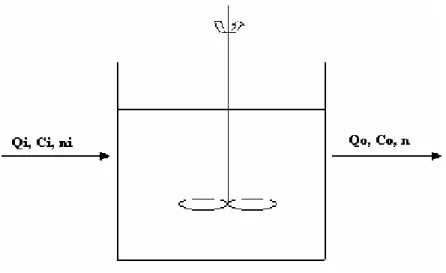
Figure 2.5 – Schematic representation of an MSMPR reactor of effective volume V (L) being fed by a solution of concentration ci (mol/L) at rate Qi (L/s) and suspension
discharge at rate Q0 (L/s) with solute concentration c0 (mol/L).
To describe the crystal size distribution in a crystallizer operating in a continuous regimen it is necessary to apply the laws of mass conservation, energy and number of crystals and further to quantify the kinetics of nucleation and growth of crystals (Söhnel and Garside, 1992). To consider steady state condition implies that the feed rate, composition, temperature and the crystallizer volume remain constant. If the system operates at steady state, the number of crystals in a specific size range must be kept constant without accumulation. Considering an arbitrary size range L1 to L2 in
the volume V, with population density n1 and n2 respectively, and that the growth rate
of crystals of size L1 is G1 and that of size L2 is G2; for a period of time t, the number
of crystals entering and leaving the reactor in this size range is given by equations 2.7 and 2.8, respectively (Randolph and Larson, 1998).
t
G
Vn
1 1∆
(2.7)t
G
Vn
2 2∆
(2.8)t
L
n
Q
i i∆
∆
_
(2.9)
where Qi the volumetric flow rate,
_
i
n is the average population density in the range L1
to L2 in the feed, and ∆L = L2 – L1. For the bulk flow of crystals, the size distribution is
given by t L n Q ∆ _ (2.10)
By combining the equations (2.7), (2.8), (2.9) and (2.10), the population balance in a steady state is given by
t
n
VG
t
L
n
Q
t
n
VG
t
L
n
Q
i i∆
∆
+
∆
=
∆
+
2 2∆
_
1 1 _
(2.11)
After a mathematical rearrangement and considering a system without seeds in the feed solution (ni=0), the population balance obtained for a MSMPR crystallizer becomes described by equation (2.12):
0
/
)
(
Gn
dL
+
n
=
d
Q
V
(2.12)
Assuming that G is not a L function and defining τ, the mean residence time, as V/Q, the equation becomes:
0
)
/
(
dn
dL
+
n
=
G
τ
(2.13)The equation (2.13) is integrated.
By defining nº as the population density of the embryo-size crystals and assuming that these crystals will be decrease close to zero, the solution of this integration gives
)
/
exp(
0τ
G
L
n
n
=
−
(2.15)The parameter nº is related to the nucleation kinetics according to equation (2.15) (Randolph and Larson, 1998).
G
n
B
0=
0 (2.16)So, equation (2.15) can be rewritten as
)
exp(
0τ
G
L
G
B
n
=
−
(2.17)This equation is widely used to analyze the behavior of MSMPR crystallizers. The equation indicates that when the mean residence time is increased, the average crystal size is also increased. However, this relationship is not simple. Although an increase in τ increases the time of crystal growth, it simultaneously causes the decrease of supersaturation, and hence of the growth rate. The average crystal size, which is proportional to the product Gτ, therefore increases less than does the value of τ. The supersaturation in the precipitator can not be established arbitrarily and an appropriate value to the particular feed concentrations, residence time, and kinetics of nucleation and growth is achieved (Söhnel and Garside, 1992).
In order to evaluate more adequately the results of experiments performed in a MSMPR crystallizer, equation 2.17 is rearranged as:
τ
G L G B
n −
A plot of ln(n) versus crystal size (L) gives the nucleation rate (Bº) by the intercept of the straight line on the Y-axis. The slope (−1/Gτ ) of provides the growth rate (G)
(Söhnel and Garside, 1992).
Some deviations in the MSMPR original assumptions may occur, due to mechanical (residence times that lead to attrition and breakage) or kinetic effects (slurry not ideally mixed, product classification removal, fines dissolution, particle agglomeration, size dependent growth and growth dispersion) (Mersmann et al., 2001). These deviations may affect the crystal size distribution as presented in Figure 2.6. In these cases the MSMPR crystallizer model can not be applied.
3 ARSENIC REMOVAL FROM DILUTE INDUSTRIAL EFFLUENTS BY SCORODITE PRECIPITATION
3.1 Introduction
As indicated in the literature review, the crystalline ferric arsenate, crystalline scorodite (FeAsO4*2H2O), has been considered as a preferable form for arsenic disposal because of its relatively high arsenic content and low solubility in water (typically smaller than 1mg/L arsenic at pH 5, when subjected to 24 hour toxicity characteristics leaching procedure – TCLP) (Filippou and Demopoulos, 1997). The relatively low Fe/As molar ratio (1:1 against approximately 4:1 in AsFH ), the smaller waste volume due to its higher density, and the good capacity of sedimentation offer additional advantages for this disposal process in comparison to the conventional ferrihydrite process (Debekaussen et al., 2001).
According to Krause and Ettel (1989) the solubility of this phase is about two orders of magnitude smaller than that of the amorphous ferric arsenate (FeAsO4.xH2O), expected to be found in arsenical ferryhydrites – AsFH, which is the most common form of arsenic disposal from mining effluents. The concentration of arsenic, 3-6% in arsenical ferrydrites, may be increased to about 25-30% in scorodite.
showed that above 175ºC, basic iron sulfate and Type-2 arsenate are formed, from a mixture of iron(III) sulfate and As(V) solutions, with a high sulfate to iron molar ratios. On the other hand, at lower temperatures (150-175ºC) scorodite predominates. Papangelakis and Demopoulos (1990) showed that scorodite is one of the main products of the aqueous pressure oxidation of arsenopyrite in sulphuric acid solution (0.5mol/L), after 2 hours and temperatures of 130 to 180ºC. The high costs of a hydrothermal operation make this process economically attractive only if it can be combined with the processing of a valuable concentrate, such as gold.
Figure 3.1 – Supersaturation control area for atmospheric precipitation of scorodite, where Ceq is the equilibrium concentration and Ccr is thecritical supersaturation (95ºC,
Fe:As = 1.0, and sulfate media) (Demopoulos, 2005).
According to Figure 3.1, the equilibrium line (Ceq) and the critical supersaturation line
(Ccr) defines a working region for scorodite precipitation, as a function of pH and
arsenic concentration [As]. The pH is the most important variable in this process. A fast increase in pH will result in high supersaturation, which is unwanted. The conditions at the critical supersaturation line (Ccr) must not be exceeded, and this limit
is defined by the induction pH, and corresponds to the pH in which the homogeneous nucleation will occur (Fillipou and Demopoulos, 1997). According to Singhania et al. (2006) the solution pH is raised up to the induction pH and once the precipitation of an amorphous phase had been noted, H2SO4 is added in the system to clear the solution. Thus, a pH lightly below the induction pH is assured. Therefore, a more practical way to adjust supersaturation is needed.
kinetics, and that more than 90% of arsenic was removed from solution in three hours as crystalline scorodite. The scorodite seeds were produced from nitrate solution in an autoclave at 150ºC. Wang et al. (2000) also studied scorodite precipitation in sulfate media. It was shown that the arsenic removal increases with the increase of seeds concentration. In the absence of seeds, the crystallization was found to be slow and inefficient. These authors showed that about 90% of the initial 10g/L of arsenic present in the solution was precipitated in the first hour, using 160g/L of seeds. The experiments were carried out at 95ºC, Fe/As molar ratio of 1:1 and pH 0.9, in two hours of reaction. Caldeira et al. (2005) showed that 200g/L of scorodite seeds were needed to assure 80% arsenic removal from an industrial solution with 1g/L of As. The initial seeds were produced at 95ºC for 12 hours. It is not well understood the relationship between amount of seeds and surface area; thus it would be relevant to establish a selection criteria based on the primary variable affecting crystal growth – the specific surface area (SSA) - rather than on the empirical selection of the amount of seeds.
In some cases, the scorodite crystallization requires the addition of a neutralizing agent, and lime (CaO) or limestones (CaCO3) are the preferred ones owing to their relatively low cost (Demopoulos, 2005). The industrial solution presents sulfate that reacts with calcium thus forming gypsum, so it became interesting to test gypsum efficiency as seed material for scorodite precipitation. Wang et al. (2000) and Singhania et al. (2005) showed that hematite or gypsum, formed from the neutralization reaction with lime or limestone, can be used as seeds in the precipitation of scorodite. Demopoulos (2005) claim that either gypsum added from an external source or generated in situ by neutralization reactions are excellent seeding materials. The adopted experimental conditions by Demopoulos (2005) were initial arsenic concentration of 10g/L, iron arsenic molar ratio of 1:1, 95ºC and 2 hours of reaction. An important aspect about the use of gypsum seeds is that, according to Singhania et al. (2005), the gypsum decreases the TCLP solubility of the precipitates. The results obtained by these authors showed that the mixed gypsum/scorodite presents an arsenic leachability of 1 to 2 mg/L against 3mg/L of the pure scorodite.
50g/L and 100g/L. Wang et al. (2000) showed that arsenic concentration could be reduced from a solution of 10g/L, with an overall arsenic removal of 99.4%, in two stages, without pH control. Demopoulos (2005) worked at the same condition as Wang et al. (2000) and obtained an overall arsenic removal higher than 98%. Therefore, yields superior to 90% have been reported for arsenic removal from solutions of 10g As/L or higher. Caldeira et al. (2005) showed that 80% of arsenic could be removed in one stage from an industrial solution containing 1.5g/L As. Wang et al. (2000) and Demopoulos (2005) reached an arsenic removal of only 11.4% and 7%, respectively, working with an initial arsenic concentration of approximately 0.5g/L in a second stage of precipitation. Therefore, it is not clear how the efficiency of arsenic removal varies with the initial arsenic concentration and what would be the concentration threshold for which the process would be competitive with ferrihydrite precipitation process.
Despite its potential advantages, the precipitation of scorodite at ambient pressure has not been implemented in industrial scale. Difficulties such as the cost of the reagents required for the oxidation of iron and arsenic in the treatment of large volumes of solutions and the difficulty in controlling pH (i.e. supersaturation) at high temperatures are probably some of the factors that explain the lack of industrial applications. As most of the reported studies were carried out with reagent-grade sources of arsenic and iron, it is not really clear how would be the performance of the process in comparison with the ferrihydrite precipitation for the treatment of more complex (multicomponent and diluted) solutions.
than on the mass of seeds. The effect of sulfate concentration and the performance of the gypsum seeds also are investigated. Finally, the solubility of the precipitated are evaluated according to the Toxicity Leaching Procedure -TCLP (EPA, 1992).
3.2 Experimental Procedure
An industrial solution containing 1.1 g/L As (Astotal = 1.1g/L; As(III) = 0.96g/L; Fetotal = 0.15g/L, Fe(II) = 0.13g/L; pH = 2.3; SO4
2-
= 2.85g/L; Cu = 7.6mg/L; Ni = 0.51mg/L; Mn = 25.1mg/L) and Fe/As molar ratio equal to 0.2, provided by AngloGold Ashanti, Nova Lima (MG), was used as the feed solution. Firstly, it is necessary an oxidation step of iron and arsenic present in the solution. According to Debekaussen et al. (2001) this oxidation must be carried out at high temperature and controlled addition of hydrogen peroxide (H2O2). However, Caldeira et al. (2005) showed that the oxidation is not significantly affected by the temperature, and with a controlled addition of H2O2 a complete iron and arsenic oxidation is observed in 20 minutes. In this work the oxidation was carried out in a stirred reactor and ambient temperature according to the conditions established by Caldeira et al. (2005). Ferrous sulfate or ferric chloride salts were added to the system in order to adjust the Fe/As molar ratio to 1, which is required for the formation of scorodite. After the Fe/As ratio was adjusted, hydrogen peroxide was added (1.75mol/L, 20% stoichiometric excess) in a amount to assure the total oxidation of Fe(II) and As(III). The pH was kept at 1.2 (mensured at 25ºC), with the addition of concentrated H2SO4, in order to avoid the precipitation of the amorphous arsenate phases.
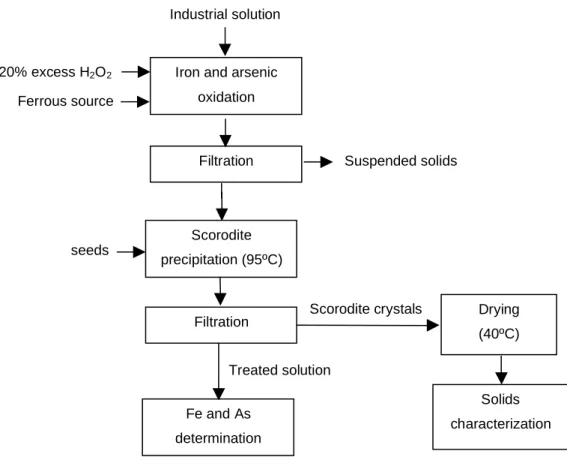
Following the oxidation of Fe(II) and As(III) and seeds production, the experiments of batch precipitation were carried out in a stirred reactor (1L). The temperature was maintained at 95ºC while the Fe/As molar ratio was within a range of 0.9 to 1.2. After a reaction time of two hours, the solids were vacuum filtered and the solution was diluted using 50µL of concentrated nitric acid to prevent the formation of amorphous solid material. A comparative study of scorodite and gypsum seeds (calcium sulfate P.A -CaSO4*2H2O) was also carried out. The effects of the initial arsenic concentration and sulfate concentration on arsenic removal have been evaluated as well. A schematic flowsheet of the process is shown in Figure 3.2.
20% excess H2O2
Ferrous source
Drying
(40ºC)
Solids
characterization Industrialsolution
seeds
Iron and arsenic
oxidation
Filtration
Scorodite
precipitation (95ºC)
Filtration
Fe and As
determination
Suspended solids
Treatedsolution
Scoroditecrystals
Figure 3.2 – Block diagram of the experimental procedure in tests carried out in batch system.
The Astotal and Fetotal concentration were determined by atomic absorption spectrometry (Perkin Elmer AAnalyst 300), with the air/acetylene flame (wavelength of 328.1nm and 248.3nm for Astotal and Fetotal, respectively). The SO4
obtain the MEV images, the samples were covered with a carbon layer to assure the electron conduction and heat dissipation.The particle size distribution and the specific surface areas were determined by laser scattering (Cilas 1064) and nitrogen adsorption (Quantachrome, model Nova 1200). Leaching tests were carried out in order to examine the solubility of the precipitates, according to the Toxicity Characterization Leach Procedure -TCLP tests, recommended by the US Environmental Protection Agency (EPA, 1992). This procedure was recently adopted as the ABNT NBR-10005/2004. Nevertheless, the maximum accepted limit for arsenic concentration in the extract (1.0mg/L) by the Brazilian standards (ABNT, 2004) is five times smaller than that allowed by the American standards. The determination of arsenic and iron concentrations in the extract was carried out by an ELAN 9000 ICP-MS instrument (Perkins Elmer SCIEX, Concord, Ontario, Canada).
3.3 Results and discussion
3.3.1 Effect of pH and Initial arsenic concentration
At fixed arsenic and iron concentrations, pH becomes the most important process variable, once it determines the supersaturation level in the system. An increase in supersaturation provides an increase in the driving force for precipitation, and consequently an increase of arsenic removal from solution. A general definition of relative supersaturation is provided by the equation:
eq
C
C
S
=
(3.1)where C is the solute concentration and Ceq the equilibrium solubility of the solute at
the temperature and pressure of the system.
O
H
AsO
H
Fe
H
O
H
FeAsO
s aq 3 4(aq) 23 ) ( ) ( 2
4
*
2
+
3
→
+
+
2
+
+ (3.2)
At a constant temperature and pH, S was calculated by
(
)
2 eqAs Fe As C C CS = (3.3)
where CAs and CFe are the arsenic and iron concentrations and the CeqAs is the equilibrium concentration of arsenic in the adopted pH, according to the literature (Demopoulos, 2005).
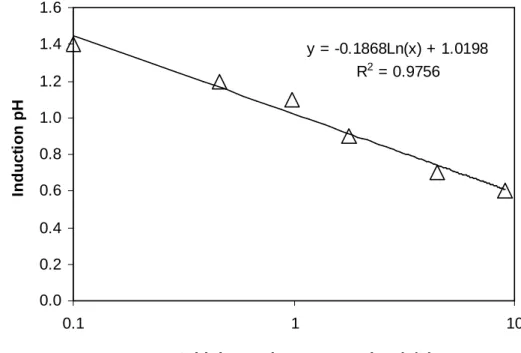
The pH is expected to decrease during scorodite precipitation owing to the production of sulfuric acid (Eq. 3.2). The variation becomes less evident at low arsenic concentration. Demopoulos (2005), Singhania et al. (2005) and Singhania et al. (2006) showed that once the precipitation has been initiated, the control of pH becomes unnecessary. According to these authors, the pH control even slows down the reaction rate by the formation of amorphous phases in areas with high local supersaturation. The formation-redissolution of these amorphous phases is believed to decrease the process rate (Singhania et al., 2006). Thus, it is important to define an initial pH that guarantees that the reaction will occur within the working region defined in Figure 3.1. The literature describes values for the induction pH at 95ºC (Figure 3.1). In order to adjust the pH, a complex procedure involving the dissolution of the initial precipitates is described in the literature (Singhania et al., 2006).
In the present work, pH was measured at ambient temperature. The so-called adopted pH is the one, close to the induction pH, that did not cause the precipitation of solids with the elevation of the temperature. A “practical” critical supersaturation line (Ccr), defined by an induction pH measured at ambient temperature, was established
related to the Si values as each experiment was carried out under different pH condition. The largest Si value corresponds to the adopted pH closest to the induction pH. Supersaturations in a range of 1.3 - 7.3 were found under equilibrium conditions (t> 1h). The critical supersaturation value was not exceeded in any condition.
Table III.I – Removal obtained at different initial arsenic concentration (seeds concentration = 40g/L, T = 95ºC).
[As]i (g/L)
Induction pH1
(95ºC)
Adopted pH
(25ºC)
Removal (%) Si Scr
0.1 2.3 1.6 94.6/89.0 8.1 75
0.5 1.8 1.1 80.5 4.1 85
1.1 1.5 1.1 93.8/92.4 9.9 100
2.4 1.3 1.2 86.3 46.5 100
10.0 0.9 0.6 90.2 19.8 60
1 Demopoulos (2005).
The effect of the initial arsenic concentration was investigated within a range from 0.1 to 10 g/L. Less concentrated solutions were prepared by dilution of the original industrial solution (1.1g/L As). Sodium arsenate (Na2HAsO4.7H2O) was added to increase arsenic concentration at levels higher than that in the original solution. The pH was adjusted according to the initial arsenic concentration.
precipitation. Furthermore, the fine amorphous ferryhydrite may be recycled as seeds to the scorodite reactor. Thus, an industrial waste more stable and with larger arsenic concentration can be formed, in comparison with the traditional ferrihydrite process. Furthermore, both the waste volume and the associated costs with the final residue disposal can be reduced.
y = -0.1868Ln(x) + 1.0198 R2 = 0.9756
0.0 0.2 0.4 0.6 0.8 1.0 1.2 1.4 1.6
0.1 1 10
Initial arsenic concentration (g/L)
In
d
u
c
ti
o
n
p
H
Figure 3.3 – Critical supersaturation line (Ccr), defined by an induction pH measured at
0.0 2.0 4.0 6.0 8.0 10.0
0.00 0.50 1.00 1.50 2.00
Time (h) A rs e n ic C o n c e n tr a ti o n ( g /L )
10g As/L 2.4 Asg/L 1.1g As/L 0.5g As/L 0.1g As/L
0.0 0.1 0.2 0.3 0.4 0.5 0.6
0.00 0.50 1.00 1.50 2.00
Time (h) A rs e n ic C o n c e n tr a ti o n ( g /L )
Figure 3.4 – Scorodite precipitation at different initial arsenic concentrations (T = 95ºC, scorodite seeds concentration = 40g/L).
3.3.2 Effect of seed concentration
These results agree with the findings of Wang et al. (2000) and Singhania et al. (2005), however the effect was more pronounced with the concentrated solutions used in those studies. At an initial arsenic concentration of 10g/L, Wang et al. (2000) showed that the removal decreased from 85 to 60% when the seed concentration decreased from 80 to 20g/L and further to 45% when only 10g/L of seeds were used. Singhania et al. (2005) also observed the dependence of seed concentration in the removal of arsenic, and showed that the same efficiency was obtained when 160g/L of atmospheric seeds and 20g/L of hydrothermal seeds were used. According to these authors, this difference can be attributed to differences in surface area and crystallinity, but quantitative parameters were not provided.
0.00 0.20 0.40 0.60 0.80 1.00 1.20 1.40
0.00 0.50 1.00 1.50 2.00
Time (h) A rs e n ic c o n c e n tr a ti o n ( g /L )
5g/L 10g/L 20g/L 40g/L 80g/L
Figure 3.6 shows the arsenic removal as a function of the total seed’s surface area (specific surface area x seeds concentration). As it can be observed, a surface area higher than 270m2 is necessary to promote an arsenic removal of about 85% from a solution with 1g As/L. This area corresponds to a seed concentration of 20g/L. Previous studies did not report values of specific surface areas of the seeds used in scorodite precipitation, thus making it difficult a comparison of the different seed concentrations. We mensured the specific surface area of the scorodite used by Caldeira et al. (2005); the initial scorodite seeds were obtained at 95ºC in 12 hours. The low value found (0.9m2/g) explain the relatively large concentration of seeds (200g/L) required in that study, and its restrict capacity of to act as precipitation nuclei. The results obtained in this work agree with the findings of Caldeira et al. (2005), which used a surface area lower than 175m2 and obtained an arsenic removal of 80% (Figure 3.6).
65.00 70.00 75.00 80.00 85.00 90.00
69.5 269.5 469.5 669.5 869.5 1069.5 1269.5 Surface area (m2/g As in the solution)
A
rs
e
n
ic
r
e
m
o
v
a
l
(%
)
(Caldeira et al. , 2005)
3.3.3 Comparison of gypsum and scorodite seeds
Gypsum (CaSO4*2H2O) is a common and often a major by-product in the precipitation of arsenic from sulfate solutions. The performance of gypsum seeds was compared with that of scorodite in experiments carried out with three levels of initial arsenic concentration (1.1, 2.4 and 10g/L), and pH 0.9, 1.2 and 0.6, respectively, and seeds concentration of 40g/L (Figure 3.7). The experimental conditions were selected according to the solubility curve shown in Figure 3.1 and the initial supersaturation was found as approximately 10, 45 and 20, respectively. The equilibrium condition was reached in a supersaturation range of 25 -1.3. The tests with an initial arsenic concentration of 10g/L were carried out for four hours.