ISSN 1 5 1 7 - 7 0 7 6
Revista Matéria, v. 11, n. 1, pp. 48 – 59, 2006 http://www.materia.coppe.ufrj.br/sarra/artigos/artigo10695
Mathematical Modeling for Computational Simulation of the
Temperature Distribution During the Synthesis of Polycrystalline
Diamond
João José de Assis Rangel1, Sergio Neves Monteiro2, Guerold Sergueevitch Bobrovnitchii2 1
Universidade Candido Mendes, UCAM-Campos-NPDI - Rua Anita Pessanha, 100, Campos dos Goytacazes/RJ CEP: 28040-320.
e-mail: [email protected] 2
Universidade Estadual do Norte Fluminense - UENF / Laboratório de Materiais Avançados - LAMAV- Av. Alberto Lamego 200, Campos dos Goytacazes/RJ, CEP: 28013-600
e-mail: [email protected], [email protected]
ABSTRACT
The properties and structural characteristics of polycrystalline diamonds synthesized at high pressure and high temperature are strongly influenced by the distribution of temperature inside the reaction chamber. This distribution cannot be directly measured during the graphite to diamond transformation. In this work a mathematical model associated with a computational analysis was developed to simulate the chamber, point to point, temperature distribution throughout the synthesis process. The simulation results obtained are in agreement with experimental data found in the literature. Moreover, it was possible to explain the restriction that exists regarding the use of graphites with different densities.
Keywords: mathematical modeling, simulation, temperature distribution, high pressure, polycrystalline diamond.
1 INTRODUCTION
For more than half century, synthetic diamonds have been successfully produced for a large range of technological applications. This synthesis is, today, a well known process associated with a system capable of simultaneously generating the high pressure and high temperature, HPHT, necessary to produce diamond from graphite in the presence of a catalyst metallic alloy [1]. The graphite to diamond transformation, G→D, is usually performed at pressures and temperatures that may reach, respectively, 6 GPA and 2000 K. These severe conditions require a special high pressure device, HPD, that takes the load from a press equipment and converts it to the high pressure inside a reaction chamber where the G→D transformation takes place. The high temperature, which is also necessary for this transformation, is attained via the heat generated by an electrical current established from an applied voltage. In the past, studies have investigated the association of the voltage with the temperature established inside high pressure equipment [2, 8, 10].
of a synthetic polycrystalline diamond (SPD). A system called “simulator and graphical user interface - GUI”, was specially developed to allow a visual interpretation and the analysis of the temperature profile during the computational simulation. This simulation of the distribution of temperatures inside the reaction chamber considered not only the applied electrical voltage but also the diffusion of catalytic alloy and the G→D phase transformation.
2 PHYSICAL DESCRIPTION
The physical characteristics and experimental procedure associated with the synthesis of polycrystalline diamonds can be described as followed. A specific arrangement known as the reactive cell, composed of graphite and catalytic alloy, is submitted to HPHT conditions corresponding to the thermodynamic stability of diamond. These processing conditions are attained inside the central chamber of a HPD installed in a hydraulic press [10]. As the heat builds up and the alloy melting temperature is reached, the metallic liquid penetrates the graphite pores catalyzing the G→D transformation [1].
The duration of this process is relatively short, between 5 to 10 sec, which corresponds to the period of time that the liquid alloy takes to penetrate into the graphite pores [11].
The main source of heat to attain the necessary temperature is an electric current that flows through the graphite heater sleeve placed inside the chamber and around the reactive cell. The bulk graphite in the cell arrangement, which will transform into diamond, also participates in the heat generation as a conducting material. However, as the G→D transformation proceeds, the temperature in the reactive chamber decreases due to the insulating nature of diamond. Eventually, the temperature falls bellow the alloy melting point and the transformation ceases owing to lack of liquid contact with the porous graphite. Normally, this interruption is prevented by another source of heat. The G→D transformation is associated with an exothermic effect that liberates more heat and keeps the processing temperature close to the thermodynamic line of equilibrium [11].
The rapid penetration of metallic liquid into the graphite pores is a consequence of the applied high pressure. Since the graphite pores are originally filled with air, the corresponding internal pressure will be much lower than that of the applied processing pressure [11]. This generates a pressure gradient that favors the molten alloy’s penetration with hardly any resistance. As the molten alloy penetrates the pores, micro cracks are dynamically being formed in the graphite. This is mainly a consequence of the difference in both density and stiffness between the graphite and the diamond phase, which replaces it. These micro cracks contribute to the G→D transformation by making, the molten alloy penetration into the graphite even easier.
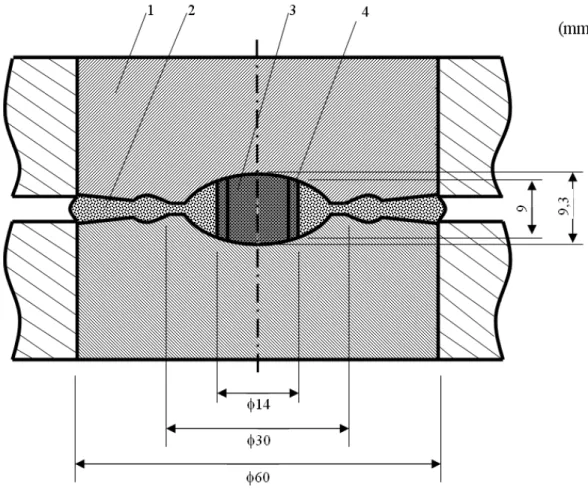
Figure 1 presents the draft of an axial section of the actual HPD considered in this work. The toroidal anvil type HPD is shown in Fig. 1 in its compressed state. In this figure one should notice the previously mentioned reactive cell with its graphite heater sleeve. It is also important to bear in mind that the cell is thermally insulated only in its lateral side by a lithographic stone gasket, which has low thermal conductivity. The upper and lower contacts with the metallic anvil provide an efficient medium for heat dissipation. This physical characteristic promotes high temperature gradients inside the HPD [1]. Constructive design variations can minimize these gradients both in the cell and the anvil [7]. The temperature gradients that are established in the reactive cell directly influence the characteristics of the synthesized diamonds, while the gradients in the anvil affect the system working life. The contact region between the anvil and the reactive cell is subjected to the highest temperatures and corresponding greatest gradients. This is considered the most critical region of the system. [11]
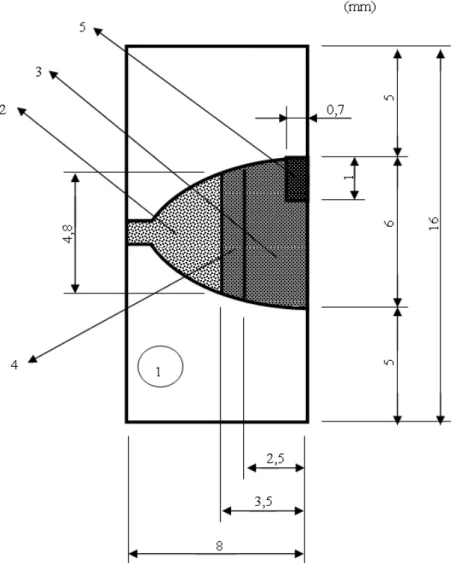
Figure 2 shows in greater detail the central part of the HPD. Due to the cylindrical symmetry of this device, only half of its chamber is needed for the present simulation. However, the mathematical analysis to be further developed, will take into consideration the whole volume of the chamber.
3 MATHEMATICAL ANALYSIS
The mathematical model to simulate the temperature profile inside the chamber in Fig. 2 deals with the particular problem of determining the basic equation that governs the heat conduction and the distribution of electric potential. The metal diffusion through the graphite pores, the resulting G→D transformation and the exothermic effect generated by the phase transformation, which occurred during the synthesis, were also considered in the mathematical modeling.
Figure 3 shows the matrix of discrete elements as well as its position with respect to the spatial axes for the chamber in Figure 2.
Figure 3: Typical computational grid and associated control volumes.
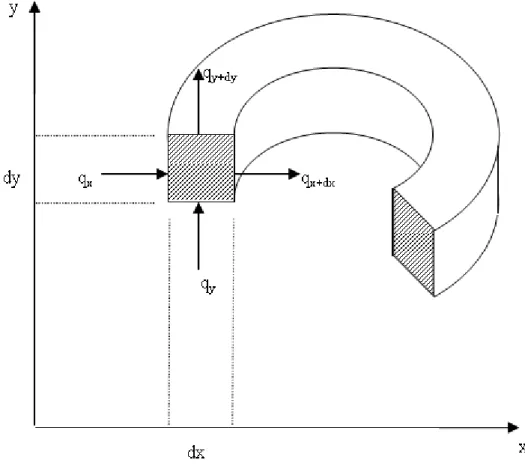
Figure 4: Typical control volume.
Due to the cylindrical symetry of all elements in Fig. 3, the level of complexity of the problem can be reduced to a two dimensional equation. The following basic hypothesis were made in the elaboration of the mathematical model.
a) Two-dimensional conduction process. This greatly simplifies the calculus without compromising the precision of the results. In this case, however, the material properties along the ring associated with the volume element in Fig. 4 must be constant. Actually, this is a characteristic of polycrystalline materials, such as the graphite and diamond in the present work. This modelling approximation, as well as others that will be referred later in this work, are in accordance with the experimental physics of the system.
b) Constant input and output areas of heat flow. This is valid for very small elements such as those assumed in the present work. Actually, by considering the average cross section area along the element axis in Fig. 4, only a second order error is expected to occur.
c) Graphite and diamond properties not affected by the presence of metallic alloy. This assumption is very close to reality since the maximum possible amount of alloy in the graphite and diamond pores is very small. d) Constant graphite and diamond densities throughout the process.
e) No layer of diamond inhibiting compound, such as NB, between the reactive cell graphite and the heater sleeve.
f) No contact electrical resistance between the metallic anvil and the graphite in both, the reactive cell and the heater sleeve.
g) Constant applied pressure throughout the synthesis process.
∫
∫
=
•+
•∂
∂
v s vdv
q
Q
dv
t
T
c
.
.
.
.
ρ
(1) Where:
ρ
: density of the mediumc
: specific heat;T
: temperature;t
: time;v
: volume;•
Q
s: net heat flow;•
q
: distributed sources or energy sinks.The left side term in Eq. (1) represents the change in the internal energy within the element. The first term in the right side of Eq. (1) corresponds to the heat flow, while the second term is associated with the heat generated inside the element. In the particular case of this work, the heat is generated by an electrical power source.
The net heat flow,
•
Q
s, is the difference between the input and output heat flowing through the element. In terms of two-dimensional space coordinates, this case can be represented by:For the x direction:
Q
xq
xq
x+dx•
−
=
(2)For the y direction:
Q
yq
yq
y+dy •−
=
(3)According to the:
x
T
A
.
k
q
x∂
∂
−
=
dx x dx xx
T
A
.
k
q
+ +∂
∂
−
=
And:y
T
A
.
k
q
y∂
∂
−
=
dy y dy yy
T
A
.
k
q
+ +∂
∂
−
=
Where: k is the thermal conductivity and A is the transverse sectional area.
The expression for the derivative of qx+dx and qy+dy is expanded in a Taylor series but only the first two terms of the series are considered. The substitution of Eqs. (2) and (3) in Eq. (1), gives:
m m dv q dy y T k y y T k Ay y T Ay k dx x T k x x T k Ax x T Ax k dv t T c . . . . . . . . 2 1 2 1 • + ⎥ ⎦ ⎤ ⎢ ⎣ ⎡ ⎟⎟ ⎠ ⎞ ⎜⎜ ⎝ ⎛ ∂ ∂ ∂ ∂ + ∂ ∂ + + ∂ ∂ − ⎥ ⎦ ⎤ ⎢ ⎣ ⎡ ⎟⎟ ⎠ ⎞ ⎜⎜ ⎝ ⎛ ∂ ∂ ∂ ∂ + ∂ ∂ + ∂ ∂ − = ∂ ∂ ρ (4) If one considers that the input area is equal to the output area for both x and y directions, then:
2 1 2 1
Ay
Ay
Ax
Ax
=
≅
m
m
dy
q
dv
y
T
k
y
Ay
dx
x
T
k
x
Ax
dv
t
T
c
.
.
.
.
.
.
2 2•
+
⎥
⎦
⎤
⎢
⎣
⎡
⎟⎟
⎠
⎞
⎜⎜
⎝
⎛
∂
∂
∂
∂
+
⎥
⎦
⎤
⎢
⎣
⎡
⎟⎟
⎠
⎞
⎜⎜
⎝
⎛
∂
∂
∂
∂
=
∂
∂
ρ
(5) If one considers an element of volume:dy
dx
x
dv
m=
2
.
π
.
.
.
(6)and the output areas:
dy
.
x
.
.
2
Ax
2=
π
(7)dx
.
x
.
.
2
Ay
2=
π
(8)By substituting Eq. (6), (7) and (8) in Eq. (5), one has:
dy
dx
x
q
dy
y
T
k
y
dx
x
dx
x
T
k
x
dy
x
t
T
dy
dx
x
c
.
2
.
.
.
.
2
.
.
.
.
2
.
.
.
.
.
2
.
.
.
.
.
π
π
π
π
ρ
⎥
+
•⎦
⎤
⎢
⎣
⎡
⎟⎟
⎠
⎞
⎜⎜
⎝
⎛
∂
∂
∂
∂
+
⎥
⎦
⎤
⎢
⎣
⎡
⎟⎟
⎠
⎞
⎜⎜
⎝
⎛
∂
∂
∂
∂
=
∂
∂
(9)Assuming “dx” and “dy” to be constant and “x”, the position of the element, as a function of the radius in the matrix represented in Fig. 3, then:
x
q
y
T
x
k
y
x
T
x
k
x
t
T
x
c
.
.
.
.
.
•+
⎟⎟
⎠
⎞
⎜⎜
⎝
⎛
∂
∂
∂
∂
+
⎟⎟
⎠
⎞
⎜⎜
⎝
⎛
∂
∂
∂
∂
=
∂
∂
ρ
(10)To calculate the heat generated in the interior of the volume element, the following equation will be used:
dy
dx
x
q
v
q
q
.
.
.
.
2
π
=
=
• (11)By substituting Eq. (11) in Eq. (10) and making the necessary simplification, one derives the equation that governs the problem under investigation.
dy
dx
q
y
T
x
k
y
x
T
x
k
x
t
T
x
c
.
.
.
2
.
.
.
.
π
ρ
⎟⎟
+
⎠
⎞
⎜⎜
⎝
⎛
∂
∂
∂
∂
+
⎟⎟
⎠
⎞
⎜⎜
⎝
⎛
∂
∂
∂
∂
=
∂
∂
(12)Where:
T
=
T
(
x
,
y
,
t
)
,k
=
k
(
x
,
y
,
t
)
,ρ
=
ρ
(
x
,
y
,
t
)
ec
=
c
(
x
,
y
,
t
)
This is a particular case of the general heat conduction equation that specifically applies to the present model. Equation (12) is actually a partial, bi-dimensional, non-linear differential equation for a heterogeneous solid, with its own heat source, which undergoes phase transformation.
Eq. (12) is associated with the following initial and boundary conditions illustrated in Fig. 3:
(
L
,
y
,
0
)
=
T
T
(
x
,
0
,
0
)
=
T
(
x
,
h
,
0
)
=
T
R ;Where h and L are, respectively, the height and the radius of the HPD, room temperature, q the heat source, k the thermal conductivity coefficient, c the specific heat and ρ the density.
R
T
To calculate the electrical potential distribution, Eq. (12) can be simplified by considering that the investigated region is free of electrical charges and is at steady state. Then, a more compact equation holds [11]:
0
y
V
x
.
k
y
x
V
x
.
k
x
⎟⎟
⎠
=
⎞
⎜⎜
⎝
⎛
∂
∂
∂
∂
+
⎟⎟
⎠
⎞
⎜⎜
⎝
⎛
∂
∂
∂
∂
(13)
Where: V is the electrical potential in volts and k is the electrical conductivity. Eq. (13) is associated with the following boundary conditions, as illustrated in Fig. 3:
(
x
,
y
V
V
=
)
k = k (x,y).
( )
x
,
0
0
V
=
V
( )
x
,
h
=
V
00
, 0
=
= L x
x
V
∂
∂
(condition for symmetry and insulation);
Where h and L are, respectively, the height and the radius of the HPD, V0 the applied voltage and k the electrical conductivity coefficient.
The mathematical model to simulate the flow of metallic liquid into the graphite pores used the Navier-Stokes equation. The application of this equation to the fluid mechanics of the molten metal penetration in the graphite resulted in a value of 0.6 mm/s, which is a good approximation for the experimental conditions. Penetrations of 3mm in 5s showed that the model was valid [11].
Computational simulation for the field of temperatures inside the high-pressure chamber, HPC, were performed for both, different voltages associated with the heating process and size of graphite pores. The voltage corresponds to the electric potential, V, in equation (13), while the size of the graphite pores is given by the radius, R, assuming spherical pores. The value of R affects the penetration velocity of the molten alloy through the graphite pores. This velocity can be calculated by equation [11].
t
2
P
R
l
η
Δ
=
(14)Where l is the penetration distance, ⎜ΔP⎜the differential pressure, assumed as 4GPa, η the dynamic viscosity, assumed as 0.1 Pa.s, and t is the processing time.
The heat generated at the reaction zone during the G→D transformation produces a change in temperature of ΔT= 340K [11].
The numerical solution of Eq. (12) and (13) was performed using the finite difference method together with the explicit interactive method, which considers the Tchebychev parameters [12]. Here it should be mentioned that the literature concerning this type of problem indicates that the most applied solutions are based on either the finite differences (FDM) or the finite elements (FEM) methods. The FEM is always recommended in cases of complex geometry. In this case, if the FDM is used, one would not expect much precision due to the approximations conducted on parts of the system with sinuous curves or corners. In many cases of numerical modeling, situations will exist in which either of these two methods may present advantages and disadvantages. Consequently, the application of one or another will depend on the particular situation [13].
4 COMPUTATIONAL SIMULATION RESULTS
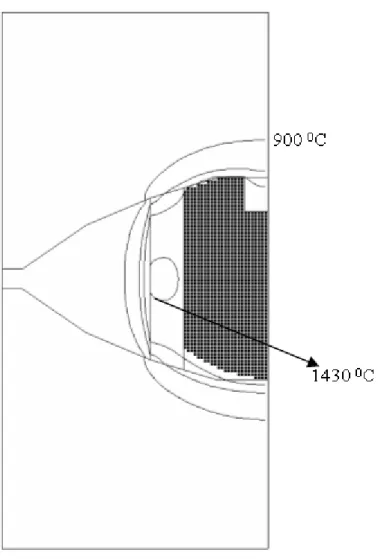
In the present simulation, three types of graphite were considered: graphite A with a pore radius of R, graphite B with R/2 and graphite C with 2*R. The importance of the graphite pore is that it exerts a significant influence, not only on the diamond transformation processing, but also in its properties. The influence on the properties is a consequence of the fact that the polycrystalline diamond inherits the morphological characteristics of the prior graphite including its porosity. For example, the larger the graphite pores, the greater the amount of metal that will be retrained in the diamond structure. Figures 5 to 7 exemplify the field of temperature, through isothermal profiles, inside the HPC (only the left half is represented) for three different situations. One should notice that in each figure only four isothermal profiles – 900, 1200, 1300 and 14300C (eutectic temperature for the C-alloy system) – are simulated. It should also be noticed that the gray region corresponds to the transformed diamond body.
As far as the simulated results are concerned, a few points are worth mentioning. In Figure 5, using graphite B with a smaller pore size, R/2, and consequently a denser structure, the amount of transformed diamond, 40%, was comparatively small. This is rather surprising since the processing time of 9.0 s was the longest. However, a denser graphite makes the molten metal penetration more difficult and so becomes the critical factor regarding the rate of diamond transformation.
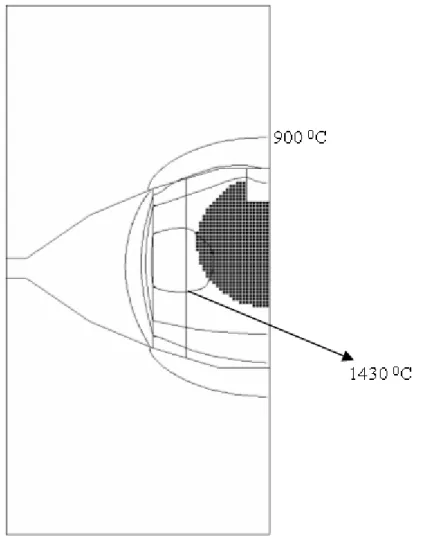
Figure 7: Temperature profile inside the HPD for graphite A. Applied voltage of 1.6V and 5.4 sec synthesis processing time.
Figure 6 presents the simulation result using graphite C with lower density and greater pore size, R*2. In this case a high rate of G→D transformation, 92%, was attained at a very fast processing time of 2.1 s. This is apparently a consequence of the facility with which the molten metal penetrates into the graphite’s large pores. However, in practice, it is not convenient to synthesize polycrystalline diamonds with a great amount of metallic alloy in their structure. In industrial processes there is an optimum rate of G→D transformation, close to 70%, which can be obtained with a well-defined graphite density [11].
Figure 7 presents the simulation result using graphite A, which has an intermediate pore size with radius R. For this simulation the amount of transformed diamond was 69% in association with a processing time of 5.4 s. The simulation in Fig. 7 was the one that described the industrial situation in the most satisfactory way.
As a final remark, it should be emphasized that the simulation results in Figs. 5 to 7 showed clear evidence of a relation between the rate of diamond transformation and the density of the precursor graphite. If this relation is not taken into account, the industrial parameters required for diamond production may not attend the recommended commercial characteristics of SPD.
5 CONCLUSIONS
Through the analysis of the computational simulation results, it was possible to infer the need to use a graphite with a well defined density. For industrial purposes, the use of a graphite with the correct density assumes that the SPD will attend the required commercial standards.
The simulated and graphical user interface - GUI system, enabled the visual accompaniment of the temperature distribution during the synthesis stages: initial heating, metallic diffusion into the graphite and diamond transformation. This computational system was useful, not only in determining the temperature profile, but also in helping the graphical analysis of the behavior of the process parameters as well as the way they influence the temperature distribution during the diamond synthesis.
6 ACKNOWLEDGEMENTS
The authors acknowledge the support provided to this investigation by the Brazilian agencies: CNPq, CAPES and FAPERJ.
7 REFERENCES
[1] BUNDY, F.P., “The Pressure-Temperature Phase and Reaction Diagram for Carbon”, Mat. Res. Soc. Symposium, v. 383, pp. 3-20, Materials Research Society, 1995.
[2] ELYUTIN, V.P., POLIAKOV, V.P., MELIKHOV, V.I., “Determination of the Temperature Profile in a High-pressure Apparatus”, Sov. Phys. Dokl., v. 32, n.4, pp. 328-329, 1987.
[3] GOSMAN, A.D., LAUNDER, B.E., REECE, G.J., “Computer-Aided Engineering Heat Transfer and Fluid Flow”, John Wiley & Sons, Nova York, 1985.
[4] HOBSON, J.M., WOOD, N., MASON, P.J., “A New Finite-Difference Diffusion Scheme”, Journal of Computational Physics, 125, pp. 16-25, 1996.
[5] KRAVETS, P.I., “Mathematical Models for Heat Exchange Processes in High-Pressure Apparatus”, J. of Superhard Materials, v. 2, n. 19, pp. 10-17, 1997.
[6] LESHCHUK, A.A., NOVIKOV, A.V., MAYDONYUK, A.P., “Thermomechanical State of a HPA Reaction Cell at the graphite-to-diamond Phase Transition”, High Pressure Science and Technology, Proc. Joint XV AIRAPT and EHPRG Int. Conf. Warsaw, Poland, Sept 11-15 1995 - Singapore: world scientific publishing Co. Pte. Ltd, pp. 225-227, 1996.
[7] LEVITAS, V.I., IDESMAN, A.V., LESHCHUK, A.A., POLOTNYAK, S.B., “Numerical Modeling of Thermomechanical Processes High Pressure Apparatus Applied for Superhard Materials Synthesis”,
High Pressure Science and Technology, pp. 38-40, 1989.
[8] NOVIKOV, N.V., LEVITAS, V.I., LESHCHUK, A.A., “Numerical Simulation of Material Stability Zones in the Working Volumes of High Pressure Equipment”, Journal of Superhard Materials, v. 6, n. 4, pp. 3-8, 1984.
[9] NOVIKOV, N.V., LEVITAS, V.I., LESHCHUK, A.A., IDESMANA. V., “Mathematical Modeling of Diamond Synthesis Process”, High Pressure Research, v. 7, pp. 195-197, 1991.
[10] NOVIKOV, N.V., LEVITAS, V.I., SHESTAKOV, S.I., LESHCHUK, A.A., DUSHINSKAYA, G.B., “Simulation of Electrical, Temperature and Thermal-Stress Fields in a High-Pressure Apparatus by Finite Element Method”, Soviet Journal of Superhard Materials, v. 5, n. 3, pp. 3-8, 1983.
[11] POLIAKOV, V.P., NOJKINA, A.V., CHIRIKOV, N.V., “Diamonds and Superhard Materials”, Moscow Metallurgy (in Russian ), Moscow, 1990.
[12] SAMARSKII., A.A., VABISHCHEVICH, P.N., “Computational Heat Transfer: The Finite Difference Methodology”, John Wiley & Sons, v. 2 - Nova York, 1996.