201
Metallurgy and materials
Metalurgia e materiais
Abstract
The thermodynamic optimization of Ti-X-Si systems requires that their respec-tive binary systems be constantly updated. The most recent assessments of the Ti-Si phase diagrams used three sublattices to describe the Ti5Si3 phase. The stable version of this phase diagram indicated the presence of Ti(β)+Ti5Si3→Ti3Si and Ti(β)→Ti(α)+Ti3Si reactions in the Ti-rich corner, while the metastable version featured the presence of a Ti(β)→Ti(α)+Ti5Si3 reaction. The present investigation assessed these phase diagrams using two sublattices to describe the Ti5Si3 phase in order to simplify the optimization of Ti-X-Si systems.
Keywords: phase diagram; Ti-Si phase diagram; thermodynamic modeling; Ti5Si3
phase; sublattice model.
Marina Fiore Mestranda
Universidade de São Paulo - USP
Escola Politécnica da Universidade de São Paulo Engenharia Metalúrgica e de Materiais
São Paulo - São Paulo – Brasil [email protected]
Flávio Beneduce Neto Professor
Universidade de São Paulo - USP
Escola Politécnica da Universidade de São Paulo Engenharia Metalúrgica e de Materiais
São Paulo - São Paulo – Brasil [email protected]
Cesar Roberto de Farias Azevedo Professor
Universidade de São Paulo - USP
Escola Politécnica da Universidade de São Paulo Engenharia Metalúrgica e de Materiais
São Paulo - São Paulo – Brasil [email protected]
Assessment of the Ti-rich
corner of the Ti-Si phase
diagram using two sublattices
to describe the Ti
5
Si
3
phase
http://dx.doi.org/10.1590/0370-44672016700073
1. Introduction
There is a technological inter-est in the Ti-Si system promoted by the beneicial effect of Si addition for the oxidation and creep resistance of Ti-X-Si alloys (Azevedo, 1996). The ear-liest Ti-Si experimental phase diagram was obtained in 1952 (Hansen et al.,
1952), indicating in the Ti-rich corner the presence of a eutectoid reaction at 1133K, Ti(β) → Ti(α) + Ti5Si3. In 1954, another work conirmed the presence of this eutectoid reaction at 1129K (Sutcliffe, 1954). In 1970, a new experimental ver-sion of this phase diagram was proposed (Svechnikov et al., 1970), indicating
in the Ti-rich corner the presence of two new reactions (a peritectoid reac-tion at 1444K, Ti(β) + Ti5Si3 → Ti3Si and a eutectoid reaction at 1133K, Ti(β) → Ti(α) + Ti3Si), instead of the eutectoid reaction previously observed.
In late 70´s, however, careful investiga-tions of the eutectoid reaction of the Ti-Si system were performed without showing any evidence on the presence of the Ti3Si phase (Plitcha et al. 1977;
Plitcha and Aaronson, 1978). They conirmed instead the presence of Ti5Si3 phase at 1148K, Ti(β) → Ti(α) + Ti5Si3. The irst thermodynamic assessment of the Ti-Si phase diagram was performed in 1976 (Kaufmann, 1976) considering the Ti5Si3 phase as a stoichiometric intermetallic. Murray (Murray, 1987) assessed the Ti-Si system assuming the Ti5Si3 phase as a non-stoichiometric phase and the calculated phase diagram was in agreement with one of the previ-ous results (Svechnikov et al., 1970). In
1996, Seifert et al. (Seifert et al., 1996)
employed an optimization method for the determination of the variables
used for the thermodynamic descrip-tion of the phases in order to assess the Ti-Si phase diagram from selected experimental data. They described, for instance, the Ti5Si3 phase as a non-stoichiometric compound containing three sublattices, (Ti)3(Ti,Si)2(Si,Ti)3, to represent its D88 crystal structure. Their calculated phase diagram was in good agreement with previous calculated (Murray, 1987) and experi-mental (Svechnikov et al., 1971) phase
202
presence of Ti5Si phase (instead of Ti3Si) after long isothermal heat treatments below the eutectoid temperature. By contrast, the presence of Ti3Si phase was observed by other investigations (Kozlov and Pavlyuk, 2004; Ramos
et al., 2006; Costa et al.; 2010; Li et
al., 2014). In 2010, the stability of
in-termetallic phases in the Ti-Si system
was studied by ab-initio calculations, indicating that the stability of Ti3Si phase was controversial (Colinet and Tedenac, 2010). Recent ab-initio cal-culation showed that Ti5Si3 phase was actually more stable than Ti3Si phase at 0 K (Poletaev et al., 2014).
The present work will calculate and compare the Ti-rich corner of the stable
and metastable Ti-Si phase diagrams, using two sublattices, (Ti,Si)5(Si,Ti)3, to describe the Ti5Si3 phase, assuming that Ti3Si is the stable phase in the eutectoid decomposition of Ti(β) phase. These results will be compared to previous calculated phase diagrams using three sublattices to describe the Ti5Si3 phase (Cost, 1998; Fiori et al., 2016).
2. Methodology
The liquid, Ti(α) and Ti(β) phases are described using Equations 1 to 5. The Gibbs free energy of reference (Gref)
is described by Equation 2, while the Gibbs free energy of the ideal solution
(Gid) is described by Equation 3 and the
excess Gibbs free energy (Gex) of the
regular solution is described using the Redlich-Kister polynomial (see Equa-tions 4 and 5) [23]. Additionally, the Gibbs energy for formation of the stoi-chiometric Ti3Si phase is described using
the Kopp-Neumann rule (see Equation 6) and the non-stoichiometric Ti5Si3 phase is described by the Compound Energy Formalism (Lukas, 2007), using a two-sublattices containing Ti and Si, see Equations 7 to 10.
G
phase= G
ref+ G
id+ G
ex (1)(2)
(3)
(4)
(5)
(6)
(7)
(8)
(9)
(10)
G
ref= x
Si.G
ref
+ x
Ti.G
ref
Si Ti
Where: Giref = G i
SER and x
Si and xTi are the molar fraction of the elements.
G
id= R.T.[ x
Si
.lnx
Si+ x
Ti.lnx
Ti]
G
ex= x
Si
. x
Ti.L
phaseWhere: Lphase is the Ti-Si interaction parameter in the phase.
L
phase= L
0phase+ L
1phase. (x
Si- x
Ti) + ... + L
vphase. (x
Si- x
Ti)
vWhere: Lv
phase = a+b.T+...
form
G
TiSi
- x
Ti. G
ref
- x
Si. G
ref
= a + b.T + c.T.ln (T)
3Si Ti
G
TiSi
=
formG
TiSi
+
idG
Ti Si+
exG
Ti Si 5 3 5 3 5 3 5 3form
G
TiSi
= y’
Ti
. y”
Ti. G
Ti:Ti+ y’
Si. y”
Ti. G
Si:Ti+ y’
Ti. y”
Si. G
Ti:Si+ y’
Si. y” . G
Si:Si5 3 Ref Ref Ref Ref
Si
id
G
TiSi
= R. T. { 5. [y’
Si
. ln (y’
Si) + y’
Ti. ln (y’
Ti)] + 3. [y”
Si. ln (y”
Si) + y”
Tiln (y”
Ti)]}
5 35 3 5 3 5 3 5 3
5 3 5 3
+ y’
Ti.y’
Si.y”
Ti.y”
Si.L
(Ti, Si:Si,Ti)Where: yjn is the site fraction of the element (j) in the sublattice (n).
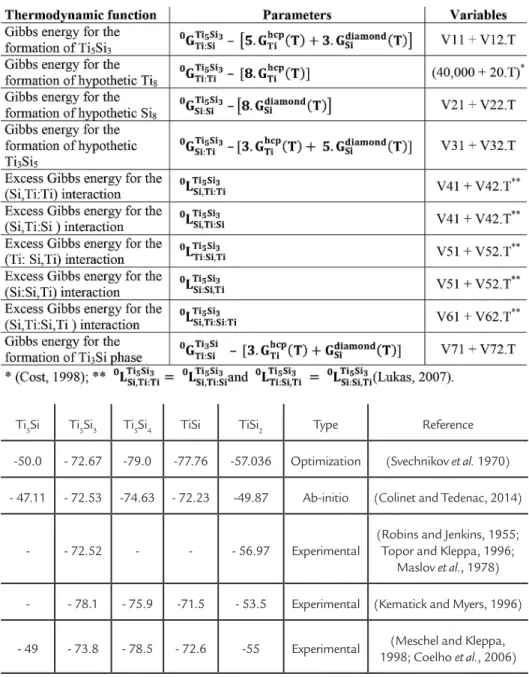
The parameters and variables used for the thermodynamic description of the Ti5Si3 and Ti3Si phases are listed in Table 1. These variables were calculated from selected experimental data (see Tables 2 and 3) using the Parrot module of the Thermo-Calc software. The variables
related to the Ti5Si3 phase were initially calculated during the assessment of the metastable phase diagram (suspending the presence of the Ti3Si phase). These variables were then ixed during the as-sessment of the stable phase diagram for the calculation of the variables related
to the Ti3Si phase. These diagrams were compared to the stable and metastable Ti-Si phase diagrams obtained by Thermo-calc software using COST 507 database (Cost, 1998), whose Ti-Si system was based on the assessed version by Seifert
203 Table 1
Parameters and variables used for the thermodynamic description of the Ti5Si3 - (Ti,Si)5: (Si,Ti)3- and Ti3Si phases. Vi1 in [J.(mol of phase)-1]; V
i2 in [J.(mol of phase) -1.K-1].
Ti3Si Ti5Si3 Ti5Si4 TiSi TiSi2 Type Reference -50.0 - 72.67 -79.0 -77.76 -57.036 Optimization (Svechnikov et al. 1970) - 47.11 - 72.53 -74.63 - 72.23 -49.87 Ab-initio (Colinet and Tedenac, 2014)
- - 72.52 - - - 56.97 Experimental
(Robins and Jenkins, 1955; Topor and Kleppa, 1996;
Maslov et al., 1978) - - 78.1 - 75.9 -71.5 - 53.5 Experimental (Kematick and Myers, 1996) - 49 - 73.8 - 78.5 - 72.6 -55 Experimental (Meschel and Kleppa,
1998; Coelho et al., 2006)
Table 2 Enthalpy for the formation of intermetallic
phases, Ti-Si system (kJ/mol of phase).
3. Results and discussion
The calculated values of the vari-ables are shown in Table 4. According to Thermo-Calc User Guide (Thermo, 2015), the order of magnitude of Vi1-type variables should not be higher than 105 and the Vi2-type variables should not be higher than 101. In the present
assessments V11 presented an order of magnitude above 105; and V52 above 101. This Vi2-type variable, however, was used to describe the excess term of the enthalpy rather than the entropy for the formation of intermetallic phases. The values of the reduced sum of squares
(~ 5 for both optimization procedures) exceeded the advisable maximum value of one (Thermo, 2015). These results indicate that the optimization procedures of the Ti-Si system using two sublattices to describe the Ti5Si3 phase were successful but they can be further improved.
Table 3 Experimental values of the Ti-Si invariant
204
Description Variables Calculated values Gibbs energy for the formation of Ti5Si3 V11 -592,126.51
V12 6.055 Gibbs energy for the formation of hypothetic Si8 V21 -36,405.66
V22 12.595 Gibbs energy for the formation of hypothetic Ti3Si5 V31 -15,172.13
V32 5.055 Excess terms, (Si,Ti:Ti) and (Si,Ti:Ti) interactions, Ti5Si3 V41 49,843.69
V42 -16.271 Excess terms, (Si:Si,Ti) and (Ti:Si,Ti) interactions, Ti5Si3 V51 -624.781
V52 335.78 Excess term, (Si,Ti:Si,Ti) interaction, Ti5Si3 V61 -226.340
V62 -14.165 Gibbs energy for the formation of Ti3Si V71 -200,788.05
V72 2.737
Table 4
Calculated variables, Vi1 in [J.(mol of phase)-1]; V
i2 in [J.(mol of phase) -1.K-1].
Table 5
Main experimental and
205
Table 5 compares the values of the experimental and the calculated equilibria and the enthalpies for the formation of Ti3Si and Ti5Si3 phases. Six out of the 38 calcu-lated values presented relative deviation above 5% in relation to the experimental data. Two of these deviations were
origi-nated in the equilibria involving the liquid phase and they could be decreased by the use of a more complex model for the ther-modynamic description of the liquid phase (Lukas, 2007; Seifert et al., 1996; Fiori et al.,
2016). The other values were found for the
β +Ti5Si3→Ti3Si, β→α+Ti3Si and β→α+Ti5Si3
reactions, indicating that further experi-ments in these critical regions of the Ti-rich corner of the Ti-Si phase diagram are needed to improve the results of the present opti-mization procedures; and to deine which one of the eutectoid reactions is actually the stable one (β→α+Ti3Si or β→α+Ti5Si3).
Figure 1-a shows a general view of the calculated stable Ti-Si phase diagram, indicating that the posi-tion of the phase boundaries are in fair agreement with previous results (Svechnikov et al. 1970; Fiore et al.
2016), except for the narrower solu-bility range of the Ti5Si3 phase ield. Figure 1-b shows a detail of the Ti-rich corner near the eutectoid reaction, in-dicating that there are no experimental data to validate the position of the calculated Ti(α) and Ti(β) solvus lines. The present assessment showed lower Si-solubility in the Ti(α) and Ti(β) phases when compared to the calcu-lated phase diagram using COST 507 database (Cost, 1998), without any change in the eutectoid temperature.
Figure 2-a shows the calculated metastable Ti-Si phase diagram, indi-cating that the position of the phase boundaries are in good agreement with previous experimental
(Han-sen et al, 1952; Sutcliffe, 1954) and
calculated (Fiore et al. 2016) phase
diagrams, except for the narrower
sol-ubility range of the Ti5Si3 phase ield. The shape of this phase ield resembles a previous result, which described the Ti5Si3 phase as Ti3Ti2(Ti,Si)3 (Ben-educe et al., 2016). Figure 2-b shows
a detail of the Ti-rich corner near the eutectoid reaction, comparing the present assessment with previous ex-perimental (Plitcha et al. 1977; Plitcha
and Aaronson, 1978) and calculated (Cost, 1998; Fiore et al. 2016) phase
diagrams. The present assessment showed smaller Si-solubility in the Ti(α) and Ti(β) phases when compared to the calculated phase diagram us-ing COST 507 database (Cost, 1998) and a slightly higher value for the eutectoid temperature. The slope of the Ti(α) solvus line showed a typical inclination, unlike the one obtained by COST 507 database (Cost, 1998), indicating that the Si solubility of the Ti(α) phase decreased with decreasing temperature. This result is agreement with the most recent assessment of the metastable Ti-Si phase diagram (Fiore
et al. 2016).
The position of the Ti5Si3 phase ield in both assessments was slightly shifted towards smaller Si contents. Additionally, its Si-solubility range was comparatively narrower and presented a maximum of 37.5at%. This maximum Si-solubility value sug-gests that the present thermodynamic description of the excess terms of the (Ti,Si)5(Si,Ti)3 phase was not able to induce the presence of Si atoms on the Ti sublattice. In this sense, the hypoth-esis that the interaction between Si and Ti on each sublattice is independent of the occupation of the other sublattice
, see
Table 1) should be further analyzed. For instance, another hypothesis, as-suming that the interaction parameters on the two sublattices are symmetrical , can
be investigated. Finally, the description of the Ti5Si3 phase using only two sublattices presented promising results for the assess-ment of Ti-X-Si phase diagrams.
Figure 1 Stable Ti-Si phase diagram. a) General view of the phase diagram (β+Ti5Si3→Ti3Si and β→α+Ti3Si reactions) compared with the latest assessment (Fiore et al., 2016); b) Detail of the eutectoid reaction, Ti(β)→Ti(α)+Ti3Si in the Ti-rich corner, compared with previous assessment by COST 507 database (Cost, 1998).
Figure 2 Metastable Ti-Si phase diagram. a) General view of the Ti-Si phase dia-gram (β→α+Ti5Si3 reaction) compared
with the latest assessment (Fiore et al., 2016); b) Detail of the eutectoid reaction, Ti(β)→Ti(α)+Ti5Si3, in the Ti-rich corner, compared with previous assessment by COST 507 database (Cost, 1998) with suspended Ti3Si phase.
LTi Si 5 3 Si,Ti:Ti 0 LTi Si 5 3 Ti:Si,Ti 0 LTi Si 5 3 Si,Ti:Si 0 LTi Si 5 3 Si:Si,Ti 0
= and =
( ) LTi Si 5 3 Si,Ti:Ti 0 LTi Si 5 3 Si,Ti:Si 0 LTi Si 5 3 Ti:Si,Ti 0 LTi Si 5 3 Si:Si,Ti 0
= and =
206
4. Conclusions
• The assessed versions of the
stable and metastable Ti-Si phase diagrams, using only two sublattices to describe the Ti5Si3 phase, were in fair agreement with previous experimental and calculated phase diagrams.
• The slope of the Ti(α) solvus line of the assessed metastable Ti-Si phase dia-gram showed a typical inclination, indicat-ing that the Si-solubility of the Ti(α) phase decreased with decreasing temperature.
• The position of the Ti5Si3 phase field in both assessments was slightly shifted towards smaller Si contents. Addi-tionally, its Si-solubility range was compar-ativelly much narrower than expected and presented a maximum value of 37.5at%.
• The assessment of the Ti-Si
phase diagram using two sublattices to describe the Ti5Si3 phase might be fur-ther improved by the inclusion of new experimental data near the eutectoid
reaction of the rich corner of the Ti-Si phase diagram. In this sense, further experimental work is needed to deine which eutectoid reaction (β→α+Ti3Si or
β→α+Ti5Si3) is stable.
• Finally, the use of a more com -plex description for the liquid phase and another thermodynamic description for the excess terms of the Ti5Si3 phase might be useful to improve the quality of the assessed phase diagrams.
Acknowledgments
The authors would like to thank the kind collaboration of Prof. V. Pas-toukhov, Prof. S. Wolynec, Prof. C. G. Schön and Prof. L.T.F. Eleno, all
from Universidade de São Paulo, and Dr. A. H. Feller. The present inves-tigation was funded by the Ministry of Education from Brazil
(Coordina-tion for the Improvement of Higher Education Personnel, CAPES) in a form of a MEng. scholarship to Ms. M. Fiore.
References
AZEVEDO, C. R. F. Phase diagram and phase transformations in Ti-Al-Si System. Imperial College, Department of Materials, 1996. (PhD Thesis).
AZEVEDO, C. R. F., FLOWER, H. M. Microstructure and phase relationships in Ti-Al-Si system. Materials Science and Technology, v. 15, n.8, p.869-877, 1999. AZEVEDO, C. R. F., FLOWER, H. M. Calculated ternary diagram of Ti–Al–Si
sys-tem. Materials Science and Technology, v. 16, p.372-381, 2000.
AZEVEDO, C. R. F., FLOWER, H. M. Experimental and calculated Ti-rich Corner of the Ti-Al-Si Ternary Phase Diagram. Calphad, v.26, p.353-373, 2002.
BENEDUCE NETO, F., FIORE, M., AZEVEDO, C. R. F. Simpliication of the ther-modynamic description of the Ti-Si system. Tecnol. Metal. Mater. Miner., v. 13, p. 91-97, 2016.
BULANOVA, M., TRETYACHANKO, L., AND GOLOVKOVA, M. Phase equili-bria in the Ti-rich corner of the Ti-Al-Si System. Z. Metallkd. v. 88, n. 3, p.256-265, 1997.
COELHO, G. C., DAVID, N., GACHON, J. C., NUNES, C. A., FIORANI, J. M., VILASI, M. Entalpias de formação de fases intermetálicas dos sistemas Ti–Si, Ti–B e Ti–Si–B medidas por calorimetria de síntese direta. In: CONGRESSO DA ABM, 61, Rio de Janeiro. Anais... São Paulo, Associação Brasileira de Metalurgia e Ma-teriais, 2006. p. 1300-1308.
COLINET, C., TEDENAC, J. C. Structural stability of intermetallic phases in the Si-Ti system. Point defects and chemical potentials in D88–Si3Ti5 phase. Interme-tallics, v. 18, p.1444-1454, 2010.
COST 507. Deinition of Thermochemical and Thermophysical Properties to Provide a Database for the Development of New Light Alloys. European Cooperation in the Field of Scientiic and Technical Research, European Commission. Proceedings of the Final Workshop of COST 507, Vaals, the Netherlands, 1998.
COSTA, A. M. S., LIMA, G. F., NUNES, C. A., COELHO, G. C., AND SUZUKI, P. A. Evaluation of Ti3Si phase stability from heat-treated rapidly solidiied Ti-Si alloys. Journal of Phase Equilibria and Diffusion, v.31, p.22-27, 2010.
FIORE, M., BENEDUCE NETO, F., AND AZEVEDO, C. R. F. Assessment of the Ti-rich corner of the Ti-Si phase diagram: the recent dispute about the eutectoid reaction. Materials Research, v.19, p.942-953, 2016.
HANSEN, M., KESSLER, H. D., MCPHERSON, D. J. Ti-Si phase diagram. Tran-sactions ASM, v.44, p.518-538, 1952.
KAUFFMAN, L. Coupled phase diagrams and thermochemical data for transition metal binary systems-VI*, Calphad, v. 3, n.1, p.45-76, 1979.
207
KOZLOV, A. K., PAVLYUK, V. V. Investigation of the interaction between the com-ponents in the Ti–{Si, Ge}–Sb systems at 670 K. Journal of Alloys and Compoun-ds, v. 367, p.76–79, 2004
LI, Z., LIU, Y., WANG, X., WU, Y., ZHAO, M., LONG, Z., YIN, F. 700ºC isother-mal section of the Al-Ti-Si ternary phase diagram. Journal of Phase Equilibria and Diffusion, v.35, p.564-574, 2014.
LUKAS, H. L., FRIES, S. G., SUNDMAN, B. Computational thermodynamics: the calphad method. Cambridge University Press, 2007.
MASLOV, V.M., NEGANOV, A.S., BOROVINSKAYA, I.P., AND MERZHANOV, A.G. Self-propagating high-temperature synthesis as a method for determination of the heat of formation of refractory compounds. Combust. Explos. Shock Waves,
v. 14, n. 6, p.759–767, 1978.
MESCHEL, S., KLEPPA, O. Standard enthalpies of formation of some 3d transition metal silicides by high temperature direct synthesis calorimetry. Journal of Alloys and Compounds, v. 267, n. 1-2, p.128–135, 1998.
MURRAY, J. L. Phase diagrams of titanium binary alloys. Ohio: ASM International, 1987. p. 289-293.
PLICHTA M. R., WILLIAMS, J. C., AARONSON, H. I. On the existence of the
β→αm transformation in the alloy systems Ti-Ag, Ti-Au, and Ti-Si. Metallurgical Transactions A, v. 8, p.1885-1892, 1977
PLITCHA, M. R., AARONSON, H. I. The thermodynamic and kinetics of the
β->αm transformation in three Ti-X systems. Acta Metallurgica, v. 26, p.1293-1305, 1978.
POLETAEV, D. O., LIPNITSKII, A. G., KARTAMYSHEV, A. I., AKSYONOV, D.A., TKACHEV, E.S., MANOKHIN, S. S., IVANOV, M. B., KOLOBOV, Y. R. Ab initio-based prediction and TEM study of silicide precipitation in titanium.
Computational Materials Science, v. 95, p.456–463, 2014.
RAMOS, A. S., NUNES, C. A., COELHO, G. C. On the peritectoid Ti3Si formation in Ti-Si alloys. Materials Characterization, v. 56, p.107-11, 2006.
ROBINS, D. A., JENSKINS, I. The heats of formation of some transition metal silici-des. Acta Metallurgica. v.3, p.598-603, 1955.
SEIFERT, H. J., LUKAS, H. L., PETZOW, G. Thermodynamic optimization of the Ti-Si system. Z. Mettalkd, v. 87, p.2-13, 1996.
SUTCLIFFE, D. A. Alliage de titane et de silicium. Revue de Metallurgie, n.3, p.524- 536, 1954.
SVECHNIKOV V. N., KOCHERZHISKY Y. A., YUPKO L. M., KULIK, O.G., SHINSHKIN, E. A. Phase diagram of the titanium-silicon system. Dokl. Akad. SSSR, v. 193, n. 2, p.393-396, 1970.
Thermo-Calc. Data optimization User Guide, Version 2015a. Foundation of Compu-tational Thermodynamics Stockholm, Sweden. Last assessed in November 15th, 2015. http://www.thermocalc.com/media/30890/Data-Optimisation-User-Guide--for-Thermo-Calc.pdf
TOPOR, L., KLEPPA, O. J. Standard enthalpies of formation of TiSi2 and VSi2 by high-temperature calorimetry. Metallurgical Transactions A, v.17, p.1217-1221, 1986.