[Trabalho 1609 ] APRESENTAÇÃO ORAL
MARIA DE FÁTIMA LORENA DE OLIVEIRA1;MARIA LEONOR DA SILVA CARVALHO2;MARIA RAQUEL LUCAS3;PEDRO DAMIÃO DE SOUSA HENRIQUES4.
1.ESCOLA SUPERIOR AGRÁRIA DE COIMBRA, COIMBRA - PORTUGAL; 2.UNIVERSIDADE DE ÉVORA/ ICAAM, ÉVORA - PORTUGAL; 3,4.UNIVERSIDADE DE ÉVORA, ÉVORA - PORTUGAL;
PRICE TRANSMISSION ON THE MILK PORTUGUESE MARKET
TRANSMISSÃO DE PREÇO NO MERCADO DO LEITE EM
PORTUGAL
Grupo de Pesquisa: Comercialização, Mercados e Preços Abstract
This paper aims to analyze the milk prices transmission along the food chain in Portugal, temporally and spatially. The analysis will be carried out with feed prices, farm gate milk prices and with the index prices of package milk out of factory.
The results show that the volatility on retail prices is small but after 2008 the prices outside industry show a real increase. Beside that evolution, farm gate price does not change when the price of package milk changes. In mainland, price transmission from retail to farm price does not happen but for Azores the transmission is effective. In the intensive systems, the risk to collapse is bigger than in the extensive systems, where the volatility of prices reflects the process of markets adjustment to changes in supply and demand conditions.
Key Words: leite, farm-gate milk, price transmission
Resumo
Este trabalho tem como objetivo analisar a transmissão de preço do leite ao longo da cadeia alimentar, temporal e espacialmente, usando os preços das rações, os preços do leite ao produtor e o índice de preços do leite embalado à saída da fábrica. Os resultados mostram que a volatibilidade nos preços ao retalho é pequena mas depois de 2008 os preços à saída da fábrica mostram um aumento real. Além desta evolução, os preços ao produtor não se alteram quando o preço do leite embalado se altera. Em Portugal continental, a transmissão de preço à saída da fábrica para o preço ao produtor não se dá, mas nos Açores esta transmissão é efetiva. Em sistemas intensivos, o risco de colapso é maior que nos sistemas extensivos, em que a volatiblidade dos preços reflete o processo de ajustamento dos mercados a mudanças nas condições da oferta e da procura.
Palavras chave: leite, preços ao produtor, transmissão de preço
1 Introduction
Since 2007, the dairy sector (particularly in relation to wholesale milk) has experienced wide price fluctuations coinciding with that of world commodity prices. The reform of the Common Agricultural Policy (CAP) has to respond to several challenges in general agricultural terms (climate change and European Union enlargement) and specifically in the dairy sector for developing more innovative and more market-oriented business models, ensuring high quality on milk supplied and sustainability of production, at right prices.
A considerable volume of research and studies have recently been carried out on the assessment of price transmission, but most research is concentrated on various product markets in the United States (Fackler & Goodwin, 2001) and a few studies are focused in European markets (Meyer & Cramon-Taubadel, 2004; Serra et al. 2006; Ben-Kaabia & Gil, 2008). Some authors such as Rapsomanikis et al. (2003) focus their work in developing countries. In the EU food supply chain the research shows that imperfect and asymmetric price transmission is linked to market imperfections, concentration and agent's pricing policies (COM, 2009). Most empirical studies find little evidence of systematic imperfect price adjustments along the EU food chain, although this may happen in the short run in some specific sector/country situation. The studies of vertical and spatial price transmission have been used to infer a number of conclusions regarding the behavior of market linkages across different levels of the marketing chain and some significant criticisms that have been directed toward this line of study “A central question is the interpretation of any empirical research results addressing questions of price transmission” (Goodwin 2006, p. 17). As concluded by Goodwin (2006, p. 1), cautions must apply to the methods and results, “… while interesting to the applied econometrician, cannot be used to make structural inferences without a deeper understanding of the markets”. Sometimes the interpretation is observed with criticism because it assumes that such tests are conducted without regard to the overall institutional and structural characteristics of the market.
Specifically focused on dairy product prices the first paper was presented by Kinnucan and Forker (1987). More recently, price volatility has recovered the debate on asymmetric price transmission (Stewart and Blayney, 2011). Meanilew, several studies have been focused on milk, cheese and cream caramel (Serra and Goodwin, 2003), butter (Chavas and Mehta, 2004), on price indexes of different milk products (Jensen and Skadkaer Moller, 2007), on milk, butter, cheese dairy products (Baumgartner et al, 2009), and on milk and cheese and the use (threshold) error correction models (Stewart and Blayney (2011). Serra and Goodwin (2003) found positive asymmetries for the Spanish dairy market. The authors relate the asymmetric pricing behavior in the Spanish dairy sector mainly to menu costs, inventory management, search costs and public market intervention. Chavas and Mehta (2004) find that retail prices respond more strongly to wholesale price increases than to wholesale price decreases; their explanations are consumer search costs, retailers’ menu costs and also imperfect competition at the retail level. Jensen and Skadkaer Moller (2007) detect weak price transmission especially for milk. In their view asymmetric price adjustment is caused by public intervention and product differences. More value added products show a higher degree of asymmetry. The European Union (2009) analyzes a range of different milk products (milk, butter, cheese, skim milk etc.) for a variety of EU Member States. Instead of an error correction approach a model in first differences was used to detect asymmetric price responses. In particular for Slovenia, United Kingdom, Denmark and Lithuania significant
asymmetries are found. The Commission relates the positive asymmetries to “the limited share of agricultural commodities into final food prices, inefficiencies in the market structure of the chain (either linked to imbalances in bargaining power and/or anti-competitive practices), and some adjustments constraints and costs (e.g. costs of changing prices for both producers and retailers, the slow price transmission due to long-term contracts between economic actors) (European Commission, 2009). Baumgartner et al (2009) detect positive asymmetries for milk and butter. Stewart and Blayney (2011) studied price transmission over the food crisis from 2007 to 2009 in the US. They analyzed the nature of price transmission for whole milk and cheddar cheese, comparing results of different model specifications. Independent of underlying specification they found positive asymmetries. Additionally, Stewart and Blayney (2011) stated for the lower processed product (whole milk) that the price pass-through is larger and that the process of error correction is active in the whole spectrum of observed disequilibria. In contrast, the higher processed product (cheddar cheese) shows a band of no error correction. More recently, Holm et al (2012) analyzed weekly basis variations in vertical price adjustment (cost pass through) between retail and whole sale prices for differentiated milk and butter products (brands) for different (individual) retail outlets in the German market from 2005 to 2008. The results indicate significant asymmetric price adjustments.
Thus, the empirical evidence for statistically significant positive price asymmetries in the dairy sector is overwhelming. This paper aims to analyze the variation of milk prices along the food chain in Portugal, temporally and spatially. The analysis will be carried out with feed prices, farm gate milk prices and with the index prices of package milk out of factory.
2. Methodology
The theory of cointegration developed by Engle and Granger (1987, pp. 251) is characterized by the main idea that “equilibrium relationship is a stationary point characterized by forces which tend to push the economy back toward equilibrium whenever it moves away” i.e. pointed out that a linear combination of two or more non-stationary series may be stationary. The stationary linear combination is called the cointegrating equation and may be interpreted as a long-run equilibrium relationship among the variables. We can say that a unique long-run relationship between two time series if both series are I(1) and there is some linear combination of both series that is I(0). Under these conditions the series are cointegrated, what is the statistical equivalent of the existence of a long-run economic relationship between the I(1) variables. If one of these variables is I(1) and the other I(0), then the linear combination of them given by the disequilibrium error could not be stationary (Thomas, 1997). To test cointegration we can apply two methods: the first one is the Engle-Granger´s two steps based on OLS. With this method, we estimate the long-run relationships, i.e., we run the regression and save regression residuals. The second step is to test whether the residuals are stationary or not. If we are able to reject the null hypothesis about the unit root, we can conclude that the variables are cointegrated. A second and more powerful test is the method introduced by Johansen (1995). This test is based on Maximum Likelihood Estimation (MLE and two statistics: maximum eigenvalues and a trace-statistics). As in Engle and Granger´s method, it is a good practice to pretest all variables to assess their order of integration (Enders, 2010). The Johansen test is only valid when we are working with series that are known to be non-stationary and the results are sensitive to the length of the lag. The software we will apply (STATA 10) implements three types of statistics for determining the number of cointegration equations “r” in a VECM (Vector Error-Correction Model): the Johansen’s “trace” statistic; the “maximum” eigenvalue statistic and the statistic that allows to choose the number of lags that minimizes either Akaike Information Criterion (AIC), the
Schwarz Bayesian Information criterion (SBIC), Hannan and Quim information criterion (HQIC); Finite prediction error (FPE) and sequential likelihood-ratio (LR). To determine the number of cointegration relations “r”, we proceed sequentially from r=0 to r=k-1 and the null hypothesis is rejected if the trace statistic is greater than the critical value. We start by testing H0: r = 0, if the null hypothesis is rejected, the process is repeated for H0: r = 1. When the null hypothesis is not rejected, we stop testing there, and we find the number of cointegrating relations (there are one or more cointegration vectors). As we explained above, firstly we will perform a descriptive price analysis for feed, farm gate milk and milk package out of factory and then we will perform the cointegration analysis. The first step for testing the roots analysis is the visual test; however more rigorous tests are needed.
To test the unit-root we employ the augmented Dickey-Fuller (ADF), the DF-GLS and the Phillips-Peron unit-root tests. The lags chosen have an important role on the test performance. “Too few lags mean that the regression residuals do not behave like white-noise processes (…). Too many lags reduce the power of the test”, (Enders, 2010, pp. 216). To select the correct number of lags we use the lags that minimize the value of the AIC and that minimize the SBIC. For the test we use the prices series at nominal values on logarithmic form, yet the prices series “…do not have to be expressed in logarithmic form, but it is convenient to do so for several reasons. Not only does this mean that parameters can be interpreted as elasticities, but also, because (…), first differenced variables (…) can be interpreted as proportionate changes” Thomas (1997, pp. 385). In first place, we perform an analysis of the price movement of the prices in each point of the milk chain.
To test cointegration we must specify how many lags to include. The Johansen approach can be quite sensitive to the lag length. The most regular procedure is to estimate a Vector of Auto Regression (VAR) using the “undifferenced” data (Enders, 2010; Lutkepohl and Kratzug, 2009). The output of STATA 10 uses the pre-estimation syntax “vasrsoc” to select the lag order for VAR model of farm gate milk and feed prices.
3. Prices analysis
The objective of this study is focused on investigate the mechanism of price transmission throughout the marketing chain in the milk sector. The price transmission will be studied between farm gate milk and feed prices as well as between farm gate milk and milk package prices. It is also possible to observe the transmission price from the producer to the consumer. The data for the feed prices are from INE and the data for the milk prices are from SIMA (Gabinete de Planeamento e Políticas do Ministério da Agricultura, Desenvolvimento Rural e Pescas) .
3.1 Cointegration between feed prices and milk prices on the producer
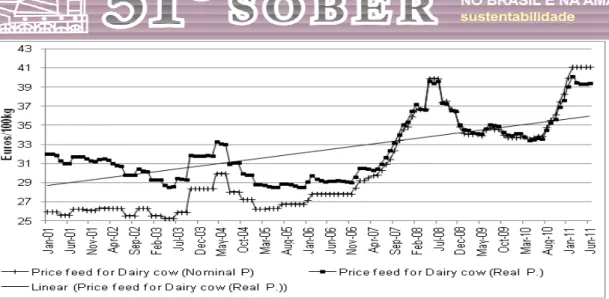
For feed prices we observe a real increase after 2007 with a peak in the middle of 2008, as shown in Figure 1. The evolution of the prices in real values shows a peak in the same period for the feed prices. From then on, there is a decline of the milk prices. The producer milk prices decline until the period of 2008, coinciding with the peak observed in the prices of feeding stuffs for dairy cattle.
Source: Data from SIMA,
While feed prices exhibit a decrease followed by an increase, the same does not happen with milk prices in the production where the declining trend remains. The trend for the feed prices is positive but the trend for the milk prices is negative (Fig. 2).
Figure 2 Portuguese Farm gate Milk prices at real and nominal value
Source: Data from SIMA
In a first remark, we can think that there is not a relation between the feed and milk prices, and only after the cointegration process we can conclude about the relation between prices. Once the weight of milking parlors is very small in milk production, the analysis will be performed between milk prices on individual producers and Azores producers and feed prices for dairy cows.
In order to test the cointegration, we will use one lag because the HQIC and the SBIC methods choose one lag that minimizes those indicators. The first step is to test the presence of unit roots in the series that we will use: feed prices; farm gate milk and indices of prices of milk package output of factory). The results on the feed and farm gate milk prices in logarithmic form (annex 1) show that we cannot reject the null hypothesis that both prices
series exhibits a unit roots that is integrated of order one I (1). The next step is to determine the lag order for a VAR model. The tests for cointegration are based on Johansen’s model and the results show that the Ho for r=0 is not rejected at a 5% level. In other words, this trace test result does not reject the null hypothesis and therefore there is no cointegration (Table 1). Nevertheless we will proceed to estimate the VECM model. The error correction term in each equation is not significant. If these two variables were cointegrated the disequilibrium error would be a stationary process. In this case, the test shows that the error of the cointegration equation does not look like a stationary series. The results indicate a strong support for the no cointegration of these two variables. If the two series were cointegrated, the prices will thus not drift too far apart over the long run, in this case this does not happen. The feed and farm gate milk prices, both seem to meander without any tendency to come together, there is not an equilibrium relationship between the two variables. We will apply the same methodology for farm gate milk prices in Azores The results showed that for the farm gate milk prices in Azores and feed prices, we can accept the null hypothesis that there is a cointegration equation in the bivariate model but only one of the coefficients is statistically significant. For the milk producers in Azores there is equilibrium at long-run between feed and milk prices (Table 2). This result is a very interesting one, mainly because in Azores production the housing systems are almost non-existent, and the exploitation performs extensive systems.
Table 1. Johansen tests for cointegration; farm gate milk prices of Individual producer in
mainland and feed prices
Maximum Rank Lags parms LL eigenvalue trace statistic 5% critical value 1 0 2 570.89 . 6.22* 15.41 1 5 573.69 0.05 0.02 3.76 2 6 573.97 0.00 4 0 14 568.99 . 11.37 1 17 574.66 0.09 0.03 2 17 574.68 0.03
* Ho: r=0 is not rejected at a 5% level (trace stat <15.41)
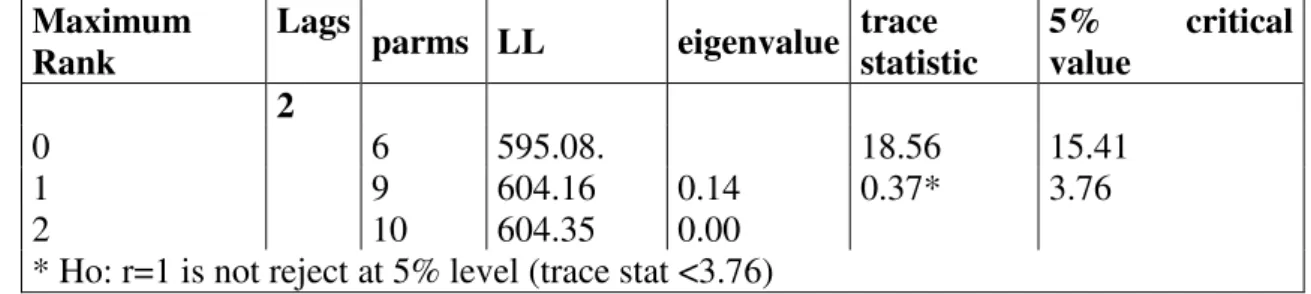
Table 2. Johansen tests for cointegration; farm gate milk prices of Azores producer and feed
prices
Maximum
Rank Lags parms LL eigenvalue trace statistic 5% value critical 2
0 6 595.08. 18.56 15.41
1 9 604.16 0.14 0.37* 3.76
2 10 604.35 0.00
* Ho: r=1 is not reject at 5% level (trace stat <3.76)
3.2 Cointegration between farm gate milk prices and the prices of package whole milk output of factory
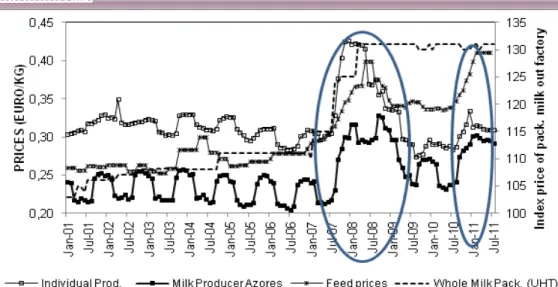
Figure 3 illustrates the evolution of the index price of whole, semi-skimmed and skim milk in package out of factory, showing a break on 2007 that is consistent with the increased on feed and farm gate milk prices however the prices didn’t decrease as happened with the farm gate
milk prices. This figure shows that for a long time the indices of prices remain stable but suddenly the price out factory increased illustrating the differences in market situation along the dairy supply chain, however the farm gate price dropped and the milk price out of factory didn’t respond at same level.
Figure 3. Prices indices of milk package out of factory
Source: Data from SIMA
The analysis for the unit roots on the index price for whole milk (UHT) out factory (annex 2 ) reveals that the series have a unit root that is integrated of order one, or I(1). If two non-stationary time series follow a common long run path we can test for cointegration. As series, farm gate milk prices and the indices prices of milk out factory are I (1) series we can proceed for next step. We first estimate the lag order for a VAR model. If we choose the HQIC and the SBIC the number of lags are two, however if we decide to apply for FPE and AI criterion the number of lags are three. The Johansen-trace-test is sensible to number of lags and we test for two lags and three lags. For the three lags, the results support one cointegration relationship (Table 3). Therefore we estimate de VECM that show that error correction term, are not statistical significant.
Table 3. Johansen tests for cointegration; farm gate milk prices of Individual producer in
mainland and whole milk package out of factory prices
Maximum Rank
Lags
parms LL eigenvalue trace statistic 5% value critical 2
1 9 604.16 0.14 0.37* 3.76
2 10 604.35 0.00
* Ho: r=1 is not rejected at a 5% level (trace stat <3.76)
The behavior of the error cointegration series show that is not typical of the stationary series. The test statistic shows that the predicted value of the specified cointegrating equation is not stationary but integrated I(I). Those results are consistent with no cointegration relationship. If we test the cointegration between the producer milk prices of Azores the results show one cointegration equation (Table 4). The coefficient on price milk on Azores and the error corrector vector are statistically significant. To get a better idea our model fits we predict the cointegration equation and graph them over time and if the cointegration exists the linear combination is stationary.
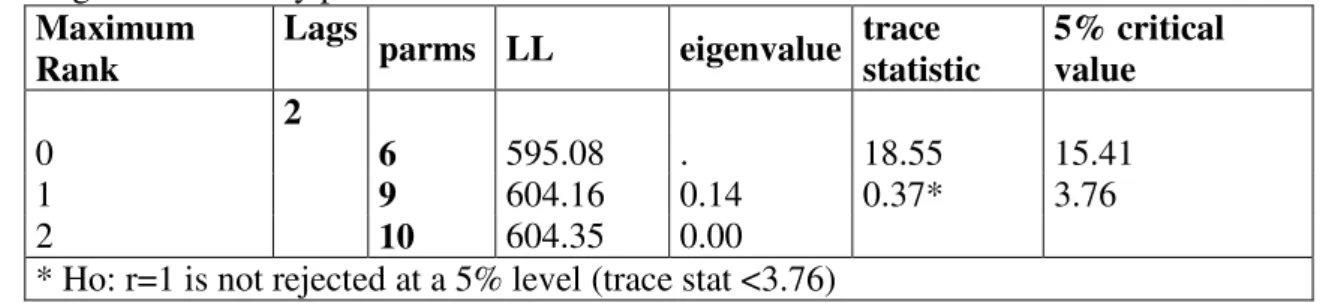
Table 4. Johansen tests for cointegration; farm gate milk prices of Azores and whole milk
package out of factory prices
Maximum
Rank Lags parms LL eigenvalue trace statistic 5% critical value 2
0 6 595.08 . 18.55 15.41
1 9 604.16 0.14 0.37* 3.76
2 10 604.35 0.00
* Ho: r=1 is not rejected at a 5% level (trace stat <3.76)
The summary statistics shows that there is not a relation between the farm gate milk prices and the prices of package whole milk output of factory on mainland but for milk produced in Azores the farm gate prices and the price of whole milk are cointegrated “is that their time paths are influenced by the extent of any deviation from long-run term equilibrium” (Enders, 2010, pp. 365).
It is hard to identify the cause of the change in price transmission of milk prices along the milk chain, however in the Figure 4 we can observe the change in price transmission pattern occurring from 2007 to 2008. It may relate to the intensity of agricultural commodity price increase that has forced food producer to translate their costs increase into price increases. Statistical indicator for trade shows that high farm gate prices are followed by higher milk importation values.
Recent price evolution in food supply chain in EU, COM (2009) identifies four main phases since May 2007. We apply for the same type of analysis in Table 5, but in Portugal the increases of feed prices began earlier than in EU, that is in January 2007. Feed prices sharply increase by 19% in 12 months, consequently farm gate milk prices in mainland and in Azores increase by respectively 38% and 25%.The whole milk package out of factory index price increase 14%. In the next period (January 2007 – August 2007) feed prices increase continue as well as the farm gate milk prices in mainland and the prices of whole milk package. In food prices crisis on EU (May 2007 – February 2008) the feed prices sharply increased 23% (in EU the increasing of agricultural commodity was of 16% “COM, 2009”).
The farm gate milk prices had increased to a bigger rhythm (41% and 49%) and index of price packed milk increased even so to an inferior rhythm (9%). In the period February to August 2008, feed prices increased slowly but the farm gate prices started declining however the whole milk package prices are still rising. On retailers’ lags the feed prices begin to decline as well the farm gate price. The prices of milk on consumer appear to stabilize. In the stabilization period (February 2009- July 2009) prices of feed and of whole milk package stabilized but the farm gate price continues declining. In February, feed prices sharply increased as well the farm gate prices but the whole milk package price remained unchanged. Price variation analysis enables identifying several trends in price transmission mechanisms along the chain and help to understand the result of the cointegration tests. One important conclusion is that the price variations in producers of milk appear to be greater than in the feed prices. The index prices of whole milk package out of factory present signs of stickiness having only very marginally decreased whereas all prices upwards in the chain have significant decline.
Table 5. Magnitude of price variation between January 2001 and August 2010 (nominal prices)
Phase Begin state End state Feed prices Farm gate milk prices in mainland Farm gate Milk prices in Azores Whole milk package out factory Jan-01 Dec-01 1% 9% 3% 3% Jan-02 Dec-02 0% -1% 1% 2% Jan-03 Dec-03 11% 2% 3% 0% Jan-04 Dec-04 -4% -1% 0% 3% Jan-05 Dec-05 2% -5% 3% 0%
Jan-06 Dec-06 5% -1% 1% 1% Portuguese
Food crises Jan-07 Dec-07 19% 38% 25% 14%
Jan-07 Ago-07 8% 6% -4% 13%
Food crisis
(EU) Mai-07 Fev-08 23% 41% 49% 9%
producer
lags Fev-08 Ago-08 2% -11% -6% 5%
Retailers´
lag Ago-08 Fev-09 2% -10% -1% 0%
stabilisation Fev-09 Jul-09 2% -13% -20% 0%
Jul-09 Fev-10 -3% 0% 11% 0%
Fev-10 Ago-10 3% -1% -9% 0%
Ago-10 Feb-11 18% 10% 25% 0%
6. Conclusion
In dairy sector, the EU average prices continue to be largely above intervention levels and according with Quarterly report on dairy market (EU, 15/03/2011) the farm gate milk is higher than others market as United States of America (USA) and New Zealand (332 euros/tons in EU 27 against 311 and 261 euro/tons in New Zealand and USA, respectively). The EU dairy policy has helped to maintain producer price at a higher and more stable level than in an unregulated market. The Portuguese farm gate prices were above the EU average prices until 2005 but in the last years the Portuguese price of cow milk declined and in consequence became more competitive. This fact is important for the development of international trade among neighbor’s countries. However, farmers’ perceptions of the milk market situation appear to differ and the feeling is a gap between the price paid for milk and the costs of producing The results showed that the increased on feed costs is not followed by an increase on farm gate price, in mainland, but in Azores, where the prevalent system are extensive systems, the relation between feed costs and milk prices exists in the long term. In intensive systems, the producer of cow milk is very dependent on feed costs but stability on farm gate milk price put in risk the income of dairy producer and the policy systems did not provide protection against the increased of feed price. Some dairy stakeholders claim that the farm gate price did not change because milk on retail did not change. The results show that the volatility on retail prices is small, but after 2008 the prices outside industry show a real increase. Beside that evolution, the farm gate price does not change when the price of package milk out factory did change. The price transmission from retail to farm price in mainland did not happen. But, as for Azores, the transmission of retail prices and farm prices is effective. Going back further, there were a few periods where the retail milk price did not change as much as farm milk costs, but there were also periods when the retail milk price changed more than did farm milk costs to fluid milk processors.
There may be a number of reasons for this, ranging from changes in costs in the processing, distributing and retailing channels to changing marketing strategies by retailers. However, over time the published data clearly show that changes in the retail price of milk not tend to track with changes in the cost of farm milk. In the intensive systems, the risk to collapse of the system is bigger than in the extensive systems where the volatility of prices reflects the process of market adjustments to changes in supply and demand conditions. Keane and O’Connor (2009) refer that some degree of price volatility is necessary once it reflects changing market conditions, but extreme price volatility results in a set of mostly negative consequences. These consequences can involve the substitution of Portuguese raw milk with cheaper alternatives. Portugal is one of the Member States more affected by the “Soft landing” policy (increasing raw milk production quotas by 1% a year until 2015). It is expected to be subject to more imports from more competitive countries as this increase their
production capacity. The dairy sector was not defined as strategic in the Rural Development Program (PRODER) that runs from 2007 to 2013 and therefore support for investment in the sector was not considered a priority. Without the guarantee of funds for structural reform, farmers can only aim at improving their management skills to lower costs and gaining competitiveness. More small farmers are expected to leave the dairy production system. The slow or even the not transmission of price increases for dairy commodities from farm gate prices to milk, and highlights the importance of implementing policies to strengthen the functioning of the dairy supply chain.
References
Anuário Pecuário (2007). Gabinete de Planeamento e Políticas (GPP), GPP - Direcção de Serviços de Estatística, Metodologia e Estudos (DSEME), Portugal
Bartova L., Fellemannt T., M'Barek R. (Eds.) (2009). Modelling and Analysis of the European Milk and Dairy Market in AGMEMOD Consortium. JRC Scientific and Technical, Reports, European Commission, Joint Research Centre, Institute for Prospective. Technological Studies, Seville, http://ftp.jrc.es/EURdoc/JRC50915.pdf
Baumgartner, J, Crespo-Cuaresma, J, Fernandez-Amador, O. (2009). Milking the Prices: The Role of Asymmetries in the Price Transmission Mechanism for Milk Products in Austria. In: WIFO Working Papers, P. 1–18.
Ben-Kaabia M., Gil J. (2008). Asymmetric Price Transmission in the Spanish Lamb Sector, European Review of Agricultural Economics, 34 (1), 53-80. Available at SSRN: http://ssrn.com/abstract=1147400 or http://dx.doi.org/jbm009.
Chavas, J. P. and Mehta, A. (2004). Price Dynamics in a vertical Sector: The Case of Butter. American Journal of Agricultural Economics 86 (4), P. 1078–1093.
COM (2009). Analysis of price transmission along the food supply chain in the EU Commission of the European Communities 28.10.2009.
Crosson, P. (2011). A review of whole farm systems models of greenhouse gas emissions from beef and dairy cattle production systems. Animal Feed Science and Technology Division. Enders W. (2010). Applied Econometric Time Series. Wiley: University of Alabama, 3nd Edition, 517 pages.
Engle R., Granger C., (1987). Co-integration and Error Correction: Representation, Estimation, and Testing, Econometrica, vol. 55, issue 2, 251-276.
European Commission (2009). Analysis of price transmission along the food supply chain in
the EU. Brussels. Available at:
http://ec.europa.eu/economy_inance/articles/structural_reforms/ article16028_en.htm
European Commission (EC) (2010). Prospects for Agricultural Markets and Income in the EU 2010-2020, European Commission Directorate-General for Agriculture and Rural Development, December 2010.
European Commission (EC) (2011). Quarterly report on dairy market, Agricultural Council, Brussels, 15 March 2011
Fackler P.L., Goodwin B. (2001). Spatial Price Analysis. In B. Gardner and G. Rausser (Eds), Handbook of Agricultural Economics, Vol. 1 (pp. 971-1024). Elsevier, Amsterdam.
FAO (2010). Greenhouse Gas Emissions from the Dairy Sector A Life Cycle Assessment, Food and Agriculture Organization of the United Nations, Animal Production and Health Gain Report (2010). EU-27 Dairy and products annual, USDA.
Goodwin B. (2006). Spatial and Vertical Price Transmission Meat Markets. Paper presented at the Market Integration and Vertical and Spatial Price Transmission in Agricultural Markets Workshop, University of Kentucky, April.
Holm, Thore, Loy, Jens-Peter, Steinhagen, Carsten (2012). “Vertical price transmission in differentiated product markets. a disaggregated study for milk and butter”, Selected Paper prepared for presentation at the Agricultural & Applied EconomicsAssociation’s 2012 AAEA Annual Meeting, Seattle, Washington, August 12-14, 2012.
Jensen, J. and Skadkaer Moller, A. (2007). Vertical Price Transmission in the Danish food marketing chain. Hg. v. Institute of Food and Resource Economics – Working Paper. Copenhagen.
Johansen S., (1995). Likehihood –Based Inference in Cointegrated Vector Autoregressive Models. Oxford University Press
Keane M., O Connor D. (2009). Price Volatility in EU Dairy industry: Cause, consequences and coping mechanisms, Report prepared for the European Dairy Association, University College Cork and MJKeane Agribussines Research Services.
Kinnucan, H. W. and Forker, O. D. (1987). Asymmetry in Farm-Retail Price Transmission for Major Dairy Products. American Journal of Agricultural Economics 69 (2), P. 285–292. Krugman P., Osfield M. (2007). Economia internacional: teoria e política; 6 ed., Addison Wesley, 558 pages.
Lutkepohl H., Kratzug M. (2009). Themes in modern econometrics: applied times series econometrics: Cambridge University press.
Meyer J., Von Cramon-Taubadel S. (2004). Asymmetric Price Transmission: A Survey, Journal of Agricultural Economics, 55, 581-611.
Rapsomanikis G., Hallam D., Conforti P. (2003). Market Integration and Price Transmission in Selected Food and Cash Crop Markets of Developing Countries: Review and Applications. In: FAO (Ed), Commodity Market Review 2003-2004 (pp 51-75). Commodities and Trade Division of Food and Agriculture Organization of the United Nations, Italy.
Reports, European Commission, Joint Research Centre, Institute for Prospective
Rohner-Thielen, E., (2008). From grass to glass; a look at the dairy chain. Eurostat Statistics in focus 76/2008, Agriculture and fisheries.
Serra, T. and Goodwin, B. (2003). Price transmission and asymmetric adjustment in the Spanish dairy sector. In: Applied Economics 35 (18), P. 1889–1899.
Serra T., Gil J., Goodwin B. (2006). Local polynomial fitting and spatial price relationship: price transmission in EU pork markets, European Review of Agricultural Economics, Vol. 33, Issue 3, 415-436.
Stewart, H. and Blayney, D. P. (2011). Retail Dairy Prices Fluctuate with the Farm Value of Milk. Agricultural and Resource Economics Review 2011.
Thomas R. L. (1997).Modern Econometrics - An Introduction, Addison-Wesley Longman Ltd, Essex, 535 pages.
Thomassen M., Dalgaard R., Heijungs R. & Boer I. (2008). Attributional and consequential LCA of milk production. International Journal Life Cycle Assessment, 13, 339-349.
Annex 1. Tests of Unit roots for feed and farm gate milk prices
lags 1 11 12
Maxlag = 12 chosen by Schwert criterion
Level TEST
Min SC Min
MAIC Opt Lag (Ng-Perron)
1% critical value 5% critical value milk individual DF-GLS -2.103 -3.336 -3.434 -2.597 -1.950 producer Augment Dickey
-Fuller include trend * -2.307 -3.748 -4.032 -3.447
Phillips-Perron -0.245 -2.597 -1.950 lags 1 8 11 12 TEST Min MAIC Min SC 1% critical value 5% critical value milk azores DF-GLS -2.616 -1.112 -1.018 -2.747 -2.597 -1.950 Augment Dickey -Fuller (dfuller) -2.827 -1.097 -2.776 -2.365 -1.660
Phillips-Perron -3.525 -4.032 -3.447 lags 1 10 11 12 Maxlag = 12 chosen by Schwert criterion First-difference TEST NIN
SC Min MAIC Opt Lag (Ng-Perron)
1% critical value 5% critical value milk individual DF-GLS -5.611 -2.177 -2.330 -2.597 -1.950 producer Augment Dickey
-Fuller include trend -6.016 -3.748 -4.035 -3.448
Phillips-Perron -9.328 -2.597 -1.950
lags 1 11 12
Maxlag = 12 chosen by Schwert criterion
TEST Min SC Min MAIC
1% critical value 5% critical value milk azores * DF-GLS -6.032 -1.018 -1.320 -2.597 -1.950 Augment Dickey
-Fuller include trend -6.635 -1.239 -2.776 -2.597 -1.950
Phillips-Perron -8.899 -2.597 -1.950
lags 1 2 12
Maxlag = 11 chosen by Schwert criterion
Level TEST Min SC Min MAIC
Opt Lag (Ng-Perron) 1% critical value 5% critical value Feed DF-GLS 0.841 0.408 0.504 -2.597 -1.950 Augment Dickey
-Fuller include trend * -1.864 -2.252 -2.330 -4.032 -3.447
Phillips-Perron -1.972 -4.032 -3.447 lags 5 11 12 Maxlag = 12 chosen by Schwert criterion
First-difference TEST Min SC
Min MAIC Opt Lag (Ng-1% critical value 5% critical value
Perron) Feed DF-GLS -5.518 -3.013 -3.511 -2.996 -2.597 -1.950 Augment Dickey -Fuller include -5.903 -3.194 -3.692 -2.358 -1.658 Phillips-Perron -9.271 3.502 -2.888
lags 1 7 12
Maxlag = 12 chosen by Schwert criterion
Level TEST Min SC
Opt Lag (Ng-Perron) Min MAIC 1% critical value 5% critical value packaged whole milk out factory DF-GLS 1.181 -2.032 0.134 -2.597 -1.950 Augment Dickey -Fuller -0.601 -0.656 -2.358 -1.658 Phillips-Perron -1.590 -1.741 -4.032 -3.447 6 7 12 Maxlag = 12 chosen by Schwert criterion First-difference Min SC Opt Lag
(Ng-Perron) Min MAIC
1% critical value 5% critical value packaged whole milk out factory DF-GLS -7.433 -2.309 -2.032 -2.149 -2.597 -1.950 Augment Dickey -Fuller include -8.295 -2.298 -2.358 -1.658 Phillips-Perron -13.047 -12.981 -3.502 -2.888