A Work Project presented as part of the requirements for the Award of a Masters Degree in Finance from NOVA - School of Business and Economics.
Shareholder Activism Worldwide: Evidence from Voting
Nuno Quartin Bastos de Vasconcellos e Sá (no. 494)
A Project carried out on the Corporate Finance major, under the supervision of: Professor Miguel Ferreira
Abstract
Voting is one of the ways shareholders have to exercise governance. Using 19 countries, through a period of five years, we examine whether institutional investors promote better governance. We analyze if their presence in companies is linked with higher levels of shareholder activism, through voting. We find that companies with more
institutional investors are subject to more votes “against” at Annual General Meetings,
therefore implying that institutions promote better governance practices. Moreover, we find that foreign investors are the ones who drive higher levels of activism. Around the world, companies located in countries with less shareholder protective legal frameworks are the ones subject to higher scrutiny from shareholders.
Keywords: Corporate Governance; Voting; Shareholder Activism; Institutional Investors.
Acknowledgments
The author would like to thank Professor Miguel Ferreira for all his guidance throughout the development of this project, Professor Pedro Matos for his insights, Professors Iliyan Georgiev and João Amaro de Matos for the comments on the intermediate version, Simão Arouca for all his assistance and all members of Nova SBE’s office 129 for the support provided through the past few months.
1. Introduction
Shareholders have two ways to try to influence corporate governance. They can be active using their
“voice” by entering private talks with the management or by voting against the proposals made by them; or they
can take a passive role and exercise governance by “voting with their feet”, which means selling the shares they hold in the company.
In this paper we study whether institutional shareholders actually use their option to vote against the proposals made by the management as a way to exercise governance by comparing the total levels of dissent – the form of voting associated with activism of shareholders – in companies with different levels of institutional ownership. Also, we look at what type of proposals institutional investors vote “against” more often. We want to know to which extent these investors take on a more active role in influencing corporate governance in the companies in which they invest, compared to other investors.
Nowadays it is extremely easy to become a shareholder of a company, regardless of its location. However, it may not be as simple to contribute to the governance of a company which is on the other side of the world. Stulz (2005) argues that there are limits to globalization since rulers of sovereign states, corporate insiders or controlling shareholders pursue their own interests at the expense of other outside investors. As institutions invest
other people’s money, it is of the utmost importance that they can somehow influence the companies they invest in,
and try to steer them in a good direction. In this paper we asses if institutional shareholders do so through their
“voice”, voting in the Annual General Meetings, in the best interest of their investors.
happens primordially on countries with weaker investor protection laws, which signals that institutional investors are voting to exercise governance in order to compensate for the lack of investor protection.
Additionally, we test what type of institutional shareholders contribute to the improvement of companies’ corporate governance through voting, by splitting them according to their “colors” as Ferreira and Matos (2008). We find that active (or independent) investors, as well as foreign investors, tend to be the drivers of the relation between institutional ownership and dissent, as opposed to passive (or grey) and domestic investors.
Aggarwal, Erel, Ferreira and Matos (2011) have shown that companies with a higher percentage of institutional ownership, especially if foreign, tend to have better governance (measured by Gov411). Also, this
happens more frequently in countries with civil law legal structures, as opposed to the more investor protective common law countries.
Furthermore Iliev, Lins, Miller and Roth (2012) have already shown that U.S. institutional investors use voting as a way to exercise governance in the companies they invest in outside their home country, and that firm and country-level investor protection laws, as well as measures of firm-level managerial entrenchment, influence the way these shareholders vote on director-related proposals.
Finally, Morgan, Poulsen and Wolf (2006) find that, for compensation proposals in companies in the S&P 500 between 1992 and 2003, shareholders in general have changed their way of voting with time by becoming more and more aggressive, especially for proposals or companies where the dilution caused by such proposals can be harmful to them. This evolution has made dissent levels grow to an extent where some proposals have started being rejected in the years.
Given all of this, we expect to find institutional investors using their power to exercise governance through voting, in particular for proposals related to compensation, or in companies located in countries with weak investor
1
Gov41 is an index calculated by Aggarwal et al. (2010) using 41 firm-level governance attributes from
protection laws. However, to this date, we have not yet found a study linking the institutional ownership of a firm to the overall voting outcomes as a measure of governance.
2. Data & Variables
2.1. Voting Data
The voting data used in this study was obtained from RiskMetrics and contains the voting outcomes of all shareholder meetings across Europe2, Australia, and Canada between 2008 and 2012.
In these databases the information provided encompasses the names and tickers of the firms, the date of the shareholder meetings, the description of the topics in the agenda, and the voting outcome. For each proposal, we calculate dissent as the total number of votes that do not follow the management recommendation. With this in mind, whenever the management recommends voting “For” the dissent is represented by the total votes “Against”
and “Abstain”.
In this study, we analyze both the total dissent, which includes management and shareholder proposals, and specific dissent on the proposals made by the management. Shareholder proposals are not individually analyzed because of the frequent absence of data regarding management recommendation (making it impossible to calculate dissent), as well as the diversity of topics covered within this category. For those countries or years3 where no information regarding the management recommendation for each proposal exists, dissent is only
calculated for management proposals, assuming the inherent recommendation to be always “For”.
2
European countries considered: Austria (ATX 20); Belgium (BEL20); Denmark (OMXC 20); Finland (OMX-H 25); France (SBF 120); Germany (Dax 30 and MDAX 50); Greece (ASE 20); Ireland (ISEQ General); Italy (FTSE MIB and MIDCAP); Luxembourg (LuxX); The Netherlands (AEX 25 and AMX 25); Norway (OBXS 30); Portugal (PSI 20); Spain (IBEX35); Sweden (OMXS 20); United Kingdom (FTSE 350). 3
We sort all management proposals according to the following categories: (1) Routine / Business, (2) Director Related, (3) Compensation, (4) Preferred / Bondholders, (5) Capitalization, (6) Anti-takeover related, (7) Reorganization and Mergers, and (8) Social Proposals.
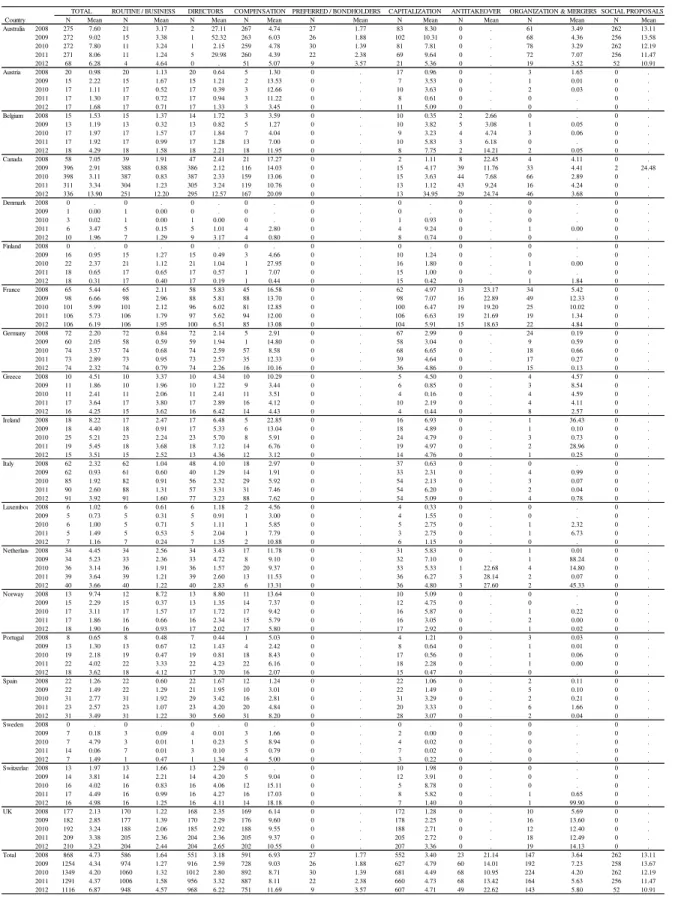
Table 1 reports the number of observations, firms, average total dissent, and average dissent for each category (only for management proposals) per country. Table 2 reports the same data per country/year. In a universe of 2006 companies throughout five years, corresponding to 5,878 different observations, the average total dissent is 4.85%.
Later on, we divide the data according to the legal origin of the companies’ home countries, to better understand how differently investors act in face of either common or civil4 law regimes. Herein, we expect to see investors taking a more active role in civil law countries, as these have weaker investor protection laws, as observed by La Porta, Lopez-de-Silanes, Shleifer and Vishny (1998).
2.2. Explanatory Variables
All time variable explanatory variables are lagged one period, being measured at the end of the fiscal year before the shareholder meeting in which dissent is measured, in order to mitigate any potential endogeneity.
In our regressions, we will test if the total institutional ownership level of a company has any real effect on the dissent levels of that company. We expect this impact to be positive because, according to Iliev et al. (2012), institutional investors use voting as a tool to exercise governance. Nonetheless, there are some caveats when making such an interpretation. On the one hand, non-institutional investors may vote “against” less often (meaning less dissent) if they see that institutions have a significant stake in the company and believe they will be exercising governance for all shareholders (this hypothesis is not considered by Iliev et al. (2012) as they only look at the votes
4
cast by U.S. institutional investors). On the other, the possibility of institutional investors “voting with their feet” makes it harder to predict the impact of total institutional ownership on dissent.
Additionally, following Ferreira and Matos (2008), total institutional ownership of a firm is segmented
according to its “colors”, as previously mentioned. Depending on their country of origin, we split the investors into domestic and foreign and according to their institution’s nature we divide investors into passive and active.
We expect that foreign investors will make more use of dissent as a governance tool when compared to domestic investors because, as seen by Aggarwal et al. (2011), there is a positive relation between foreign institutional ownership and governance. Also, Ferreira and Matos (2008) find that higher levels of foreign institutional ownership are related to firm value and performance. However, there is yet no study that relates these institutional ownership variables and dissent.
As for the nature of the institutional investors (where active ones are mutual fund managers or investment advisers and the passive correspond to institutions like bank trusts, insurance companies, or pension funds), we believe that companies will face dissent more frequently the higher the levels of active institutional ownership they have, and less dissent for higher levels of passive institutional ownership. Once more, Aggarwal et al. (2011) find that companies with higher levels of active institutional ownership score higher in the governance index Gov41. However, even though we expect active investors to be willing to collect more information about their investments and face less regulatory restrictions (in opposition to passive investors who tend to face higher monitoring costs, and are more prone to create business relationships with their invested firms) we have not yet seen any study relating these natures of institutional ownership and dissent.
held shares, the higher the dissent levels are. Although apparently contradictory, such a result does not go against our expectation of a negative relation given the differences in the dependent variable under analysis. Whereas those authors focus only on dissent by American investors in foreign countries, we look at total dissent. This means that a stronger entrenchment is expected to originate fewer votes “against”, as insiders are not expected to vote “against”. Therefore, we expect dissent to be lower, for higher values of insider control.
Furthermore, Gov41 a measure for the quality of the corporate governance inside a firm previously used in
Aggarwal et al. (2011) and Iliev et al. (2012), is also used. Companies with better governance practices have this index closer to 1 than to 0 and are expected to face less dissent. According to Iliev et al. (2012), companies with higher levels of this index face less dissent from U.S. investors.
At last, we control for firm-level characteristics using data from Worldscope. As used by Iliev et al. (2012), these are: logarithm of market capitalization – which we expect to negatively affect dissent; leverage (calculated as total debt to total assets) – which we believe to have a positive impact on dissent; profitability (calculated as nibe to total assets) – where less profitable companies should generate higher levels of dissent; market-to-book – being companies with higher ratios expected to face less dissent; and cross-list (a dummy variable which is 1 if the company is quoted in the U.S. and 0 otherwise) – with an unclear effect for the same reason stated in the case of insider control. Also, all models have dummy variables that account for country, industry, and year.
3. Results
We want to know how different institutional investors vote, as well as if they use their voting power as a governance tool. In the sections below we test for the relation between the supra mentioned forms of institutional ownership.
3.1. Dissent and Institutional Ownership
Table 4 shows how dissent can be explained by the different allocations of institutional ownership. We use dissent (total or in specific proposals) as our dependent variable and the percentage of institutional investors or other measures of governance as explanatory variables, resorting to a pooled OLS specification for this firm-year panel. Country, industry and year dummies are present in all regressions, unless stated otherwise. Also, standard errors are clustered at the country-industry level.
From Panel A, where we regress total dissent on the various types of institutional ownership we conclude that the more foreign institutional investors there are in a firm, the higher are the levels of dissent (significant at a 10% level). Also, the presence of passive institutional investors in a company diminishes the number of votes against the proposals submitted by the board (at a 5% significance level). Finally, we verify that as expected, higher levels of insider control and Gov41 imply less total dissent, thus corroborating our expectations.
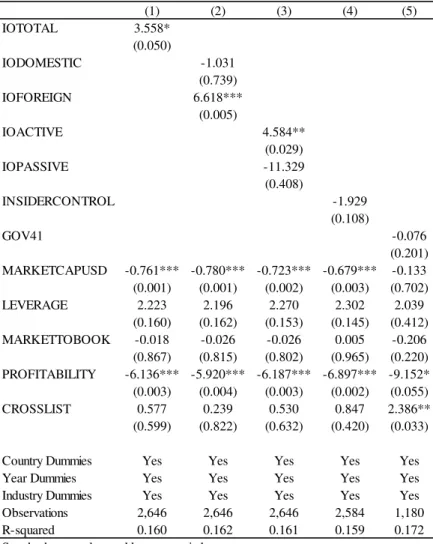
When focusing on the topics of compensation (Panel B) we find that, generally, the simple presence of institutional investors positively affects dissent. Moreover, active institutional investors tend to have a positive and significant impact on such proposals, something not verified in total dissent. Finally, as for total dissent, foreign institutional ownership is positive and significantly correlated with dissent on compensation proposals (an increase in 10p.p. in foreign institutional ownership has an impact of 0.662p.p. in compensation dissent).
institutional ownership generates a 0.604p.p. increase in capitalization dissent) and a negative and significant relation between capitalization dissent and domestic institutional ownership (an increase of 10p.p. in the level of domestic institutional ownership has a negative impact of 0.709p.p. in capitalization dissent).
In Panel D and Panel E we find no evidence of significant causality of institutional ownership on either routine / business or director related dissent topics.
Overall, confirming our expectations, we find that companies with higher levels of foreign institutional ownership have more dissent. It is also worth noting that, as we expect, for several topics we find that insider control is negative and significantly related to dissent.
3.2. Dissent and Institutional Ownership - Common vs Civil Law Countries
To further investigate the relation between institutional ownership and total, compensation, and capitalization dissents, we split the data in two groups (Table 5): countries with common law and countries with civil law legal origins.
3.2.1. Total Dissent
Panel A.1 reports the results for common law countries. The only significant result we obtain is that companies with higher passive institutional ownership have less total dissent (an increase of 10p.p. in the level of passive institutional investors has an impact of -1.511p.p. in total dissent).
Bearing such evidence in mind, we conclude that the frequency dissent observed for the companies with higher levels of institutional ownership of all types is originated in the countries with civil law legal origins.
3.2.2. Compensation Dissent
Seeing that compensation dissent is a topic where institutional investors have a more active role, we take a deeper look at how remuneration dissent is affected by the presence of different types of such investors.
As done for total dissent, we split the voting data into two groups (common versus civil law). The results are presented in Panel B.1 (common law countries) and Panel B.2 (civil law countries). Whereas there are no significant relations between compensation dissent and different forms of institutional ownership in common law countries, apart from the negative relation with passive institutional investors (like there was for total dissent in these countries), in civil law countries this linkage is extremely strong again.
Compensation dissent in civil law countries is positive and significantly correlated with total, foreign and active institutional ownership, (a 10p.p. increase in these levels of institutional ownership will generate an increase of 1.521p.p., 2.094p.p., 1.712p.p., respectively in compensation dissent).
3.2.3. Capitalization Dissent
Finally, we look at how differently dissent is affected on topics related to capitalization issues in common and civil law countries (Panel C.1 and Panel C.2).
This leads us to the conclusion that institutional investors are not willing to participate in capital increases from companies located in civil law countries, but do not oppose to do so in companies located in common law countries.
When we put together the results for capitalization and compensation with the results for total dissent seen before we conclude that whereas there seems to be no relation between the various forms of institutional ownership and dissent in common law countries (apart from the negative relation for capitalization topics), there is a very strong positive impact of such ownerships in civil law countries.´
3.3. Other tests
We try to substitute the country dummies by variables that can differentiate the countries, such as GDP Per Capita, Market Capitalization to GDP, and a dummy variable that is equal to 1 if the country is common law or 0 otherwise (Table 6). However, we believe that these variables do not capture completely differences between countries, something that may explain punctual differences in the results.
For robustness, we also regress total, compensation and capitalization dissents using country clusters (instead of the previous country/industry ones). Those results are shown in Table 7. Results do not differ considerably for total dissent (Panel A) and, therefore, we opt for the country/industry clustering as our sample only includes 19 countries. However, when using country clusters to analyze compensation and capitalization dissents (Panel B and Panel C) we lose the significance in all variables other than foreign (compensation) and domestic (capitalization) institutional ownership.
institutional ownership and capitalization dissent. We prefer country-industry clustering because it allows us to account for within each country-industry pair correlation.
4. Conclusion
As an original contribution, this thesis suggests that institutional investors make use of their “voice”, through voting, to exercise governance around the world.
Furthermore, we find that foreign institutions are the ones which take on a more active role and, in accordance, vote “against” more frequently in shareholder meetings. With a bigger impact, compensation proposals are the ones that generate more motivation in institutions to let the managers hear their opinion. It is also worth mentioning how the nationality of the investors affects, in particular, the proposals related to capitalization, where the presence of domestic investors is linked to less dissent (meaning approval of these issues) and the presence of foreign investors goes in the opposite direction.
Also, we find that investors seem prompted to vote “against” more often in countries where they know their interests are less protected – civil law countries – proving that they change their approach to defend themselves on such legal settings.
References
Aggarwal, Reena, Isil Erel, Miguel A. Ferreira, and Pedro Matos. 2011. “Does
Governance Travel Around the World? Evidence from Institutional Investors” Journal of
Financial Economics 100, 154-181.
Cai, Jie, Jacqueline Garner, and Ralph Walkling. 2009. “Electing Directors” Journal of Finance 64, 2389-2421.
Ferreira, Miguel A., and Pedro Matos, 2008. “The Color of Investors’ Money: The role
of Institutional Investors Around the World.” Journal of Financial Economics 88, 495-533.
Iliev, Peter, Karl V. Lins, Darius P. Miller, and Lukas Roth. 2012. “Shareholder voting and corporate governance around the world” Working paper.
La Porta, Rafael, Florencio Lopez-de-Silanes, Andrei Shleifer, and Robert W. Vishny.
1998. “Law and Finance” Journal of Political Economy 106, 1113-1155.
Morgan, Angela, Annete Poulsen, and Jack Wolf, 2006. “The Evolution of Shareholder
Voting for Executive Compensation Schemes”Journal of Corporate Finance 12, 715-737.
Table 1 - Average dissent per country
Country N Mean N Mean N Mean N Mean N Mean N Mean N Mean N Mean N Mean
Australia 381 1,158 8.01 62 2.99 9 28.73 1,100 4.99 114 1.95 356 8.85 0 . 298 4.50 1,088 12.51
Austria 26 86 1.42 86 0.94 86 0.89 16 7.22 0 . 53 2.60 0 . 6 0.84 0 .
Belgium 23 80 2.27 80 1.21 79 1.61 46 7.64 0 . 47 4.06 16 5.42 6 0.06 0 .
Canada 669 1,499 5.68 1,369 3.05 1,420 4.60 582 14.95 0 . 58 10.14 163 12.83 165 3.57 2 24.48
Denmark 20 20 2.02 14 0.70 15 2.24 8 1.80 0 . 13 3.37 0 . 1 0.00 0 .
Finland 28 74 1.14 70 0.86 70 0.60 6 8.24 0 . 56 1.12 0 . 2 0.92 0 .
France 128 476 6.04 476 2.18 439 5.98 393 13.31 0 . 470 6.31 82 21.02 149 7.86 0 .
Germany 86 353 2.63 351 0.78 352 2.31 114 9.76 0 . 268 4.42 0 . 83 0.34 0 .
Greece 22 65 3.42 63 3.09 64 3.66 60 5.01 0 . 29 1.79 0 . 23 4.31 0 .
Ireland 36 95 5.41 91 2.35 88 5.87 45 8.26 0 . 91 5.22 0 . 8 12.11 0 .
Italy 109 390 2.45 384 1.14 278 2.93 180 6.41 0 . 232 3.55 0 . 13 0.56 0 .
Luxembourg 12 29 1.08 28 0.47 28 1.32 7 6.79 0 . 22 1.66 0 . 2 4.53 0 .
Netherlands 46 183 3.99 182 1.81 182 2.98 64 10.78 0 . 168 5.84 7 27.13 10 23.82 0 .
Norway 26 80 3.50 76 2.14 76 3.06 74 8.09 0 . 71 4.23 0 . 4 0.06 0 .
Portugal 25 80 2.72 80 2.11 77 2.49 61 5.49 0 . 62 1.09 0 . 6 0.03 0 .
Spain 36 129 2.43 129 1.27 125 3.53 89 4.95 0 . 123 2.53 0 . 17 0.66 0 .
Sweden 30 35 1.31 14 0.06 9 0.21 17 4.33 0 . 16 0.06 0 . 0 . 0 .
Switzerland 23 76 3.94 75 1.35 75 3.83 47 16.03 0 . 42 3.97 0 . 2 50.28 0 .
UK 280 970 2.99 944 1.93 931 2.52 940 9.12 0 . 950 2.51 0 . 75 12.22 0 .
Total 2,006 5,878 4.85 4,574 2.08 4,403 3.67 3,849 8.94 114 1.95 3,127 4.45 268 15.27 870 5.31 1,090 12.53
CAPITALIZATION ANTITAKEOVER REORGANIZATION & MERGERS SOCIAL PROPOSALS Number
of Firms
Table 2 - Average dissent per country/year
N Mean N Mean N Mean N Mean N Mean N Mean N Mean N Mean N Mean
Australia 2008 275 7.60 21 3.17 2 27.11 267 4.74 27 1.77 83 8.30 0 . 61 3.49 262 13.11
2009 272 9.02 15 3.38 1 52.32 263 6.03 26 1.88 102 10.31 0 . 68 4.36 256 13.58
2010 272 7.80 11 3.24 1 2.15 259 4.78 30 1.39 81 7.81 0 . 78 3.29 262 12.19
2011 271 8.06 11 1.24 5 29.98 260 4.39 22 2.38 69 9.64 0 . 72 7.07 256 11.47
2012 68 6.28 4 4.64 0 . 51 5.07 9 3.57 21 5.36 0 . 19 3.52 52 10.91
Austria 2008 20 0.98 20 1.13 20 0.64 5 1.30 0 . 17 0.96 0 . 3 1.65 0 .
2009 15 2.22 15 1.67 15 1.21 2 13.53 0 . 7 3.53 0 . 1 0.01 0 .
2010 17 1.11 17 0.52 17 0.39 3 12.66 0 . 10 3.63 0 . 2 0.03 0 .
2011 17 1.30 17 0.72 17 0.94 3 11.22 0 . 8 0.61 0 . 0 . 0 .
2012 17 1.68 17 0.71 17 1.33 3 3.45 0 . 11 5.09 0 . 0 . 0 .
Belgium 2008 15 1.53 15 1.37 14 1.72 3 3.59 0 . 10 0.35 2 2.66 0 . 0 .
2009 13 1.19 13 0.32 13 0.82 5 1.27 0 . 10 3.82 5 3.08 1 0.05 0 .
2010 17 1.97 17 1.57 17 1.84 7 4.04 0 . 9 3.23 4 4.74 3 0.06 0 .
2011 17 1.92 17 0.99 17 1.28 13 7.00 0 . 10 5.83 3 6.18 0 . 0 .
2012 18 4.29 18 1.58 18 2.21 18 11.95 0 . 8 7.75 2 14.21 2 0.05 0 .
Canada 2008 58 7.05 39 1.91 47 2.41 21 17.27 0 . 2 1.11 8 22.45 4 4.11 0 .
2009 396 2.91 388 0.88 386 2.12 116 14.03 0 . 15 4.17 39 11.76 33 4.41 2 24.48
2010 398 3.11 387 0.83 387 2.33 159 13.06 0 . 15 3.63 44 7.68 66 2.89 0 .
2011 311 3.34 304 1.23 305 3.24 119 10.76 0 . 13 1.12 43 9.24 16 4.24 0 .
2012 336 13.90 251 12.20 295 12.57 167 20.09 0 . 13 34.95 29 24.74 46 3.68 0 .
Denmark 2008 0 . 0 . 0 . 0 . 0 . 0 . 0 . 0 . 0 .
2009 1 0.00 1 0.00 0 . 0 . 0 . 0 . 0 . 0 . 0 .
2010 3 0.02 1 0.00 1 0.00 0 . 0 . 1 0.93 0 . 0 . 0 .
2011 6 3.47 5 0.15 5 1.01 4 2.80 0 . 4 9.24 0 . 1 0.00 0 .
2012 10 1.96 7 1.29 9 3.17 4 0.80 0 . 8 0.74 0 . 0 . 0 .
Finland 2008 0 . 0 . 0 . 0 . 0 . 0 . 0 . 0 . 0 .
2009 16 0.95 15 1.27 15 0.49 3 4.66 0 . 10 1.24 0 . 0 . 0 .
2010 22 2.37 21 1.12 21 1.04 1 27.95 0 . 16 1.80 0 . 1 0.00 0 .
2011 18 0.65 17 0.65 17 0.57 1 7.07 0 . 15 1.00 0 . 0 . 0 .
2012 18 0.31 17 0.40 17 0.19 1 0.44 0 . 15 0.42 0 . 1 1.84 0 .
France 2008 65 5.44 65 2.11 58 5.83 45 16.58 0 . 62 4.97 13 23.17 34 5.42 0 .
2009 98 6.66 98 2.96 88 5.81 88 13.70 0 . 98 7.07 16 22.89 49 12.33 0 .
2010 101 5.99 101 2.12 96 6.02 81 12.85 0 . 100 6.47 19 19.20 25 10.02 0 .
2011 106 5.73 106 1.79 97 5.62 94 12.00 0 . 106 6.63 19 21.69 19 1.34 0 .
2012 106 6.19 106 1.95 100 6.51 85 13.08 0 . 104 5.91 15 18.63 22 4.84 0 .
Germany 2008 72 2.20 72 0.84 72 2.14 5 2.91 0 . 67 2.99 0 . 24 0.19 0 .
2009 60 2.05 58 0.59 59 1.94 1 14.80 0 . 58 3.04 0 . 9 0.59 0 .
2010 74 3.57 74 0.68 74 2.59 57 8.58 0 . 68 6.65 0 . 18 0.66 0 .
2011 73 2.89 73 0.95 73 2.57 35 12.33 0 . 39 4.64 0 . 17 0.27 0 .
2012 74 2.32 74 0.79 74 2.26 16 10.16 0 . 36 4.86 0 . 15 0.13 0 .
Greece 2008 10 4.51 10 3.37 10 4.34 10 10.29 0 . 5 4.50 0 . 4 4.57 0 .
2009 11 1.86 10 1.96 10 1.22 9 3.44 0 . 6 0.85 0 . 3 8.54 0 .
2010 11 2.41 11 2.06 11 2.41 11 3.51 0 . 4 0.16 0 . 4 4.59 0 .
2011 17 3.64 17 3.80 17 2.89 16 4.12 0 . 10 2.19 0 . 4 4.11 0 .
2012 16 4.25 15 3.62 16 6.42 14 4.43 0 . 4 0.44 0 . 8 2.57 0 .
Ireland 2008 18 8.22 17 2.47 17 6.48 5 22.85 0 . 16 6.93 0 . 1 36.43 0 .
2009 18 4.40 18 0.91 17 5.33 6 13.04 0 . 18 4.89 0 . 1 0.10 0 .
2010 25 5.21 23 2.24 23 5.70 8 5.91 0 . 24 4.79 0 . 3 0.73 0 .
2011 19 5.45 18 3.68 18 7.12 14 6.76 0 . 19 4.97 0 . 2 28.96 0 .
2012 15 3.51 15 2.52 13 4.36 12 3.12 0 . 14 4.76 0 . 1 0.25 0 .
Italy 2008 62 2.32 62 1.04 48 4.10 18 2.97 0 . 37 0.63 0 . 0 . 0 .
2009 62 0.93 61 0.60 40 1.29 14 1.91 0 . 33 2.31 0 . 4 0.99 0 .
2010 85 1.92 82 0.91 56 2.32 29 5.92 0 . 54 2.13 0 . 3 0.07 0 .
2011 90 2.60 88 1.31 57 3.31 31 7.46 0 . 54 6.20 0 . 2 0.04 0 .
2012 91 3.92 91 1.60 77 3.23 88 7.62 0 . 54 5.09 0 . 4 0.78 0 .
Luxembour 2008 6 1.02 6 0.61 6 1.18 2 4.56 0 . 4 0.33 0 . 0 . 0 .
2009 5 0.73 5 0.31 5 0.91 1 3.00 0 . 4 1.55 0 . 0 . 0 .
2010 6 1.00 5 0.71 5 1.11 1 5.85 0 . 5 2.75 0 . 1 2.32 0 .
2011 5 1.49 5 0.53 5 2.04 1 7.79 0 . 3 2.75 0 . 1 6.73 0 .
2012 7 1.16 7 0.24 7 1.35 2 10.88 0 . 6 1.15 0 . 0 . 0 .
Netherlands 2008 34 4.45 34 2.56 34 3.43 17 11.78 0 . 31 5.83 0 . 1 0.01 0 .
2009 34 5.23 33 2.36 33 4.72 8 9.10 0 . 32 7.10 0 . 1 88.24 0 .
2010 36 3.14 36 1.91 36 1.57 20 9.37 0 . 33 5.33 1 22.68 4 14.80 0 .
2011 39 3.64 39 1.21 39 2.60 13 11.53 0 . 36 6.27 3 28.14 2 0.07 0 .
2012 40 3.66 40 1.22 40 2.83 6 13.31 0 . 36 4.80 3 27.60 2 45.33 0 .
Norway 2008 13 9.74 12 8.72 13 8.80 11 13.64 0 . 10 5.09 0 . 0 . 0 .
2009 15 2.29 15 0.37 13 1.35 14 7.37 0 . 12 4.75 0 . 0 . 0 .
2010 17 3.11 17 1.57 17 1.72 17 9.42 0 . 16 5.87 0 . 1 0.22 0 .
2011 17 1.86 16 0.66 16 2.34 15 5.79 0 . 16 3.05 0 . 2 0.00 0 .
2012 18 1.90 16 0.93 17 2.02 17 5.80 0 . 17 2.92 0 . 1 0.02 0 .
Portugal 2008 8 0.65 8 0.48 7 0.44 1 5.03 0 . 4 1.21 0 . 3 0.03 0 .
2009 13 1.30 13 0.67 12 1.43 4 2.42 0 . 8 0.64 0 . 1 0.01 0 .
2010 19 2.18 19 0.47 19 0.81 18 8.43 0 . 17 0.56 0 . 1 0.06 0 .
2011 22 4.02 22 3.33 22 4.23 22 6.16 0 . 18 2.28 0 . 1 0.00 0 .
2012 18 3.62 18 4.12 17 3.70 16 2.07 0 . 15 0.47 0 . 0 . 0 .
Spain 2008 22 1.26 22 0.60 22 1.67 12 1.24 0 . 22 1.06 0 . 2 0.11 0 .
2009 22 1.49 22 1.29 21 1.95 10 3.01 0 . 22 1.49 0 . 5 0.10 0 .
2010 31 2.77 31 1.92 29 3.42 16 2.81 0 . 31 3.29 0 . 2 0.21 0 .
2011 23 2.57 23 1.07 23 4.20 20 4.84 0 . 20 3.33 0 . 6 1.66 0 .
2012 31 3.49 31 1.22 30 5.60 31 8.20 0 . 28 3.07 0 . 2 0.04 0 .
Sweden 2008 0 . 0 . 0 . 0 . 0 . 0 . 0 . 0 . 0 .
2009 7 0.18 3 0.09 4 0.01 3 1.66 0 . 2 0.00 0 . 0 . 0 .
2010 7 4.79 3 0.01 1 0.23 5 8.94 0 . 4 0.02 0 . 0 . 0 .
2011 14 0.06 7 0.01 3 0.10 5 0.79 0 . 7 0.02 0 . 0 . 0 .
2012 7 1.49 1 0.47 1 1.34 4 5.00 0 . 3 0.22 0 . 0 . 0 .
Switzerland 2008 13 1.97 13 1.66 13 2.29 0 . 0 . 10 1.98 0 . 0 . 0 .
2009 14 3.81 14 2.21 14 4.20 5 9.04 0 . 12 3.91 0 . 0 . 0 .
2010 16 4.02 16 0.83 16 4.06 12 15.11 0 . 5 8.78 0 . 0 . 0 .
2011 17 4.49 16 0.99 16 4.27 16 17.03 0 . 8 5.82 0 . 1 0.65 0 .
2012 16 4.98 16 1.25 16 4.11 14 18.18 0 . 7 1.40 0 . 1 99.90 0 .
UK 2008 177 2.13 170 1.22 168 2.35 169 6.14 0 . 172 1.28 0 . 10 5.69 0 .
2009 182 2.85 177 1.39 170 2.29 176 9.60 0 . 178 2.25 0 . 16 13.60 0 .
2010 192 3.24 188 2.06 185 2.92 188 9.55 0 . 188 2.71 0 . 12 12.40 0 .
2011 209 3.38 205 2.36 204 2.36 205 9.37 0 . 205 2.72 0 . 18 12.49 0 .
2012 210 3.23 204 2.44 204 2.65 202 10.55 0 . 207 3.36 0 . 19 14.13 0 .
Total 2008 868 4.73 586 1.64 551 3.18 591 6.93 27 1.77 552 3.40 23 21.14 147 3.64 262 13.11 2009 1254 4.34 974 1.27 916 2.59 728 9.03 26 1.88 627 4.79 60 14.01 192 7.23 258 13.67 2010 1349 4.20 1060 1.32 1012 2.80 892 8.71 30 1.39 681 4.49 68 10.95 224 4.20 262 12.19 2011 1291 4.37 1006 1.58 956 3.32 887 8.11 22 2.38 660 4.73 68 13.42 164 5.63 256 11.47 2012 1116 6.87 948 4.57 968 6.22 751 11.69 9 3.57 607 4.71 49 22.62 143 5.80 52 10.91 PREFERRED / BONDHOLDERS CAPITALIZATION ANTITAKEOVER ORGANIZATION & MERGERS SOCIAL PROPOSALS COMPENSATION
Country
Table 3 - Summary statistics
Variable Mean Median Std Dev Min Max Obs.
TOTAL 4.85 2.47 8.53 0.00 100.00 5,878
ROUTINE / BUSINESS 2.08 0.43 8.48 0.00 147.00 4,574
DIRECTORS 3.67 1.27 8.92 0.00 100.00 4,403
COMPENSATION 8.94 3.98 12.82 0.00 100.00 3,849
PREFERRED / BONDHOLDERS 1.95 0.61 3.53 0.00 16.97 114
CAPITALIZATION 4.45 1.63 8.35 0.00 100.00 3,127
ANTITAKEOVER 15.27 8.76 17.02 0.00 100.00 268
ORGANIZATION & MERGERS 5.31 0.84 11.82 0.00 99.90 870
SOCIAL PROPOSALS 12.53 7.80 13.18 0.11 81.51 1,090
MARKETCAP (USD) 6,749,577 1,345,368 18,000,000 255 301,000,000 10,823
LEVERAGE 0.23 0.21 0.19 0.00 0.80 10,610
MARKETBOOK 2.34 1.62 2.52 -1.59 16.32 10,436
PROFITABILITY 0.01 0.03 0.14 -0.78 0.33 10,614
CROSSLIST 0.14 0.00 0.34 0.00 1.00 6,847
INSIDER 0.27 0.21 0.25 0.00 1.00 9,192
GOV41 50.92 51.22 9.79 19.51 75.61 3,641
IOTOTAL 0.26 0.23 0.20 0.00 1.00 10,574
IODOMESTIC 0.12 0.06 0.14 0.00 0.99 10,574
IOFOREIGN 0.15 0.11 0.14 0.00 0.98 10,574
IOACTIVE 0.24 0.20 0.18 0.00 1.00 10,574
IOPASSIVE 0.02 0.02 0.03 0.00 0.78 10,574
COMMONLAW 0.68 1.00 0.47 0.00 1.00 12,036
GDPPC 46,194 45,100 9,922 22,016 114,508 12,036
Table 4 - Dissent and Institutional Ownership
Panel A: Dissent - Total Panel B: Dissent - Compensation
(1) (2) (3) (4) (5)
IOTOTAL 1.685 (0.281) IODOMESTIC -0.041 (0.986) IOFOREIGN 2.773* (0.061) IOACTIVE 2.420 (0.182) IOPASSIVE -7.707** (0.037) INSIDERCONTROL -1.574** (0.017) GOV41 -0.039* (0.079)
MARKETCAPUSD -0.439*** -0.445*** -0.416*** -0.403*** -0.102
(0.000) (0.000) (0.000) (0.000) (0.482)
LEVERAGE 0.996 0.988 1.029 1.222 1.202
(0.433) (0.432) (0.421) (0.309) (0.299)
MARKETTOBOOK 0.038 0.034 0.030 0.056 -0.037
(0.520) (0.573) (0.598) (0.416) (0.482)
PROFITABILITY -2.701 -2.571 -2.766 -2.691 -7.347**
(0.124) (0.147) (0.116) (0.154) (0.026)
CROSSLIST 0.797 0.677 0.723 0.867 0.262
(0.166) (0.288) (0.209) (0.186) (0.453)
Country Dummies Yes Yes Yes Yes Yes
Year Dummies Yes Yes Yes Yes Yes
Industry Dummies Yes Yes Yes Yes Yes
Observations 4,030 4,030 4,030 3,871 1,628
R-squared 0.131 0.132 0.132 0.134 0.213
Standard errors clustered by country-industry Robust pvalue in parentheses
*** p<0.01, ** p<0.05, * p<0.1
(1) (2) (3) (4) (5)
IOTOTAL 3.558* (0.050) IODOMESTIC -1.031 (0.739) IOFOREIGN 6.618*** (0.005) IOACTIVE 4.584** (0.029) IOPASSIVE -11.329 (0.408) INSIDERCONTROL -1.929 (0.108) GOV41 -0.076 (0.201)
MARKETCAPUSD -0.761*** -0.780*** -0.723*** -0.679*** -0.133
(0.001) (0.001) (0.002) (0.003) (0.702)
LEVERAGE 2.223 2.196 2.270 2.302 2.039
(0.160) (0.162) (0.153) (0.145) (0.412)
MARKETTOBOOK -0.018 -0.026 -0.026 0.005 -0.206
(0.867) (0.815) (0.802) (0.965) (0.220)
PROFITABILITY -6.136*** -5.920*** -6.187*** -6.897*** -9.152*
(0.003) (0.004) (0.003) (0.002) (0.055)
CROSSLIST 0.577 0.239 0.530 0.847 2.386**
(0.599) (0.822) (0.632) (0.420) (0.033)
Country Dummies Yes Yes Yes Yes Yes
Year Dummies Yes Yes Yes Yes Yes
Industry Dummies Yes Yes Yes Yes Yes
Observations 2,646 2,646 2,646 2,584 1,180
R-squared 0.160 0.162 0.161 0.159 0.172
Standard errors clustered by country-industry Robust pvalue in parentheses
Panel C: Dissent - Capitalization Panel D: Dissent - Routine / Business
(1) (2) (3) (4) (5)
IOTOTAL 1.872 (0.342) IODOMESTIC -7.090** (0.025) IOFOREIGN 6.039*** (0.006) IOACTIVE 2.065 (0.343) IOPASSIVE -1.194 (0.864) INSIDERCONTROL -2.790** (0.022) GOV41 -0.032 (0.481)
MARKETCAPUSD -0.304 -0.441** -0.294 -0.281 -0.250
(0.144) (0.040) (0.173) (0.206) (0.307)
LEVERAGE 2.003 1.874 2.037 1.642 1.321
(0.162) (0.187) (0.158) (0.263) (0.521)
MARKETTOBOOK -0.080 -0.091 -0.081 -0.056 -0.108
(0.270) (0.225) (0.257) (0.483) (0.296)
PROFITABILITY -1.016 -0.679 -1.044 -0.747 -0.471
(0.555) (0.709) (0.543) (0.706) (0.900)
CROSSLIST 1.525** 1.161 1.524** 1.273* 1.035*
(0.030) (0.101) (0.032) (0.085) (0.085)
Country Dummies Yes Yes Yes Yes Yes
Year Dummies Yes Yes Yes Yes Yes
Industry Dummies Yes Yes Yes Yes Yes
Observations 2,043 2,043 2,043 1,996 1,114
R-squared 0.124 0.132 0.124 0.135 0.160
Standard errors clustered by country-industry Robust pvalue in parentheses
*** p<0.01, ** p<0.05, * p<0.1
(1) (2) (3) (4) (5)
IOTOTAL 0.091 (0.943) IODOMESTIC 1.049 (0.700) IOFOREIGN -0.664 (0.464) IOACTIVE 0.369 (0.796) IOPASSIVE -3.306 (0.357) INSIDERCONTROL -1.287* (0.051) GOV41 -0.014 (0.518)
MARKETCAPUSD 0.077 0.081 0.087 0.061 0.222
(0.442) (0.432) (0.406) (0.595) (0.108)
LEVERAGE -0.337 -0.358 -0.334 0.168 0.811
(0.756) (0.741) (0.760) (0.876) (0.253)
MARKETTOBOOK 0.037 0.042 0.033 0.036 -0.073
(0.594) (0.579) (0.625) (0.614) (0.149)
PROFITABILITY -1.800 -1.939 -1.844 -1.505 -1.616
(0.522) (0.502) (0.510) (0.587) (0.359)
CROSSLIST -0.178 -0.093 -0.208 -0.247 0.269
(0.693) (0.822) (0.654) (0.541) (0.481)
Country Dummies Yes Yes Yes Yes Yes
Year Dummies Yes Yes Yes Yes Yes
Industry Dummies Yes Yes Yes Yes Yes
Observations 3,181 3,181 3,181 3,041 1,370
R-squared 0.066 0.066 0.066 0.070 0.110
Standard errors clustered by country-industry Robust pvalue in parentheses
Panel E: Dissent - Directors
(1) (2) (3) (4) (5)
IOTOTAL -0.578
(0.640)
IODOMESTIC -2.100
(0.389)
IOFOREIGN 0.382
(0.801)
IOACTIVE -0.310
(0.813)
IOPASSIVE -4.134
(0.354)
INSIDERCONTROL -0.450
(0.607)
GOV41 -0.044
(0.113)
MARKETCAPUSD -0.127 -0.129 -0.117 -0.105 0.139
(0.276) (0.267) (0.311) (0.410) (0.386)
LEVERAGE 1.068 1.088 1.076 1.495 0.948
(0.372) (0.351) (0.369) (0.196) (0.462)
MARKETTOBOOK -0.011 -0.018 -0.015 -0.006 -0.087
(0.890) (0.831) (0.850) (0.937) (0.226)
PROFITABILITY -0.360 -0.146 -0.396 -0.182 -0.706
(0.899) (0.960) (0.889) (0.950) (0.756)
CROSSLIST 0.498 0.395 0.471 0.312 -0.394
(0.339) (0.512) (0.363) (0.579) (0.233)
Country Dummies Yes Yes Yes Yes Yes
Year Dummies Yes Yes Yes Yes Yes
Industry Dummies Yes Yes Yes Yes Yes
Observations 3,089 3,089 3,089 2,946 1,289
R-squared 0.099 0.100 0.099 0.103 0.153
Standard errors clustered by country-industry Robust pvalue in parentheses
Table 5 - Dissent and Institutional Ownership - Common vs Civil Law Countries
Panel A.1: Dissent Total - Common Law Countries
Panel B.1: Dissent Compensation - Common Law Countries
Panel A.2: Dissent Total - Civil Law Countries
Panel B.2: Dissent Compensation - Civil Law Countries
(1) (2) (3)
IOTOTAL 0.535 (0.805) IODOMESTIC -0.339 (0.899) IOFOREIGN 1.170 (0.610) IOACTIVE 1.413 (0.558) IOPASSIVE -15.108*** (0.001)
Country Dummies Yes Yes Yes
Year Dummies Yes Yes Yes
Industry Dummies Yes Yes Yes
Observations 2,492 2,492 2,492
R-squared 0.133 0.133 0.134
Standard errors clustered by country-industry Robust pvalue in parentheses
*** p<0.01, ** p<0.05, * p<0.1 Control variable coefficients not shown
(1) (2) (3)
IOTOTAL 0.310 (0.891) IODOMESTIC -2.505 (0.461) IOFOREIGN 2.633 (0.307) IOACTIVE 1.805 (0.504) IOPASSIVE -31.036** (0.027)
Country Dummies Yes Yes Yes
Year Dummies Yes Yes Yes
Industry Dummies Yes Yes Yes
Observations 1,732 1,732 1,732
R-squared 0.187 0.188 0.190
Standard errors clustered by country-industry Robust pvalue in parentheses
*** p<0.01, ** p<0.05, * p<0.1 Control variable coefficients not shown
(1) (2) (3)
IOTOTAL 6.146*** (0.000) IODOMESTIC 4.134 (0.202) IOFOREIGN 6.786*** (0.000) IOACTIVE 7.128*** (0.000) IOPASSIVE -0.119 (0.978)
Country Dummies Yes Yes Yes
Year Dummies Yes Yes Yes
Industry Dummies Yes Yes Yes
Observations 1,538 1,538 1,538
R-squared 0.219 0.219 0.220
Standard errors clustered by country-industry Robust pvalue in parentheses
*** p<0.01, ** p<0.05, * p<0.1 Control variable coefficients not shown
(1) (2) (3)
IOTOTAL 15.209*** (0.004) IODOMESTIC -3.165 (0.855) IOFOREIGN 20.937*** (0.000) IOACTIVE 17.121*** (0.007) IOPASSIVE 2.452 (0.911)
Country Dummies Yes Yes Yes
Year Dummies Yes Yes Yes
Industry Dummies Yes Yes Yes
Observations 914 914 914
R-squared 0.186 0.189 0.186
Standard errors clustered by country-industry Robust pvalue in parentheses
Panel C.1: Dissent Capitalization - Common Law Countries
Panel A.2: Dissent Capitalization - Civil Law Countries
(1) (2) (3)
IOTOTAL -7.348**
(0.022)
IODOMESTIC -13.008***
(0.004)
IOFOREIGN -3.222
(0.297)
IOACTIVE -6.475**
(0.037)
IOPASSIVE -24.211**
(0.021)
Country Dummies Yes Yes Yes
Year Dummies Yes Yes Yes
Industry Dummies Yes Yes Yes
Observations 852 852 852
R-squared 0.145 0.150 0.147
Standard errors clustered by country-industry Robust pvalue in parentheses
*** p<0.01, ** p<0.05, * p<0.1 Control variable coefficients not shown
(1) (2) (3)
IOTOTAL 8.523***
(0.000)
IODOMESTIC 3.604
(0.484)
IOFOREIGN 9.883***
(0.001)
IOACTIVE 9.867***
(0.000)
IOPASSIVE -1.609
(0.892)
Country Dummies Yes Yes Yes
Year Dummies Yes Yes Yes
Industry Dummies Yes Yes Yes
Observations 1,191 1,191 1,191
R-squared 0.198 0.199 0.199
Standard errors clustered by country-industry Robust pvalue in parentheses
Table 6 - Dissent and Institutional Ownership - Country Control Variables
Panel A: Dissent Total Panel B: Dissent Compensation Panel C: Dissent Capitalization
(1) (2) (3)
IOTOTAL -2.353* (0.063) IODOMESTIC -5.525*** (0.002) IOFOREIGN 0.832 (0.540) IOACTIVE -1.456 (0.334) IOPASSIVE -12.716*** (0.001)
COMMONLAW 0.037 0.350 -0.127
(0.932) (0.438) (0.779)
GDPPC -0.000 -0.000 0.000
(0.804) (0.506) (0.968) MARKETCAPGDP 2.002*** 2.202*** 2.024***
(0.000) (0.000) (0.000)
Country Dummies No No No
Year Dummies Yes Yes Yes
Industry Dummies Yes Yes Yes
Observations 4,030 4,030 4,030
R-squared 0.089 0.093 0.090
Standard errors clustered by country-industry Robust pvalue in parentheses
*** p<0.01, ** p<0.05, * p<0.1 Control variable coefficients not shown
(1) (2) (3)
IOTOTAL 12.192*** (0.000) IODOMESTIC 11.620*** (0.000) IOFOREIGN 12.819*** (0.000) IOACTIVE 13.973*** (0.000) IOPASSIVE -12.525 (0.232) COMMONLAW -6.106*** -6.060*** -6.456***
(0.000) (0.000) (0.000)
GDPPC -0.000* -0.000** -0.000
(0.053) (0.049) (0.138) MARKETCAPGDP 5.719*** 5.754*** 5.764***
(0.000) (0.000) (0.000)
Country Dummies No No No
Year Dummies Yes Yes Yes
Industry Dummies Yes Yes Yes
Observations 2,646 2,646 2,646
R-squared 0.124 0.124 0.126
Standard errors clustered by country-industry Robust pvalue in parentheses
*** p<0.01, ** p<0.05, * p<0.1 Control variable coefficients not shown
(1) (2) (3)
IOTOTAL -1.512 (0.361) IODOMESTIC -10.983*** (0.000) IOFOREIGN 5.071*** (0.009) IOACTIVE -0.074 (0.968) IOPASSIVE -14.604*** (0.007) COMMONLAW -1.578** -1.086* -1.738***
(0.012) (0.093) (0.006)
GDPPC -0.000 -0.000 0.000
(0.902) (0.346) (0.859) MARKETCAPGDP 0.969* 1.607*** 0.944
(0.094) (0.008) (0.105)
Country Dummies No No No
Year Dummies Yes Yes Yes
Industry Dummies Yes Yes Yes
Observations 2,043 2,043 2,043
R-squared 0.065 0.082 0.068
Standard errors clustered by country-industry Robust pvalue in parentheses
Table 7 - Dissent and Institutional Ownership - Cluster by Country
Panel A: Dissent Total Panel B: Dissent Remuneration Panel C: Dissent Capitalization
(1) (2) (3)
IOTOTAL 1.685 (0.124) IODOMESTIC -0.041 (0.975) IOFOREIGN 2.773** (0.025) IOACTIVE 2.420** (0.034) IOPASSIVE -7.707* (0.080)
Country Dummies Yes Yes Yes
Year Dummies Yes Yes Yes
Industry Dummies Yes Yes Yes
Observations 4,030 4,030 4,030
R-squared 0.131 0.132 0.132
Standard errors clustered by country Robust pvalue in parentheses *** p<0.01, ** p<0.05, * p<0.1 Control variable coefficients not shown
(1) (2) (3)
IOTOTAL 3.558 (0.198) IODOMESTIC -1.031 (0.872) IOFOREIGN 6.618** (0.014) IOACTIVE 4.584 (0.164) IOPASSIVE -11.329 (0.434)
Country Dummies Yes Yes Yes
Year Dummies Yes Yes Yes
Industry Dummies Yes Yes Yes
Observations 2,646 2,646 2,646
R-squared 0.160 0.162 0.161
Standard errors clustered by country Robust pvalue in parentheses *** p<0.01, ** p<0.05, * p<0.1 Control variable coefficients not shown
(1) (2) (3)
IOTOTAL 1.872 (0.593) IODOMESTIC -7.090** (0.010) IOFOREIGN 6.039 (0.113) IOACTIVE 2.065 (0.580) IOPASSIVE -1.194 (0.868)
Country Dummies Yes Yes Yes
Year Dummies Yes Yes Yes
Industry Dummies Yes Yes Yes
Observations 2,043 2,043 2,043
R-squared 0.124 0.132 0.124
Table 8 - Dissent and Institutional Ownership - Cluster by Country-Year
Panel A: Dissent Total Panel B: Dissent Compensation Panel C: Dissent Capitalization
(1) (2) (3)
IOTOTAL 1.685** (0.019) IODOMESTIC -0.041 (0.982) IOFOREIGN 2.773** (0.026) IOACTIVE 2.420*** (0.007) IOPASSIVE -7.707 (0.170)
Country Dummies Yes Yes Yes
Year Dummies Yes Yes Yes
Industry Dummies Yes Yes Yes
Observations 4,030 4,030 4,030
R-squared 0.131 0.132 0.132
Standard errors clustered by country-year Robust pvalue in parentheses
*** p<0.01, ** p<0.05, * p<0.1 Control variable coefficients not shown
(1) (2) (3)
IOTOTAL 3.558 (0.218) IODOMESTIC -1.031 (0.818) IOFOREIGN 6.618** (0.019) IOACTIVE 4.584 (0.118) IOPASSIVE -11.329 (0.348)
Country Dummies Yes Yes Yes
Year Dummies Yes Yes Yes
Industry Dummies Yes Yes Yes
Observations 2,646 2,646 2,646
R-squared 0.160 0.162 0.161
Standard errors clustered by country-year Robust pvalue in parentheses
*** p<0.01, ** p<0.05, * p<0.1 Control variable coefficients not shown
(1) (2) (3)
IOTOTAL 1.872 (0.431) IODOMESTIC -7.090*** (0.005) IOFOREIGN 6.039** (0.021) IOACTIVE 2.065 (0.410) IOPASSIVE -1.194 (0.851)
Country Dummies Yes Yes Yes
Year Dummies Yes Yes Yes
Industry Dummies Yes Yes Yes
Observations 2,043 2,043 2,043
R-squared 0.124 0.132 0.124
Standard errors clustered by country-year Robust pvalue in parentheses