Tomás Prisca Martins Ferreira
Licenciado em Engenharia e Gestão Industrial
A Systematic Review Approach of
Continuous Improvement Pillar
Management Framework’s
Dissertação para obtenção do Grau de Mestre em Engenharia e Gestão Industrial
Orientador: Alexandra Tenera, Professora
Doutora, FCT-UNL, Lisboa
Júri:
Presidente: Prof. Doutor Rogério Salema Araújo Puga Leal Arguente: Prof. Doutora Graça Maria Oliveira Miranda Silva Vogal: Prof. Doutora Alexandra Maria Baptista Ramos Tenera
Março de 2018
Creativity, Challenge and Courage: the Three C’s Shoichiro Toyoda
Universidade Nova de Lisboa Faculdade de Ciências e Tecnologia Departamento de Engenharia Mecânica e Industrial
A Systematic Review Approach of
Continuous Improvement Pillar
Management Framework’s
Tomás Prisca Martins Ferreira
Dissertação para obtenção do Grau de Mestre emEngenharia e Gestão Industrial
Orientador: Alexandra Tenera, Professora
Doutora, FCT-UNL, Lisboa
ii A Systematic Review Approach of Continuous Improvement Pillar Management
Framework’s
Copyright © 2018
Tomás Prisca Martins Ferreira Faculdade de Ciências e Tecnologia Universidade Nova de Lisboa
A Faculdade de Ciências e Tecnologia e a Universidade Nova de Lisboa têm o direito, perpétuo e sem limites geográficos, de arquivar e publicar esta dissertação através de exemplares impressos reproduzidos em papel ou forma digital, ou por qualquer outro meio conhecido ou que venha a ser inventado, e de a divulgar através de repositórios científicos e de admitir a sua cópia e distribuição com objetivos educacionais ou de investigação, não comerciais, desde que seja dado crédito ao autor e editor.
The Faculdade de Ciências e Tecnologia of the Universidade Nova of Lisbon as the right, perpetual and without geographical boundaries, to file and publish this thesis through printed copies reproduced on paper or digital form, or by any other means known or that may be invented, and to disseminate through scientific repositories and admit their copying and distribution with educational or investigation purposes, non-commercial, as long as it is given credit to the author and editor.
iii
Acknowledgements
First of all, I want to thank my parents for helping me accomplish my dreams. To my mother for all the friendly conversations and incentives not to give up. Always presented, without you I would not be where I am today. To my father for all the moments of reflection and learning. You never stopped believing in me and acknowledging my worth.To my dear sisters who are the joy of my life. I am a proud brother for the path that you are creating.
To my teacher Alexandra Tenera for the support, and the patience, during the realization of this dissertation.
I want to thank Fernando, Miguel and Fabio for being always present in my life and for helping me to get up in the bad moments.
To Marina that even far, continued to be very important to me especially with many moments of laughter.
To Manuela who never made me stop believing in my abilities and who always had a word of encouragement.
To Rita and Catarina because you always animate my day.
Finally I want to thank all my relative, especially my grandparents, and friends who help me one way or another to follow the path.
v
Abstract
Today’s market is constantly changing, so companies are required to continuously evolve their processes so that they can meet the increasingly complex requirements of stakeholders, from customer needs to sustainable policies. The application of Business Process Management improves its processes, bringing together all the activities carried out by the company that aim to generate value for the client. As a consequence, one of the biggest problems for companies is the absence of information management and communication with internal and external stakeholders. Duplication and deprivation are very common in these companies and generate a huge amount of waste.To solve this problem the developments done in this research work aims to generate a new way of looking to Business Management, focusing on companies that adopt Continuous Improvement, using a structured flow of tools and techniques. In structured approaches to Continuous Improvement management frameworks recurrently uses modelling support pillars. This study is based on a company that has implemented eight-pillar Total Productive Maintenance (TPM) and uses performance indicators to monitor the state of systems and processes. The first step involved the application of the Cluster, Discriminant and Principal Component Analysis, so that it was possible to aggregate the indicators of each pillar. The processes of strategic management of the company and management of the pillars have been taken into account.
Through the proposed approach a reduction of around 86% in the total number of pillar of the company was obtained, avoiding diverse informational wastes through redundancies of information, increased reliability, coherence and ease of access to it as well as greater visibilities of their interactions and information responsibilities necessary to the management of systems management of continuous improvement, based on pillars of action.
Keywords: Performance Indicators, Business Process Management, Cluster and Discriminant Analysis, Principal Component Analysis.
vii
Resumo
O Mercado atual está em constante mudança, de modo que é exigido às empresas que evoluam continuamente os seus processos para que estes possam atender aos cada vez mais complexos requisitos das partes interessadas, desde as necessidades do cliente até às políticas sustentáveis. A aplicação da Gestão de Processos de Negócio melhora os seus processos, congregando todas as atividades realizadas pela empresa que têm por objetivo gerar valor para o cliente. Em consequência disso surge um dos maiores problemas das empresas, a ausência de gestão da informação e comunicação com as partes interessadas internas e externas. A duplicação e privação são muito comuns nestas empresas e geram uma enorme quantidade de desperdícios.Para resolver este problema o desenvolvimento feito neste trabalho tem por objetivo gerar uma nova forma de olhar para a Gestão de Negócio, com foco em empresas que adotam a Melhoria Contínua, utilizando um fluxo estruturado de ferramentas e técnicas. Em abordagens estruturadas de gestão da melhoria contínua, são recorrentemente utilizados pilares de apoio estruturais. Este estudo é baseado numa empresa que implementou a Manutenção Produtiva Total (TPM- Total Productive Maintenance), com oito pilares, e utiliza indicadores de performance para monitorizar o estado dos sistemas e processos. A primeira etapa envolveu a aplicação das Análise de Clusters, Discriminante e de Componentes Principais, para que fosse possível agregar os indicadores de cada pilar. Os processos de gestão estratégica da empresa e gestão dos pilares foram tidos em consideração.
Através da abordagem proposta foi obtida uma redução de cerca de 86% no número total de pilares da empresa, evitando-se assim diversos desperdícios informacionais através de redundâncias de informação, aumento da fiabilidade, coerência e facilidade de acesso à mesma bem como uma maior visibilidades das suas interações e responsabilidades de informação necessária à gestão de sistemas de gestão de melhoria contínua baseados em pilares de atuação.
Palavras-chave: Indicadores de Performance, Gestão de Processos de Negócio, Análise de Clusters e Discriminante, Análise de Componentes Principais.
ix
Table of Contents
1 Chapter – Introduction ... 1
1.1 Content & Scope Research ... 1
1.2 Objectives ... 1
1.3 Research Study Approach ... 2
1.4 Thesis Structure ... 3
2 Chapter – Continuous Business Management ... 5
2.1 Continuous Improvement Process (CIP) Approaches ... 8
2.1.1 Total Quality Management (TQM) ... 9
2.1.2 Six Sigma ... 10
2.1.3 Theory of Constraints (TOC) ... 11
2.1.4 Lean Thinking ... 13
2.1.5 Total Productive Maintenance (TPM) ... 16
2.2 Performance and Assessment Systems Indicators ... 19
2.3 Decision Tools for Business Modelling ... 22
2.3.1 Cluster Analysis ... 22
2.3.2 Verification/Validation (AHP) ... 25
2.3.3 Discriminant Analysis ... 28
2.3.4 Principal Component Analysis (PCA) ... 29
2.3.5 Tools Software... 31
2.4 Business Process Modelling ... 31
3 Chapter – Business Model Assessment (BMA) Framework Proposal ... 35
3.1 Model Contextualization ... 35
3.2 Dataset Main Characteristics ... 37
3.2.1 Data for the Cluster Analysis ... 38
3.2.2 Data for the Analytic Hierarchy Process ... 40
3.2.3 Data for the Discriminant Analysis ... 44
3.2.4 Data for the Principal Component Analysis ... 45
3.3 Proposed Business Model Assessment ... 48
4 Chapter – BMA Case Exemplification ... 51
x
4.2 Analytic Hierarchy Process Results ... 60
4.3 Discriminant Analysis Results ... 64
4.4 Principal Component Analysis Results ... 69
4.5 Results Discussion ... 72
5 Chapter – Conclusion & Future Developments ... 81
References ... 83
A Cluster Analysis Inputs Appendix ... 89
B Cluster Memberships & Dendograms Appendix ... 97
C AHP Information Appendix ... 109
D Discriminant Analysis Information Appendix ... 115
xi
List of Figures
Figure 1.1 - Research Methodology Flowchart ... 2
Figure 2.1 - Organizational Process Schematic Representation ... 6
Figure 2.2 - Conceptual framework of efficiency and effectiveness ... 7
Figure 2.3 - TOC Schematic Summary ... 11
Figure 2.4 - The Toyota Production System House ... 14
Figure 2.5 - TPM pillars ... 17
Figure 2.6 - Hierarchy of Performance Indicators ... 21
Figure 3.1 - FIC Mean and Std. Dev. (PCA) ... 46
Figure 3.2 - Methodology Proposed Diagram ... 48
Figure 3.3 - Flowchart of the Selected Cluster ... 49
Figure 4.1 - Hierarchical Cluster Analysis (a) Variables; (b) Statistics; (c) Method; (d) Plots .... 52
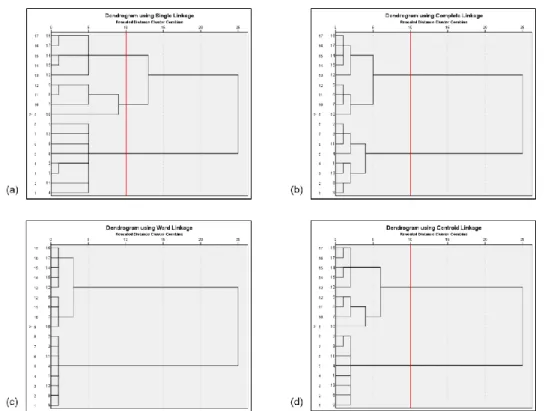
Figure 4.2 - FIC pillar Hierarchical (a) Nearest; (b) Furthest; (c) Ward; (d) Centroid Method Dendogram ... 54
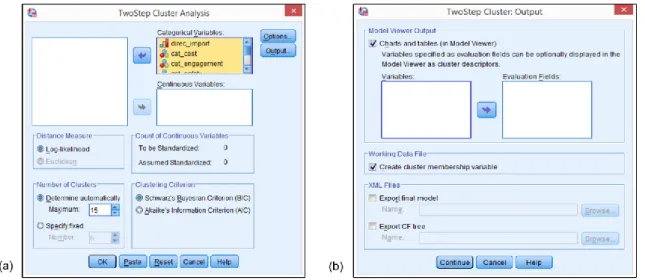
Figure 4.3 - TwoStep Cluster Analysis (a) Variables; (b) Output ... 55
Figure 4.4 - TwoStep Cluster Analysis (a) Model Summary; (b) Cluster Sizes ... 55
Figure 4.5 - K-Means Cluster Analysis (a) Variables; (b) Options; (c) Save ... 57
Figure 4.6 - Discriminant Analysis (a) Variables; (b) Range; (c) Statistics ... 64
Figure 4.7 - Discriminant Analysis (a) Method; (b) Classification; (c) Save ... 65
Figure 4.8 - Principal Component Analysis (a) Variables; (b) Descriptive; (c) Extraction; (d) Rotation ... 69
Appendix Figure B.1 - AM pillar Hierarchical (a) Nearest; (b) Furthest; (c) Ward; (d) Centroid Method Dendogram ... 104
Figure B.2 - PM pillar Hierarchical (a) Nearest; (b) Furthest; (c) Ward; (d) Centroid Method Dendogram ... 104
Figure B.3 - QM pillar Hierarchical (a) Nearest; (b) Furthest; (c) Ward; (d) Centroid Method Dendogram ... 105
Figure B.4 - EM pillar Hierarchical (a) Nearest; (b) Furthest; (c) Ward; (d) Centroid Method Dendogram ... 105
Figure B.5 - ET pillar Hierarchical (a) Nearest; (b) Furthest; (c) Ward; (d) Centroid Method Dendogram ... 106
Figure B.6 - SCO pillar Hierarchical (a) Nearest; (b) Furthest; (c) Ward; (d) Centroid Method Dendogram ... 106
Figure B.7 - SHE pillar Hierarchical (a) Nearest; (b) Furthest; (c) Ward; (d) Centroid Method Dendogram ... 107
xiii
List of Tables
Table 2.1 - Goldratt's Five Steps ... 12
Table 2.2 - The 8 pillars of TPM ... 17
Table 2.3 - 5S Depiction ... 18
Table 2.4 - Scale of Criteria Relative Importance ... 26
Table 2.5 - Values of Random Index ... 27
Table 2.6 - KMO Statistic values ... 30
Table 2.7 - The Three Waves of Process Orientation ... 33
Table 3.1 - Company's PIs ... 37
Table 3.2 - Direction/Importance levels ... 38
Table 3.3 - FIC Pillar Cluster Analysis Input ... 39
Table 3.4 - Scale of Criteria Relative Importance II ... 41
Table 3.5 - Criteria Pair Comparison ... 41
Table 3.6 - Method Pair Comparison (Suitability) ... 42
Table 3.7 - Method Pair Comparison (Cluster Structure) ... 43
Table 3.8 - Method Pair Comparison (Output) ... 43
Table 3.9 - Method Pair Comparison (Sample Size)... 43
Table 3.10 - Method Pair Comparison (Bootstrapping) ... 44
Table 3.11 - Method Pair Comparison (Automatic Cluster Definition) ... 44
Table 3.12 - FIC Pillar previous state ... 45
Table 3.13 - Rand() and distribution Function (PCA) ... 46
Table 3.14 - FIC Pillar samples (PCA) ... 47
Table 4.1 - FIC Hierarchical Cluster Membership ... 53
Table 4.2 - FIC TwoStep Cluster Membership ... 56
Table 4.3 - K-Means Cluster Distance between Cluster Centers ... 57
Table 4.4 - FIC K-Means Cluster Membership ... 58
Table 4.5 - Hierarchical Clusters methods decision ... 59
Table 4.6 - Results Cluster Analysis ... 59
Table 4.7 - Comparison Matrix A (AHP) ... 60
Table 4.8 - Matrix 𝐴𝑛𝑜𝑟𝑚 (AHP) ... 60
Table 4.9 - Values of Random Index (RI) ... 61
Table 4.10 - Comparison Matrix S and Priorities (I) ... 62
Table 4.11 - Priorities Matrix (AHP)... 63
Table 4.12 - Ranking Method Priorities (AHP) ... 63
Table 4.13 - FIC Tests of Equality of Group Means ... 65
Table 4.14 - FIC Eigenvalues ... 66
Table 4.15 - FIC Wilk's lambda ... 66
Table 4.16 - FIC Structure Matrix ... 66
Table 4.17 - FIC Canonical Discriminant Function ... 67
xiv
Table 4.19 - Discriminant Analysis of the eight pillars (cross-validated) ... 68
Table 4.20 - FIC pillar KMO and Bartlett's Test... 70
Table 4.21 - FIC Total Variance Explained and Rotated Component Matrix ... 71
Table 4.22 - Initial State Pillars and Indicators ... 72
Table 4.23 - Decision methods and number of Clusters and Components ... 72
Table 4.24 - FIC pillar Component Description ... 73
Table 4.25 - AM pillar Component Description ... 74
Table 4.26 - PM pillar Component Description ... 74
Table 4.27 - QM pillar Component Description ... 75
Table 4.28 - ET pillar Component Description ... 76
Table 4.29 - EM pillar Component Description ... 76
Table 4.30 - SCO pillar Component Description ... 77
Table 4.31 - SHE pillar Component Description ... 78
Table 4.32 - After methodology development Pillars and Indicators... 79
Appendix Table A.1 - AM Pillar Cluster Analysis Input ... 89
Table A.2 - PM Pillar Cluster Analysis Input ... 90
Table A.3 - QM Pillar Cluster Analysis Input ... 91
Table A.4 - EM Pillar Cluster Analysis Input ... 92
Table A.5 - ET Pillar Cluster Analysis Input ... 93
Table A.6 - SCO Pillar Cluster Analysis Input ... 94
Table A.7 - SHE Pillar Cluster Analysis Input ... 95
Table B.1 - AM Cluster Membership (three methods)... 97
Table B.2 - PM Cluster Membership (three methods)... 98
Table B.3 - QM Cluster Membership (three methods) ... 99
Table B.4 - EM Cluster Membership (three methods)... 100
Table B.5 - ET Cluster Membership (three methods) ... 101
Table B.6 - SCO Cluster Membership (three methods) ... 102
Table B.7 - SHE Cluster Membership (three methods) ... 103
Table C.1 - Comparison Matrix S and Priorities (II) ... 109
Table C.2 - Comparison Matrix S and Priorities (III) ... 110
Table C.3 - Comparison Matrix S and Priorities (IV) ... 111
Table C.4 - Comparison Matrix S and Priorities (V) ... 112
Table C.5 - Comparison Matrix S and Priorities (VI) ... 113
Table D.1 - Discriminant Analysis Eigenvalue, Wilk’s and Cross-Validated ... 115
Table E.1 - FIC Principal Component Analysis Input (i) ... 117
Table E.2 - FIC Principal Component Analysis Input (ii) ... 118
Table E.3 - FIC Principal Component Analysis Input (iii) ... 119
xv
Table E.5 - FIC Principal Component Analysis Input (v) ... 121
Table E.6 - FIC Principal Component Analysis Input (vi) ... 122
Table E.7 - FIC Principal Component Analysis Input (vii) ... 123
Table E.8 - FIC Principal Component Analysis Input (viii) ... 124
Table E.9 - AM Principal Component Analysis Input (i) ... 125
Table E.10 - AM Principal Component Analysis Input (ii) ... 126
Table E.11 - AM Principal Component Analysis Input (iii) ... 127
Table E.12 - AM Principal Component Analysis Input (iv) ... 128
Table E.13 - AM Principal Component Analysis Input (v) ... 129
Table E.14 - AM Principal Component Analysis Input (vi) ... 130
Table E.15 - AM Principal Component Analysis Input (vii) ... 131
Table E.16 - AM Principal Component Analysis Input (viii) ... 132
Table E.17 - AM pillar KMO and Bartlett's Test... 133
Table E.18 - AM Total Variance Explained and Rotated Component Matrix ... 133
Table E.19 - ET Principal Component Analysis Input (i) ... 134
Table E.20 - ET Principal Component Analysis Input (ii) ... 135
Table E.21 - ET Principal Component Analysis Input (iii) ... 136
Table E.22 - ET Principal Component Analysis Input (iv) ... 137
Table E.23 - ET Principal Component Analysis Input (v) ... 138
Table E.24 - ET Principal Component Analysis Input (vi) ... 139
Table E.25 - ET Principal Component Analysis Input (vii) ... 140
Table E.26 - ET Principal Component Analysis Input (viii) ... 141
Table E.27 - ET pillar KMO and Bartlett's Test ... 142
xvii
List of Abbreviations, Acronyms and Symbols
AHP – Analytic Hierarchy ProcessBD – Breakdowns
BMA – Business Management Assessment BPI – Business Process Integration
BPM – Business Process Management
BPMS – Business Process Management Software BPR – Business Process Reengineering
CAD – Computer-Aided Design
CAM – Computer-Assisted Manufacturing CASE – Computer-Aided Software Engineering CI – Consistency Index
CIL – Cleaning, Inspection and Lubrication. CIP – Continuous Improvement Process CSF – Critical Success Factors
DRE – Detail Reference Expression FEO – For Exposition Only Diagram
ICAM – Integrated Computer-Aided Manufacturing IT – Information Technology
KAI – Key Activity Indicator KMI – Key Management Indicator KMO – Kaiser-Meyer-Olkin statistic KPI – Key Process Indicator MDT – Mean Down Time
MTBF – Mean Time Between Failures MTTR – Mean Time To Repair PCA – Principal Component Analysis PI – Performance Indicators
xviii RI – Random Index
SADT – Structured Analysis and Design Technique SE – Software Engineering
SDF – Structure Data Flow SDM – Sequential Design Method SBM – Simultaneous Business Method SMT – Senior Management Team
SSCP – Pure Sums of Squares and Cross Products Matrix TOC – Theory of Constraints
TP – Thinking Process
TPM – Total Productive Maintenance TQM – Total Quality Management VSM – Value Stream Mapping WIP – Work in Process
1
1
Chapter – Introduction
1.1
Content & Scope Research
Since we are living in a market of continuous change, with the introduction of new productive processes, technologic innovations and with less than two years product life cycle, companies are demanded to constantly adapt so they can meet their client’s needs.
Also the degree of competitiveness is increasing and there is an increasing competition even in sectors and areas of business where before there was only a small number of Leading Companies, which aligned with the change of client needs, who want customized products, demanded companies to be more flexible so it is possible to produce a large number of “versions” of the final product, with features that go towards getting the greatest possible satisfaction of the customers.
With this in mind it is increasingly vital that companies have a management of all systems that not only meet customer requirements, but also the entire universe of stakeholders. Those management systems are needed in order to carry company’s business management policies, objectives and methodologies that allow the improvement of the organization's performance, setting goals, making the verification, monitoring and implementing corrective and preventive actions that aim the premise of Continuous Improvement.
“Value and Risk management enables organizations to succeed in the delivery of ambitious projects by defining their desired outcomes and then exercising processes that maximise value and minimise uncertainty.
A successful outcome requires that the value to the business is maximized through the delivery of a facility that gives them the benefits they need at a price they can afford at the time when they need it at a quality that fulfils their expectations” (Dallas, 2006, p. 1).
This work aims to elaborate a systematic analysis of performance indicators adopted in infrastructural pillar management continuous improvement system, congregating different types of decision and management tools, in order to stimulate new ways of looking to Process Management.
1.2
Objectives
This proposal was based on the premise that it is possible to implement pillar structures on process management that can facilitate the information and communication between stakeholders, intern or extern to the company, by eliminating excess of information, duplication of procedures/information and redundancy.
2 A Proposed Business Model will than flow after this process is accomplished and it will be based on a company that applies one Continuous Improvement Process approach, for this case TPM (Total Productive Maintenance). The pillar revision will generate a new pragmatic and focalized vision of companies’ information, so it will be possible to filter the information across all the distinctive areas of business.
To provide a more accurate entrepreneurial modelling the research will focused on the companies’ Performance Indicators in used, specially having in mind if it is possible to cluster them in larger groups so the information can be rapidly acknowledge by all interested parts. By doing this it will generate a more effective and efficient Managing System for each company.
1.3
Research Study Approach
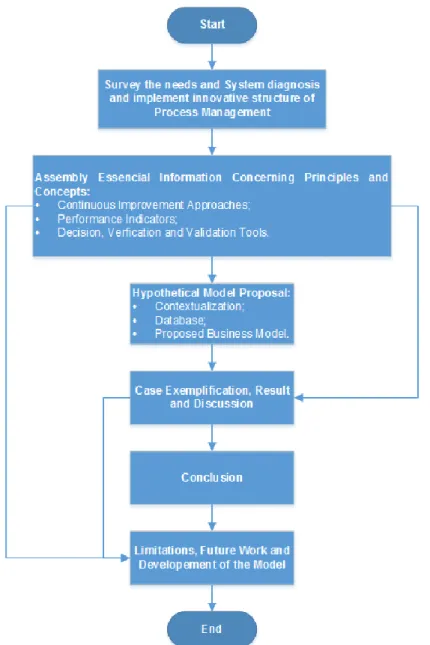
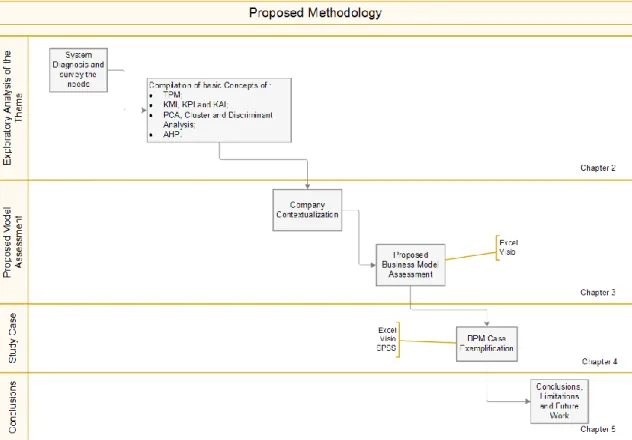
The applied research approach to develop this work is shown in Figure 1.1, where a flowchart is presented to more easily depict the structure of this research.
3 Having set forth the objective of this thesis, this work advances with the Research Study Approach that will be utilized to allow the completion of the Proposed Model described and consequent result obtained from the Business Process Management (BPM) Case Exemplification.
The first stage of this process is the assembly of essential information related to the principles and concepts being revised and the identification of all available techniques that are helpful when managing business.
The first step of this stage begins by collecting information about Managing Business, regarding the existing proposals to manage them, and also information that concerns the different approaches of Continuous Improvement of Processes (CIP). The tools from the CIP are then compared and discussed so it can be possible to acknowledge the existing needs.
Next, the Performance Indicators (PI) are identified and characterized to recognize the importance of this measures when diagnosing the system and the processes that need to be improved.
To help the decision, verification and validation when addressing PI’s and Systems Management certification, information about Decision tools for business modelling was then gathered and depicted in the final step of this stage.
After this stage a Proposed Model is presented with the implemented Methodology and designed structure of Process Management. The contextualization and the collected dataset are defined. This stage is necessary to know the company status, concerning the different Managing Systems, in order to be able to make a diagnosis and to survey the needs that are essential to the development of this work.
Subsequently, to the Proposed Model depiction, a BPM Case exemplification is addressed so it is possible to validate the former stage of this work and also to create a new characterization of the process with an innovative technique that allows the optimization of the system.
Finally, bearing in mind the previous step, result analysis and discussion are done. Conclusions, advantages and future work will be address and verified about the implementation of this new Model.
1.4
Thesis Structure
The purpose of this chapter is to describe how the dissertation was structured. Having this in mind the current work was divided in five distinctive Chapters.
The first Chapter objective is to give a prime description of what is the study undertaken in this work. It starts with an introduction of the content and scope research, depicting the characteristics of this work. The next step describes the considerations about what are the truly significant objectives and acknowledges the main focus of this paper. The third step is the research study
4 approach applied, that originated this dissertation, and the last step is the chosen structure of chapters for the present work.
On the second Chapter is presented a succinct description of the Business Process Management and the Continuous improvement approaches, with reference to the respective characteristics, tools and techniques. Also in this chapter there is a depiction of Performance Indicators, System Certification and Decision tools, all of these correlated with Business Modelling.
The third Chapter features the full structure of the proposed Business Model Assessment. This chapter begins with the proposed contextualization followed by a diagram representing the flow of the implemented methodology. Then all the dataset is described and commented with the help of figures and tables. The chapter concludes with the development of the proposed Model, always considering the information obtained in the second Chapter.
On the fourth Chapter is depicted the BPM Case exemplification with the application test of the Model presented in the previous one. In this Chapter terminus the obtain results are shown, compared and discussed.
The fifth Chapter presents the main Conclusions of the study that can demonstrate the validation of the Model proposed. The Model Limitations are described and the Future Work and Developments for this project are suggested, followed by the research reference list and supporting appendixes.
5
2
Chapter – Continuous Business Management
Nowadays, the basic element that defines a company’s’ business strategy is market competitiveness. Companies aim to be more competitive regarding prices, quality of the product/service, productivity, location, time-to-market, customer and supplier portfolios, due to the importance that these factors have in differentiating them from their peers.
“Organizations are looking out for inspired leadership and people with far-away vision to bring about fundamental changes both within and outside the firm in order to grow, build and excel in the twenty first century” (Rao & Srinivasulu, 2013, p. 74).
Organizations also depend upon teamwork efforts. This requires understanding the interdependencies among team members and using them effectively in order to achieve the common goal (Mission) (Cardona & Wilkinson, 2006).
Other relevant area in an organization is the process management. A process can be defined as a sequence of interrelated events or activities that are carried out by the company’s various areas of activity, consuming various resources to convert one or more raw materials into one final element with added value. It involves the transformation of inputs in outputs (Mallar, 2010). There are two different types of processes (Mallar, 2010):
1. Business Processes are the ones that directly serve the mission of the business and satisfy the customer’s specific needs and can be classified as:
Strategic management processes – those that through which a firm or a joint direction of a network, plan organize, direct and control resources.
Operative or Key Processes – those that impact directly on the customer’s satisfaction and on any other aspect of the mission of the organization.
2. Strategic Processes are the internal services necessary for business process, also called secondary processes.
A Business Process can be considered as a complete, dynamical and coordinated set of collaborative and transactional activities that deliver value to the customer (Smith & Fingar, 2007). A business process starts with an event in which the plan to achieve the main goal is launched. It continues until every demand of the stakeholder, which initiated the first event, is fulfilled and the outcome of the process satisfies all parts involved. Activity is the major unit of work to be completed in achieving the objectives and performing actions specific to a process. Every activity has a supplier and a customer, whom can be internal or external. Internal processes are part of the organization and their activities take an input from a previous stage of the process or internal supplier which adds value to it and provides an output to the following work step or internal customer.
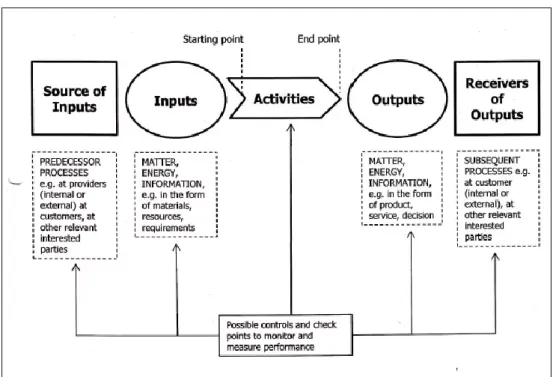
6 Business processes require the consumption of resources that can be inputs, such as raw materials and information about the requirements demanded by the customer, or equipment and people needed to transform the inputs. Also all processes must meet customer, organizational and applicable regulatory requirements. Their performance can be monitored and measured using controls and check points and the gathered data can be analysed to conclude whether any corrective action or improvement will be needed. This is shown in Figure 2.1.
Figure 2.1 - Organizational Process Schematic Representation1
A true process comprises all the things that the company does to provide stakeholders with what they are expecting to receive. The process also contains all the actions that the company has to undertake when it fails to meet those expectations.
The processes are defined and managed in a structured way, and an improvement of each one is based on the improvement across the whole organization. Considering processes provides an integral vision that allows the understanding of the global activities (Mallar, 2010).
Management of Processes is to execute transformation projects that improve the products or services delivered to the customers. It is also the methodology that improves the company’s day-by-day in and sorted and systematic way, with an approach that focuses the attention in optimizing every aspect of the various activities.
The main goal with this kind of management is to improve the processes efficiency, by maximizing the results interposing them with the resources consumed during the activities, and effectiveness, which relates the efficiency with the customer’s satisfaction, and compares the outcomes obtained with the expected ones. It’s also important to have in mind the satisfaction, “which is the
7 user’s comfort with and positive attitudes towards the use of the system” (Frøkjær, Hertzum & Hornbæk, 2000, p. 345).
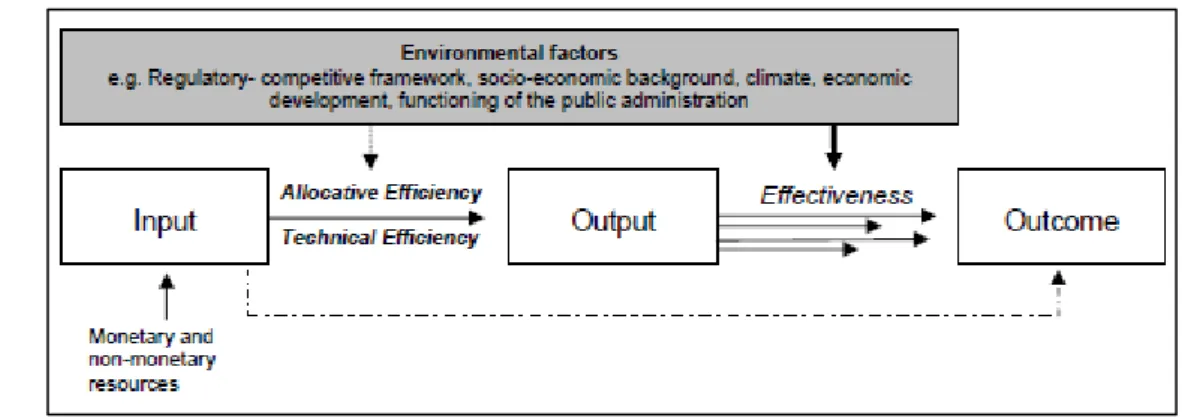
Efficiency and effectiveness are mutually reinforcing and their analysis relates the link between inputs, outputs and outcomes (Mandl, Dierx & Ilzkovitz, 2008).
Figure 2.2 shows a conceptual framework of efficiency and effectiveness.
Figure 2.2 - Conceptual framework of efficiency and effectiveness (Source: Mandl, Dierx & Ilzkovitz, 2008, p. 3)
Thus, the advantages in adopting Process Management are (Barros, 2003; Laurindo & Rotondaro, 2006):
Improve the Product or Service value that is delivered to the customer – The Company is organized through a vision that favours the performance of its activities always based on the satisfaction of the customer, and all the functional areas are committed to this objective through the involvement in the processes.
Increase overall Efficiency – Performance improvement is no longer only reflected by the automation levels of specific areas or sectors, but through processes that cross all functional areas, making the outcomes that each service must guarantee less abstract. Due to greater clarity of the outcomes obtained, there is an increase in the overall efficiency of the organization;
Increase Competitiveness – Acting on competitive strategies that are considered relevant, such as costs, quality, flexibility and all the activities that add value to the product or service.
Costs Reduction – Activities that do not generate valuable results in the framework of a lean process should be extinguished or considered secondary. The chain of activities has a tendency to narrow by nullifying information-generating intermediary activities that previously only ensured the transition of results. The objectives of each functional area are determined by the customer or product requirements and the outcomes from the processes are required to add value, thus eradicating secondary activities and reducing the costs.
Increase of the Communication and Information Sharing – With process management the organization has its information align and consequently there is a
8 dynamically exchange of communication between all the functional areas, assuring that this information is accessible and comprehensible for downstream operations.
Continuous Improvement Enhancing – An organization with process management has the possibility of aligning what actually is done in the company through a more intuitive way, which facilitates its comprehension and adhesion by all workers. Then again, working with various processes brings objective and visible results to the company which makes it possible to solve problems and create alternatives.
As a final point, Process Management modifies the structure of the company placing processes in the centre of the organization and aligns the organization’s objectives. There are several essential elements that relate to Process Management that must be identified and considered. In general they are current processes, strategy, critical success factors, project team and control that are all linked as essential elements (Louzada & Duarte, 2013).
2.1
Continuous Improvement Process (CIP) Approaches
To achieve customers’ requirements and strategy goals, for instance higher quality products, production flexibility and shorter delivery times, companies rely on Continuous Improvement Process (CIP).
CIP purpose is to optimize information, physical flows and products in order to control cost and quality, in order to improve companies’ performance. This is accomplished with the involvement of all stakeholders, form suppliers to team managers and factory workers.
“Continuous Improvement is a systematic process of continuous and incremental improvements, supported in various tools previously established” (Mora, 2014, p. 121).
With the objective of being more and more competitive companies are always targeting reduced costs. Poor quality, downtime, low efficiency, scrap, overtime are also called Wastes, and the Continuous Improvement Process is focused on eliminating them.
CIP includes a number of principals, practices, techniques, and tools that have proven effective in fostering change for continuous improvement. The potential benefits of employing CIP are extremely vast, but require a long-term commitment, deliberate and thorough planning, coordination and cooperation (Mansir & Schacht, 1989).
As stated before, there are several approaches and techniques that support CIP individually or integrated, but for the purpose of this work the following ones will be depicted in the next chapters:
1. Total Quality Management (TQM); 2. Six Sigma;
3. Lean Thinking;
9 5. Theory of Constraints.
2.1.1
Total Quality Management (TQM)
Quality has been an important issue for organizations for many years. The early focus on quality evolved from inspection to quality control and later to quality assurance (Dale, 1999).
Quality management evolved through different stages in the last several decades such as inspection, control, assurance and TQM (Basu, 2004).
Total Quality Management (TQM) can be defined as a continuously evolving management system consisting of values, methodologies and tools, the aim of which is to increase external and internal customer satisfaction with a reduce amount of resources (Hellsten & Klefsjö, 2000).
TQM has been a dominant management concept for continuous improvement utilising Deming’s basic concepts of PDCA. TQM can be define as a quality management system or a corporate culture continuously evolving and consisting of values and tools focusing on customer satisfaction and the use of fewer resources (Salah, Carretero & Rahim, 2009).
TQM is regarded as an integration of various processes characterizing the behavioural dynamics of an organization. For this, an organization is referred to as a total system, where all activities carried out are geared towards meeting the requirements of customers with efficiency and effectiveness (Lakhe & Mohanty, 1994)
The TQM approach differs from traditional management in the following ways (Lakhe & Mohanty, 1994):
TQM focuses on customers absolutely. The firm customer focus brings competitive edge to the organization;
“Products conquer markets” is the basic edifice of TQM;
TQM takes the view that profits follow quality, not the other way around; TQM views total quality as having multi-dimensional attributes;
TQM creates goal-directed connections between customers, managers and workers. Everyone is motivated to contribute towards quality. TQM empowers each and every employee, regardless of the level, to find better ways to work. Traditional management, in contrast , is monolithic: workers work and managers manage the workers;
TQM is process-oriented, as against the traditional result-oriented approach;
TQM favours a long span of control, with authority pushed down almost to the lowest level, as against short spans and many layers of authority in the traditional management cultures. Accountability for quality is embedded at every level;
TQM requires a multi-skilled workforce with job rotation, in contrast to division of labour. There are seven quality tools frequently mentioned in the TQM literature. The seven quality tools are depicted as follows (Salah, Carretero & Rahim, 2009):
10 1. Control charts;
2. Histograms; 3. Check sheets; 4. Scatter plots;
5. Cause and effect diagrams; 6. Flowcharts;
7. Pareto charts.
TQM is viewed as a philosophy used by organization to drive Continuous Improvement Process (CIP) across its business activities (Short & Rahim, 1995).
2.1.2
Six Sigma
Six Sigma is a methodology for pursuing continuous improvement in customer satisfaction and profit. It is a management philosophy attempting to improve effectiveness and efficiency and it was created at Motorola, by Bill Smith, at 1986.
Six Sigma aims to eliminate waste and inefficiency, thereby increasing customer satisfaction by delivering what the customer is expecting. This methodology strive for improving processes, lower defect levels, reduce process variability, reduce costs, and increase customer satisfaction and increase profits, as TQM.
The central idea behind Six Sigma is that if it is possible for a company to know how many defects it has in its process, the company can systematically figure out how to eliminate them and get as close to “zero defects” as possible and specifically it means a failure rate of 3,4 parts per million, or 99,9997% perfect (Gupta, 2015).
The immediate goal of Six Sigma defect reduction and by consequence this leads to yield improvement, and higher yields greatly improve customer satisfaction.
Six Sigma defect reduction is intended to lead to cost reduction. It has a process focus and aims to highlight projects improvement opportunities through systematic measurement, usually supported by Sigma Projects implementations (Raisinghani, Ette, Pierce, Cannon & Daripaly, 2005).
Six Sigma represents a new wave of the quality management evolution towards operational excellence. The definition of TQM is different from that of the Six Sigma but it has a similar aim. Six Sigma has additional data analysis tools and more financial focus than what is found in TQM. TQM has a comprehensive approach that involves and commits everyone in a company while Six Sigma has a project management approach that is associated with a team (Salah, Carretero & Rahim, 2009).
Six Sigma and TQM show many similarities, however the package of quality tools, the attention to financial result, the sustaining of the gains, and the focus of the problem solving methods of
11 projects are new approaches in Six Sigma, compared to other concepts in quality management (Andersson, Enriksson & Tortensson, 2006).
“TQM can be the holistic and comprehensive umbrella that reaches to all stakeholders and Six Sigma can be the extension that provides a strong structure for achieving process improvements” (Salah, Carretero & Rahim, 2009, p. 245).
2.1.3
Theory of Constraints (TOC)
Nowadays, companies struggle to survive in a global market, with global competitors. In order to gain advantage among their peers it is important that the company finds the best suitable philosophy that can accomplish their strategy.
Companies, whether in production or service areas, should be more focused on understanding their own structure in terms of the processes. Having that in mind Theory of Constraints (TOC), first pull forth by Eliyahu M. Goldratt in 1984, becomes an important methodology. This methodology is focused on the weakest link in the chain to improve the performance of the systems. According to Tenera (2006), four key dimensions can be identified for structuring TOC as a management philosophy. This is shown in Figure 2.3.
Figure 2.3 - TOC Schematic Summary (Source: Tenera & Abreu, p. 169)
As identified on the Figure 2.3 the TOC thinking process (TP) is becoming an important problem solving approach which is changing the way of thinking of managers (Simsit, Gunayn & Vayvay, 2014). In the context of the Thinking Process, Kendall (1998) highlights three pillars for thinking process success, namely:
1. Policies;
2. Performance Measures; 3. Training.
12 A constraint is defined as anything that can impose a limit to a system so that it can’t achieve higher performance verses its goal. It is a process step that limits throughput.
The Theory of Constraints states that every system must have at least one constraint that limits the output of the process, by doing this it enables people to invent simple solutions to high complexity problems.
Goldrrat (1984) suggests two pre-steps before the Five Steps described in Table 2.1: 1. Definition of the system Goal;
2. Proper, global and simple Measures of performance;
After the Goal is identified it is important to identify which measurement will be used to judge progress. The measurement are, in terms of money are:
Throughput - T. The rate which the system generates incomes through: 𝑇 = 𝑆𝑎𝑙𝑒𝑠 − 𝑅𝑎𝑤 𝑀𝑎𝑡𝑒𝑟𝑖𝑎𝑙𝑠 − 𝑃𝑢𝑟𝑐ℎ𝑎𝑠𝑒𝑑 𝑃𝑎𝑟𝑡𝑠
Inventory - I. All the money the system has invested in purchasing materials with the intend to sell (i.e., raw materials, finished goods);
Operating Expense - OE. All the money the system needs to spend in order to turn inventory into throughput (i.e., employee time, machine depreciation, scrap material, operating and maintenance expenses)
There are Five Steps in the Process On-going Improvement, called focusing steps for addressing system problems on a continuous improvement basis (Goldratt & Cox, 1984).
These steps are depicted in Table 2.1.
Table 2.1 - Goldratt's Five Steps (Adapted from Mabin, 1999)
Steps Description of the Steps
1 - Identify the Constraint
Identify the operation that is limiting the productivity of the system. This may be a physical or policy constraint.
2 - Exploit the Constraint
Focus on how to get more production within the existing capacity limitations. Achieve the best possible output from the constraint. Remove limitations that constrain the flow, and reduce non-productive time so that the constraint is used in the most efficient way possible.
3 - Subordinate other activities to the constraint
Link the output of other operations to suit the constraint. Smooth workflow and avoid build-up of WIP inventory. Avoid making the constraint wait for work form other machines or processes.
4 - Elevate the constraint
In situations where the system constraint still does not have sufficient output, invest in new equipment or increase staff numbers to increase output.
13 5 - If anything
has changed, go back to step one
Assess to see if another operation or policy has become the system constraint. If the constraint has changed then go back to step one.
TOC provides approaches to operation decisions that avoid pitfalls of local optimization by reaching across functional boundaries in organizations (Gupta & Boyd, 2008).
In the context of Theory of constraints, the existence of four pillars has recently been discussed, namely2:
1. Inherent simplicity – Reliability Simple and Harmonious;
2. Every conflict can be removed – Don’t accept conflict as given; 3. People are good – Win-Win is always possible;
4. Never say I know – The bigger the base the bigger the jump.
2.1.4
Lean Thinking
In the aftermath of World War II, Toyota faced a really daunting challenge as they had many problems related with the fact that Japan was a small and fragmented market, had worn-out workforce, scarce of natural resources and little capital. To change their fate Toyota’s leaders had to come with a revolutionary paradigm of manufacturing excellence.
The result was the Toyota Production System (TPS). TPS is a consistent way of thinking and management philosophy that focus on (Liker, 2004):
Total customer satisfaction;
An environment of teamwork and improvement; A never-ending search for a better way;
Quality built in process;
Organized, disciplined Workplace;
Lean Thinking is based on the Toyota Lean model, which combines operational excellence with value-based strategies to produce steady growth through a wide range of economic conditions (Womack & Jones, 1996).
The central philosophy behind Lean Manufacturing is to provide superior quality products for more customers, at a significantly lower price, and to contribute to a more prosperous society. Lean is a philosophy, or way of thinking, with commitment to achieve a totally waste-free operation that is focused on customer success. It is achieved by simplifying and continuously improving all
2Source:
14 processes and relationships in an environment of trust, respect and full employee involvement. It is all about people, simplicity, flow visibility, partnerships and true value as perceived by the customer.
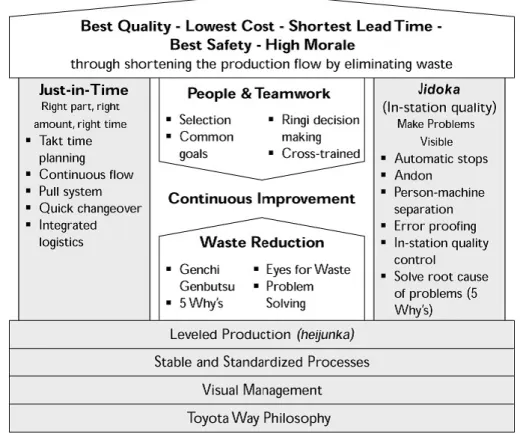
Toyota created a structured system, a house, so it could be possible to see the fundamentals of the TPS. This is shown in Figure 2.4:
Figure 2.4 - The Toyota Production System House (Source: Liker, 2004, p. 33)
There are five Lean fundamental principles (Womack & Jones, 1996):
1. Value Specification. Value is defined by customer in terms of specific products and services;
2. Value Stream Identification. Map out all end-to-end linked actions, processes and functions necessary for transforming inputs into outputs to identify and eliminate waste; 3. Continuously Value Flow. Having eliminated waste, make remaining value-creating
steps flow;
4. Pull System. Customer’s pull cascades all the way back to the lowest level supplier, enabling Just-in-Time (JIT) production;
5. Pursue Perfection. Pursue continuous process of improvement striving for perfection. Value Added Activity is any activity, or action, that transforms or shapes raw material or information into a capability for the ultimate customer requirements at the right time and with the right quality (Nightingale, 2005).
15 Non-Value Added Activity is any activity that takes time, resources, or space but does not add value to the product, or service itself.
Waste is any activity that is time and money consuming but does not add value from the customer’s perspective.
There are eight types of non-value-adding activities or wastes (Liker, 2004):
1. Over production (without demand). Producing items from which there are no orders, which generates such wastes as overstaffing and storage and transportation costs because of excess inventory;
2. Waiting (for next step of production). Workers merely serving to watch an automated machine or having to stand around waiting for the next processing step, tool, supply, part or just plain having no work because of stock outs, lots of processing delays, equipment downtime, and capacity bottlenecks;
3. Unnecessary transportation (un-required movement of products). Carrying work in process (WIP) long distances, creating inefficient transport, or moving materials, parts, or finished goods into or out of storage or between processes;
4. Over Processing (creates extra activity as result of poor design). Taking unneeded steps to process the parts. Inefficiently processing due to poor tool and product design, causing unnecessary motion and producing defects. Waste is generated when providing higher-quality products than is necessary;
5. Excess of Inventory (components, WIP, finished product not being processed). Excess of raw material, WIP, or finished goods causing longer lead times, obsolescence, damaged goods, transportation and storage costs, and delay. Also, extra inventory hides problems such as production imbalances, late deliveries from suppliers, defects, equipment downtime, and long setup times.
6. Unnecessary Movement (un-required movement of people/equipment). Any wasted motion employees have to perform during the course of their work, such as looking for, reaching for, or stacking parts or tools;
7. Rework/Defects (inspecting, repairing, redesigning). Production of defective parts or correction. Repair or rework, scrap, replacement production, and inspection mean wasteful handling, time, and effort;
8. Unused Employee Creativity. Losing time, ideas, skills, improvements, and learning opportunities by not engaging or listening to the company’s employees.
A Lean tool that is going to be utilized in this work is the Value Stream Mapping (VSM). VSM is a very important tool when implementing Lean as it is a visual representation of every process in the products or services path, form the moment an order is made to the moment the product, or service is delivered.
Value Stream Mapping is a very useful tool especially because (Rother & Shook, 1998): It helps to visualize interactions and flows;
16 It helps to identify wastes and their sources;
It provides common language for business talking and makes decision flows apparent; Shows the linkage between information and material flows;
Identifies the constraints of the process, any resource whose capacity is less than customer demand.
In the following chapter Total Productive Maintenance (TPM) will be depicted. TPM is mostly regarded as an integral part of Lean Manufacturing.
TPM as well as Lean requires employee’s involvement in all levels throughout the organization. Lean goals are not achievable without reliable machinery and processes, on the other hand, TPM is more effective in Lean driven enterprises (McCarthy & Rich, 2004).
2.1.5
Total Productive Maintenance (TPM)
Total Productive Maintenance (TPM) is defined as a company-wide, team-based effort to build quality into equipment and to improve productivity by reducing the time lost due to breakdowns. In 1971, Nippon Denson Co., Ltd., a supplier of Toyota Motor Company, first introduced and successfully implemented TPM in Japan, by Seiichi Nakajima, that brings maintenance into focus as a necessary and vitally important part of business (Venkatesh, 2007).
Total Productive Maintenance has been developed from the original Preventive Maintenance concept and methodology introduced in the USA. It has been further developed and implemented in many Japanese companies, and is now rapidly becoming a method applied worldwide. Total Productive Maintenance aims to increase productivity by reducing lost production time, increasing both available time for production and products quality, therefore increasing outputs from the process.
Also TPM seeks to maximize equipment effectiveness throughout the life of the machine. It strives to maintain the equipment in optimum condition in order to prevent breakdowns, speed losses, quality defects and accidents.
The Overall Equipment Effectiveness (OEE) is one of the key measures of TPM which indicates how efficiently the machinery and equipment is being run. OEE is a performance metric compiled from three data sources of the machine, or process, being measured. It compiles:
Availability. Compares the actual time that a piece of equipment is available to produce parts in comparison to the planned available time;
Performance. Compares the actual amount a product processed relative to the maximum amount that could be processed within the available production time.
Quality. The proportion of the product from a process that is right the first time, that mean with no rework, scrap or non-conformities with tolerances;
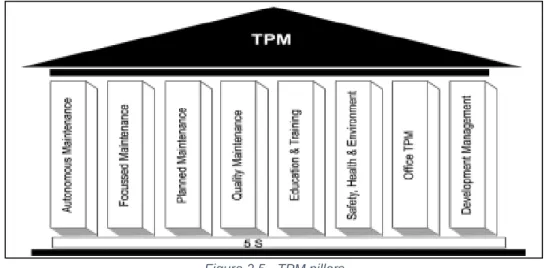
17 TPM is based on eight key highly important strategies, also referred to as pillars, which include improved planning of maintenance activities, measurement of machine performance, continuous improvement and enhancement of safety. This pillars are represented in Figure 2.5.
Figure 2.5 - TPM pillars (Source: Rahman & Hoque, 2014, p. 20)
The ultimate aim of each of the pillars is the elimination of all losses. The pillar approach is a way to manage change and a rigorous methodology to ensure that the company can sustain results to the future. The depiction of the pillars is shown in Table 2.2.
Table 2.2 - The 8 pillars of TPM (Adapted from Venkatesh, 2007).
Pillars Description
Autonomous Maintenance (AM)
It follows a structured approach to increase the skill levels of personnel so that it is possible to understand, manage and improve their equipment and processes.
Focussed Maintenance or Improvement (FI)
It provides a structured, team-based approach to drive elimination of specifically identified losses.
Planned Maintenance (PM)
Objective of achieving zero breakdowns. It follows an approach to establish management system that extends the equipment reliability at optimum cost.
Quality Maintenance (QM)
Zero defect conditions. It aims to prevent defects from being produced, rather than installing inspections systems that detect the defects after the manufacturing process.
Education & Training (ET)
It ensures that the workers are trained in the skills identified as essential, both for their personal development and successful deployment of TPM.
18 Safety, Health &
Environment (SHE)
Zero Accidents. It aims to eliminate the problem root causes, prevent reoccurrence, and reduce the risk of potential incidents, targeting near misses and potential hazards
Office TPM It applies eliminating waste and losses to administrative and support functions departments.
Development Management or Early
Management (EM)
It aims to implement and develop new products and process with vertical ram up and minimised development lead times.
A variety of tools are often utilized through TPM programs based on these eight pillars. Some of the tools use by Total Productive Maintenance and Lean Thinking are 5S, Pareto’s Diagram, Statistical Process Control, Brainstorming, Ishikawa’s Diagram, 4M approach, One-Point-Lesson (OPL), Standard Operation Procedure (SOP).
Problems cannot clearly be see when the workplace is unorganized. Cleaning and organizing the workplace helps workers to uncover problems. Making problems visible is the first step for improvement. TPM starts with 5S tool that is often used during the plant cleaning activities and is a systematic method to organize, order, clean and standardize a workplace. 5S like other improvement techniques requires both employee’s involvement and management commitment. The features of 5S are depicted in Table 2.3.
Table 2.3 - 5S Depiction
5S Japanese
5S English
Translation Description
Seir Sort It means sorting and organizing the items from the workplace is crucial.
Seiton Set in order
(Organize)
It means that the items should be arranged in order and placed back after usage at the same place they were taken from.
Seiso Shine It means cleaning the workplace of all dirty particles (i.e. grease, oil, dirt, scrap). Also no loose wires or oil leakage.
Seiketsu Standardize
It means that workers must decide on standards for workplace organization and housekeeping. This is implemented in the whole company and randomly inspections are taken.
Shitsuke Sustain (Self
Discipline)
It means employees should be trained for accomplishing good workplace organization autonomously
19
2.2
Performance and Assessment Systems Indicators
When a strategy is being defined in a company, one of the most difficult tasks this organization as to face is the development of significant objectives and their associated KPIs (Key Performance Indicators). Without the implementation of a good methodology, creating company’s objectives and KPIs, an organization’s strategy will never be effectively executed.
The selection and monitoring of the KPIs has become an important part of company’s business as it is critical to the continuous improving strategy and increasing organization’s competitiveness. Key Performance Indicators (KPIs) help organizations understand how well they are performing in relation to their strategic goals and objectives. In a largest sense, a KPI provides the most important performance information that enables organizations or their stakeholders to understand whether the organization is on track or not (Marr, 2010).
KPI represents a set of measures focusing on those aspects of organizational performance that are the most critical for the current and future success of the organization.
David Parmenter (2007) states that there can be defined seven KPI characteristics: 1. Nonfinancial measures;
2. Measured frequently;
3. Acted on by the CEO and Senior Management Team (SMT);
4. Understanding of the measure and the corrective action required by all staff; 5. Ties responsibility to the individual or team;
6. Significant impact (e.g., affects most of the critical success factors [CSFs] and more than one BSC perspective);
7. Positive impact (e.g., affects all other performance measures in a positive way).
The Key Performance Indicator demonstrates how effectively a company is capable of achieving significant business objectives. Organizations use KPIs at multiple levels to evaluate their success at reaching targets. High-level KPIs may focus on the overall performance of the enterprise, while low-level KPIs may focus on processes in departments such as sales, marketing or a call centre.
A KPI is only as valuable as the action it inspires. Too often, organizations blindly adopt industry recognized KPIs and then wonder why that KPI doesn´t reflect their own business and fails to affect any positive change. One of the most important, but often overlooked, aspects of KPIs is that they are a form of communication. As such, they abide by the same rules and best-practices as any other form of communication. Therefore, succinct, clear and relevant information is much more likely to be absorbed and acted upon.
In terms of developing a strategy for formulating KPIs, a team should start with the basics and understand what its organizational objectives are, how to plan on achieving them and who can act on this information. This should be an interactive process that involves feedback from
20 analysts, department heads and managers. As this fact finding mission unfolds, the company will gain a better understanding of which business processes need to be measured with KPIs and with whom that information should be shared.
KPIs are only as valuable as someone can make them. KPIs require time, effort and employee buy-in to live up to their high expectations.
In simple terms KPI is a way of measuring how well a worker, as individual, or how well an entire companies or business units are performing. KPI is short for Key Performance Indicator. A KPI should help to understand how well a company, business unit or individual is performing compared to their strategic goals and objectives.
Together, these metrics (or KPIs) allow the team in charge to understand whether they are on track or deviating from the course route. This enables them to make decisions about where to steer next, selecting new objectives and addressing new goals.
The wrong KPIs bring the danger of pointing people into the wrong direction and even encouraging them to deliver the wrong things. So it’s of major importance to select the correct KPIs which vary from case to case depending on the company’s business. Managers have to have in mind the different requirements given by their stakeholders, when they are choosing the adequate KPIs for the company’s areas (Parmenter, 2007).
Effective KPIs are closely tied to strategic objectives (be it for the entire company, a business unit, or an individual). Firstly, companies have to develop a performance management framework that articulates the strategic priorities. Then normally they create a single-page diagram of the key objectives and how they can support each other to deliver the ultimate goal (e.g. deliver value to shareholders).
Key Performance Indicators (KPIs) should be the vital navigation instruments used by managers and leaders to understand whether they are on course to success or not. The right set of KPIs will shine light on performance and highlight areas that need attention.
The problem is that most companies collect and report a vast amount of everything that is easy to measure and as a consequence their mangers end up drowning in data while thirsting for insights, this can cause a lot of lost time and money.
KPIs are important not only for performance measurement, but also for mapping organizational development. Best practice organizations clearly understand what is needed for their development. They separate external reporting indicators if they are not relevant for the measures that must be adopted internally, in order to avoid confusion and data overload. They create the proper culture for driving high performance (Popa, 2015).
In order to identify the right KPIs for any business it is important to be clear about the objectives and strategic directions.
21 The business world is saturated with KPIs. The corporate rivers are overflowing with them drenching everything in numbers and targets. KPIs stands for Key Performance Indictors and most companies and government organization are either drowning in metrics or are using them so badly that they are leading to unintended behaviours (Parmenter, 2007).
The selected KPIs should have the capability to measure and assist the current situation of the process (Sharifi, Ayat, Ibrahim & Sahibuddin, 2009).
There are three levels of metrics:
1. Key Management Indicators (KMI). KMIs are Lagging Indicators that are tracked at a senior management level;
2. Key Performance Indicators (KPI). KPIs are Leading Indicators which result in the success or failure of the KMIs. This are followed at the department level;
3. Key Activity Indicators (KAI). KAIs are given to operational levels. When KAIs succeeds, they affect positively the Key Performance Indicators.
These levels are shown in the following Figure 2.6.
Figure 2.6 - Hierarchy of Performance Indicators
As a conclusion it is possible to say the relationship between organizational culture and performance management is very close. Measuring for discovering and improving is the most natural form of using KPIs, with a view to provide the managers and the employees with the information necessary for taking decision. In this context, KPIs are used inside the organization as support for managerial decisions and for learning and development (Popa, 2015).
KMI
Top factory results, e.g. factory efficiency
KPI
Key indicators with impact on a KMI, e.g. breakdowns
rate
KAI
Indicators of the activitie that have an impact on a KPI, e.g. breakdown analysis
22
2.3
Decision Tools for Business Modelling
This chapter focus on describing the Decision tools that are most adequate for the Chapter 3 of this work.
The field of decision analysis has had a crescent impact in the way organizations are making strategic decisions. Major advances in theory, modelling tools and computational techniques have turn decision analysis increasingly crucial in business decision making. This decision making tools helps the companies to accomplishing greater customer satisfaction by adding value to the products.
Decision analysis refers to the broad quantitative field, overlapping operations research and statistics that deals with modelling, optimizing and analysing decisions made by individuals, groups and organizations.
Since, the complexity of business environment makes the process of decision making difficult the decision maker cannot rely entirely upon the observation, experience or evaluation to make a decision. The field of statistics provides methods for collecting, presenting, analysing and interpreting data (Srivastava, Shenoy & Sharma, 1989).
The effectiveness of business modelling and the corresponding decision support tools is derived from the concept that the value of the collective knowledge is greater than the value of its constituted parts.
For the purpose of this work the Principal Component, the Cluster and the Discriminant Analysis will be considered also as decision tools since they are important for the selection of the aggregate components that will help the construction of the Proposed Model. Consequently this tools are going to be presented in the next sections:
Cluster Analysis;
Analytic Hierarchy Process (AHP); Discriminant Analysis;
Principal Component Analysis (PCA).
In section 2.3.5 the computational software’s for the previous analysis are going to be depicted, and compared, so one of them will be chosen for the Proposed Model Proposal.
2.3.1
Cluster Analysis
The objective of cluster analysis is to assign observations to groups so that, the observation within each group are similar to one another with respect to variables or attributes of interest, and the group themselves stand apart from one another. The objective is to divide the observations into homogeneous groups. Cluster Analysis is used also to group variables rather than observations,