1 A Work Project, presented as part of the requirements for the Award of a Master’s Degree in
International Finance (Double Degree) from the NOVA – School of Business and Economics
– and Fundação Getúlio Vargas – São Paulo School of Economics
THE DETERMINANTS OF CAPITAL STRUCTURE IN LATIN AMERICA:
NEW EVIDENCE USING FIRM AND COUNTRY VARIABLES
MATHEUS DA SILVA COELHO
22381 – C345434
A project carried out on the International Master in Finance Program, under the supervision
of:
Irem Demirci (NOVA)
Marcelo Fernandes (Fundação Getúlio Vargas)
2 THE DETERMINANTS OF CAPITAL STRUCTURE IN LATIN AMERICA:
NEW EVIDENCE USING FIRM AND COUNTRY VARIABLES
Abstract
The literature on capital structure determinants is extensive, so contributing to the field with
both new variables that authors generally haven’t thought about to a geography that is not
known as much as the United States and Europe seemed a good idea. The region has many
specificities, especially at the institutional and macroeconomy level. Results show that the
coefficients signs of Profitability and Tangibility are the same as the rest of the world, but we
a higher magnitude. An ambiguity before, inflation indeed negatively affects leverage. Also,
the more developed the financial environment, the higher the leverage.
3
I. Motivation
This study is about the determinants of capital structure in Latin America. In order to bring new
knowledge to the field, this will consist first by testing the previously published results, see if
they apply for this specific region and add later some variables in order to provide evidence of
other possible determinants that explain how firms on this region finance their activities, which
could benefit both academics and practitioners. According to a recent study from law firm
Baker McKenzie (2018), there are good prospects for the mergers and acquisitions market in
this region, and by better understanding the capital structure of these firms (and its discount
rate), a more realistic valuation could be reached. A higher emphasis will be given to the
institutional environment as it shapes the degree of economic development and growth of
countries, driving decisions taken by businesses.
The region is known to be a place of political and economic vulnerability. In order to see if
there are firm and country characteristics that reflect this context, companies from the six larger
economies (Brazil, Mexico, Argentina, Colombia, Chile and Peru) will be gathered.
The area is characterized by high inequality and corruption. Examples of economic issues
include currency volatility, trade uncertainty and lack of infrastructure. Argentina and Brazil
are members of the MERCOSUR, the main trade bloc in the region, with the other countries
being somehow partners as well. These economies strongly rely on sectors such as Agriculture,
Mining and Oil & Gas, being exposed to their commodity price fluctuations.
II. Theoretical Introduction
Capital structure is the combination of debt, equity or other hybrid securities which is used to
finance the daily run businesses. This topic has a long collection of studies that try to find out
4 Modigliani and Miller (1958) built the corner stone of capital structure by using plenty of
perfect and efficient market assumptions. Conclusions: (a) it is irrelevant to use debt or equity;
(b) the higher the leverage, the higher the return on equity (increased risk premium), even
though overall firm risk and discount rate keeps the same value. In Modigliani and Miller (1963)
the existence of taxes is now taken into consideration. As interest payments are tax deductible,
using debt leads to a higher firm value due to Tax Shield. Also, the Weighted Average Cost of
Capital decreases due to the effect of taxes. Fully financing the firm with debt would be the
optimal capital structure.
Some authors (ex: Kraus and Litzenberger (1973)), decided to go further and included
bankruptcy costs in the model as it should be accounted when calculating the value of the
levered firm. These costs include hiring lawyers, paying courts and selling assets, among others.
Agency costs must also be taken in consideration. The cash flows might not be strong enough
to pay interests plus principal. Managers decide to use debt until its marginal benefits equals its
marginal costs, reaching an optimal capital structure, as defended in the Static Trade-off
Theory. Symmetric information and efficient markets still hold here.
Later, Myers (1984) argues that although the Trade-off approach seems to be “moderate”, as it
does not show a solid R2. Also, there are transactions and issuing costs which make the constant
adaptation to a new optimum a hard task. He states that firms have priorities when it comes to
financing: first, internal funds, then debt issuance (cheaper, riskless and generates a tax shield)
while also demonstrating discipline in the generation of steady future cash flows, which remind
us the “Informational Role of Debt”, from Harris and Raviv (1990), and finally equity. The
Pecking Order Theory says that equity makes the managers share their ownership and signals
to the outside investor a low confidence toward the firm generating cash flows strong enough
5 Another important theory is the Management Entrenchment Theory, from Zwiebel (1996), in
which managers use leverage in order to empire-build (i.e. to have more control over the
decisions of the firm). This way, the capital structure does not have an optimum that is
shareholder oriented, but rather managerial oriented. By taking excess leverage, managers are
putting the company and shareholders under higher risk. Studies also point to a theory called
Market Timing, in which managers do not give that much importance to what type of financing
that is used, but when it must be done, according to their current valuation on the market. As
Baker and Wurgler (2002) says: “…capital structure is largely the cumulative outcome of past
attempts to time the equity market.”
III. Literature Review
To start with, Titman and Wessels (1988) differentiates itself from others as it uses short-term,
long-term and convertible debt measures, instead of aggregate ones. It introduces the topic by
criticizing the methodology of some researches, stating that some variables are chosen as
proxies in order to bring better statistical measurements to the studies, as well as saying that
some independent variables might be related to each other. Some interesting new variables were
included such as R&D and depreciation. Conclusions include: smaller firms prefer short-term
leverage, probably due to higher costs of raising long-term capital.
Another piece of research (Rajan and Zingales (1995)) begins by stating that, even after many
studies (mostly in the United States), there is a lack of evidence from an empirical point of view
about the relevance of capital structure. In this case, seeking evidence from other developed
markets is the main goal of this study. Differences in accounting, legal and institutional
practices must be taken into consideration to measure leverage and its determinants. The authors
give special relevance to taxes, bankruptcy codes, market for corporate control, role played by
6 different leverage measures from country to country, this current work will make a more
standard and simple approach. As a conclusion, the authors find that there is a similar pattern
of leverage across the G7 countries, and it is hard to compare the effects of institutional
variables between different countries. The author states that leverage increases with firm
specific factors such as size, taxes and tangibility, while it decreases with investment
opportunities and profitability.
The first relevant paper that looks at non-developed countries is Booth et al. (2001), which
looks across the globe in order to test if the firm and country-specific variables can be applied
everywhere. The authors state some difficulties when it comes to using the data and deciding a
methodology for the analysis, such as the not existence of proxies for important factors and
different number of observations for different variables. One of the results, similar to the others,
is that profitability has a negative impact on leverage, which might suggest that the Pecking
Order Theory is applied here, as there is plenty of agency and information asymmetries in these
countries. Also, the higher tangibility of assets is once again a factor that increases leverage.
But the main conclusion of the study is this: while firm specific factors are generally similar
across the world, country factors differ significantly.
The paper from Desai et al (2004) seems to be very specific and it gives some interesting
insights about capital structure. The authors tried to find out how overseas affiliates of
American firms finance themselves: internally (recurring to the parent company) or externally
(through the debt and equity markets in which they are inserted)? The main conclusion is that
“Multinational firms appear to employ internal capital markets opportunistically to overcome imperfections in external capital markets”. The study innovates in this field of knowledge by testing new variables such as Creditor Rights and Capital Market Depth. One of the difficulties
faced was the fact that it is hard to compare financial variables between countries that have
7 interest rates, creditor rights and political risk; negative relations include inflation, profitability
and capital market depth.
From all papers chosen, the one from De Jong et al. (2008) seems to be the closer to what will
be studied in this research. The article says that country-specific factors influence leverage
directly (capital market conditions) and indirectly (it affects firm-specific factors). The data
includes almost 12 thousand firms from 42 developing and developed countries over a
five-year period. The authors studied possible firm-specific factors such as size, asset tangibility,
profitability, firm risk and growth opportunities; for country-specific, it uses legal enforcement,
shareholder/creditor protection, market/bank-based financial system, stock/bond market
development and growth rate of the economy. Although their results follow the same pattern as
the known literature, they noticed that some factors have the opposite effect as expected and a
few factors differ from country to country. When it comes to country-specific factors, GDP
growth, bond market development and creditor right protection have high impact on capital
structure. This result work as a “role model” for advanced economies with strong level of legal development (United States and Europe), where firms are more likely to use debt financing. In
order to compute the leverage of each firm, the authors used a standard approach which consists
in (Book Value of LT Debt)/(Market Value of Total Assets). They suggest that ST Debt have
different determinants, leading to a very different end-result. It is mentioned that they used
dummies for industry groups in order to check for robustness. Regarding the methodology, the
authors run a regression for firm-specific factors and another for country-specific factors, as
well as regressions for the country dummies (direct impact) and for country effects on firm
factors (indirect impact).
To finish, Fan et al. (2012) focus on the institutional characteristics that influence capital
structure choice. The main finding is that the institutional environment has a greater influence
8 lead to a higher degree of leverage and shorter debt horizons. Another interesting insight is that
the author emphasizes the influence of the suppliers of capital (i.e. investors), which may be
related to the availability of government debt and level of deposits and savings. Economic
development is positively related to leverage, as already mentioned above.
IV. Data
The study will be based on two main type of variables: Country- and firm-specific data. As told
before, the countries of our study were chosen because they are the largest economies in the
region. The sample period is between 2000 and 2017, as data before that was scarce, while
trying to get the maximum amount of observations as possible. Also, yearly is the chosen
frequency, as it is easier to find for country data. Data for firm factors were taken from
Bloomberg. Firms chosen include the ones present in the countries’ main stock indexes (158 in
total). By mistake, there are 19 firms that are part of the S&P/BVL Peru General Index which
were not included in the list. By taking the largest firms, we are ignoring possible differences
in financing options between large and small firms. Financial institutions (banks and insurance
firms) had to be deleted, as their business model and balance sheet differ significantly from
firms in other industries. Rajan and Zingales (1995) also refer to the fact that these types of
institutions must follow capital requirements, which affect their capital structure choice.
Country variables were mostly taken from the World Bank, but also from other sources, which
will be referenced as the data is described. There are four kind of variables in this study: control
variables for firm specific factors, control variables for country specific factors, new variables
for firm specific factors and new variables for country specific factors. Also, we would like to
refer that all firm variables were “winsorized”. A percentile is chosen (in our case, 0.001), and
is applied symmetrically to the distribution. Everything that does not lie in between the
0.0005-0.9995 range, is considered an outlier, and the value of these outliers now assume the value of
9 the book leverages higher than one, while switching the values for the lost number of
observations possible. This percentile was applied to all other firm-specific variables for a
matter of consistency. An alternative technique would be to “trim” the observations, i.e. to delete the outliers, but the previously mentioned authors demonstrated that winsorization gives
us less biased results. Finally, one issue that is a big part of the study of De Jong et al. (2008)
is that different independent variables have indirect effects on each other, multicollinearity is
probably one issue on this work. Dependent variables can be seen in the Appendix (Table 1),
both at country and regional level. Descriptive Statistics on both Dependent and Independent
variables are on Table 2.
Dependent Variables
Before defining our measures of leverage, we must keep in mind that there might be differences
in accounting measures, what is and is not included in a specific entry (how depreciation is
taken into account, for example), even if now countries follow a more standardized and
international practice of accounting. We have no information whether the figures for
firm-specific variables are from consolidated balance sheets (in which a group of firms report all the
affiliates’ balance sheet in a single one) and we did not pay attention to firms from one country being part of the stock market in one country.
As we all know, book values reflect what accounting says, the historical value while market
values tell us the valuation given to by the financial market. The differences between one and
another might transmit what are the evolution of the firm and if it is doing better than what its
accounting values say. Therefore, leverage rations that base themselves on one or another
reflect what debt looks like compared to the accounting figures and how debt is doing in
10 There are two measures of leverage on this study: Book leverage, which is total debt over total
book value of assets. Although it is a measure widely used, De Jong et al. (2008) warn us that
short-debt includes trade credit, whose determinants might be different than for the rest of debt,
giving us distorted results. Market leverage, which is total debt over market value of assets
(market value of assets equals book assets less book equity plus market capitalization).
In Fan et al. (2012), long-term debt over assets is used to measure the “durability” of debt, and
to distinguish it from short-term debt. These two might be stronger or weaker according to
different factors and geographies. Besides those, total liabilities over total assets is also used,
but Rajan and Zingales (1995) clearly state that accounts payable and pension liabilities inflate
the value of leverage, without being part of the financing strategy of the firm.
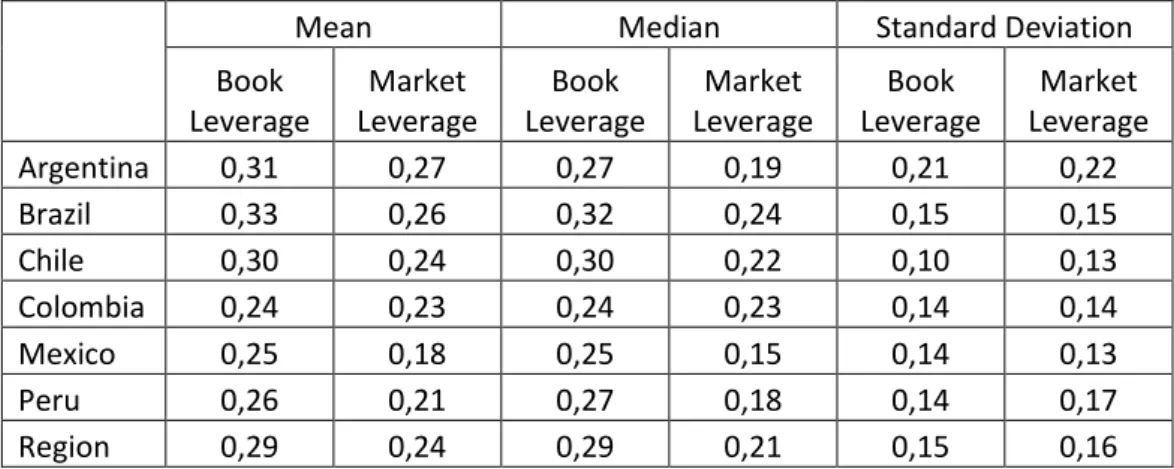
In Table 1 the reader* can see both book and market values of median leverage for the whole
region (our dependent variables) and for each country that are part of it. As shown, Brazil is the
country with the highest level of leverage, for both, while Colombia has the lowest book
leverage and Mexico has the lowest market leverage. The country with the largest difference
between book and market leverage is Mexico, as well. In De Jong et al. (2008), which measures
leverage levels by country, the values for market leverage are below ours, as they use
Long-term Debt only instead of Total Debt. Booth et al. (2001), which analyses Brazil and Mexico,
have higher values for total liabilities over assets and lower values for long term debt over
assets. Fan et al. (2012), which uses the same measure of market leverage as we do, have higher
values for Mexico, Brazil and Peru, and more or less the same for Chile; for long-term debt
over assets, values look even higher than in our case (using total debt). Mexico and Chile engage
more in long-term debt than Brazil and Chile. Rajan and Zingales (1995) use many forms of
leverage, including total debt over book assets, the same as one of our measures, and has
11 Independent Control Variables
For firm-specific variables, we have tangibility, measured as net fixed assets (or PPE - Property,
Plant and Equipment) over book value of assets; this factor is generally accepted as having a
positive impact on leverage, except for Booth et al. (2001); tangible assets serve as a collateral;
the higher the tangibility, the lower is the risk that the lender is exposed to; also, tangibility
could serve as an inverse proxy for bankruptcy costs. Profitability, which calculated as EBITDA
over assets, is accepted as a negative coefficient in all literature; this is in line with the Pecking
Order Theory: firms first use internal funds to finance themselves, an than look for debt and
equity; an opposite idea is that, if the firm has strong cash flows, wouldn’t it be better at making
interest payments (i.e. issuing more debt)? This could be a topic for further research; as a matter
of curiosity, De Jong et al. (2008) finds out that this coefficient is positive for Chilean firms.
The logarithm of sales gives us the proxy for firm size; intuitively, the larger the firm, the higher
its level of diversification, leading to lower probability of bankruptcy, impacting leverage in a
positive way; besides that, bigger firms are probably more transparent and have steadier
cashflows, leading to more debt; additionally, De Jong et al. (2008) says “in countries with
lower [law] enforcement, the role of firm size is a proxy for information asymmetry alleviation
is further enhanced.”. To finish this paragraph, market-to-book ratio, denoted as growth opportunities by some authors, is defined as market over book value of the firm; this way, we
can see the present perception and future expectations of the market about a certain firm; a
value higher than one signs overvaluation or potential growth; a negative coefficient is expect,
according to literature; once again, De Jong et al. (2008) tells us that if there is a perspective of
growth, shareholders do not want issue debt so that they can channel cashflows to themselves.
When it comes to country level variables, inflation, associated with uncertainty (GDP deflator)
is a key one, especially when two of chosen countries, Brazil and Mexico, have a track record
12 ambiguous result. As one of the main advantages of issuing debt is the tax shields that could be
generated, we use statutory (corporate) taxes as one of our variables; according to the theory,
we expect that higher taxed lead to higher leverage; some authors use the corporate tax rate,
while others use the effective tax rate from Miller (1977), which is a more accurate way to see
its real impact on leverage, as it takes into account personal taxes on capital and dividend gains.
Corruption, as an “illness” to society, certainly plays a role on leverage, as it increases uncertainty and make institutions less reliable; the expected coefficient is negative; we took this
variable from Transparency International, which issues a yearly report of its Corruption
Perception Index. Domestic savings measures the availability of funds from investors, so that
it could be invested in financial assets, as stated by Fan et al. (2012); the same author finds that
it is negative for developing countries. Market cap of listed companies shows us the degree of
the equity market, which negatively correlates with debt on Booth et al. (2001). GDP growth
could signal where we are in the business cycle (when equity issues increase), but also signals
good prospects for the economy and good cash flows, which could be used to make interest
payments; this is a positive contribution to leverage, according to the same author as before.
The last of this section, rule of law, should have a positive coefficient, as stronger law means
more transparency, less corruption and a working judicial system (important for bankruptcy
cases); this variable was taken from the World Governance Indicator, issued by the World Bank,
and rule of law is one of the variables available; as stated in the report: “Reflects perceptions of the extent to which agents have confidence in and abide by the rules of society, and in
particular the quality of contract enforcement, property rights, the police, and the courts, as well
as the likelihood of crime and violence.”; all the rational behind the variables is on Kaufmann
13 Independent (New) Variables
Now talking about new variables in order to test other eventual capital structure determinants,
first for firm: one of the variables of our choice is the dividend payout ratio; this variable is
inspired in the so called Dividend Signaling; it says that when a firm unexpectedly announces
a dividend increase (decrease), future expectations regarding profitability are increased
(decreased); although it is not 100% proved as theory (with many caveats), it is defended by
many authors according to Bernheim and Wantz (1992); we expect it be positive correlated to
leverage, as both dividend increase and leverage impose a stronger discipline on managers. We
thought of another variable called effective interest rate, which is essentially all the interest
payments divided by EBIT; this could show how much the spent in interest correlates with
leverage, as the interest on debt payments is just one of the spending components of our
variable; also, this explicits the true interest that the firm faces, and not the one established by
the central bank (which will show in the next paragraph). The last firm variable in the effective
tax rate (total tax spending over EBT), which once again seem to be a value for taxation closer
to the reality of the firm, and not the one stablished on a country level; a positive relation is
expected; De Jong et al. (2008) uses this measure instead of the standard one for Taxes, as gets
a negative coefficient; let us test this to see the real sign.
For possible country variables that could further explain leverage we chose central government
debt, as the working paper from Demirci et al. (2018) states that there is a negative relation
between this and leverage; as the government issues debt, investors might seek these securities
(as they are safer), and (big) firms may think about increase its amount of equity. Another
variable is Foreign Direct Investment (FDI), which we expect to have a positive coefficient;
FDI enhances growth on developing countries (Alfaro et al. (2004)), which could lead a safer
environment where issuing debt seems a good option. As suggested by Booth et al. (2001), the
14 (therefore, imposing an opposite effect on leverage), so we use the value of all stocks traded
over GDP as another variable. As a key macroeconomic indicator in any economy, the level of
interest rate established by the central bank (without inflation) sets the standard for the interest
on any financial activity (lending, borrowing, …), so we expect negative value here. Probably,
the most interesting variable of this paper is the one called “Financial Develop Index”; it was developed by the International Monetary Fund (Svirydzenka (2016)), it takes into account the
depth, access and efficiency of both the Financial Markets and Financial Institutions of a
country; as the reader might suspect, this might be positive correlated with leverage; as a
problem it must be certainly correlated to other variables that we wrote above (transaction on
the equity market, for example). It is known from International Trade classes that the surplus
in an economy increase with the level of openness, and that is why Trade (Exports plus Imports,
divided by GDP) is another variable of that might generate a positive coefficient; the literature
on this is extensive, with one example being David and Loewy (1998). The last country variable
to be mentioned is the “Government Effectiveness”, also part of the World Bank study “Worldwide Governance Indicators”; as it describes the variable “Reflects perceptions of the quality of public services, the quality of the civil service and the degree of its independence
from political pressures, the quality of policy formulation and implementation, and the
credibility of the government's commitment to such policies.”; once again, a positive correlation
is expected; this variable kind of translates the same as the one from the IMF, but orientated to
the public sector in general, instead of the financial institutions.
V. Methodology
As mentioned before, the first step towards treating the data was the winsorization of variables.
The correlation between all the variables are presented in the Appendix (Tables 3.1-3.6), as it
serves as a first step towards finding out whether our predictions are right. The next three
15 Regarding the control variables and book leverage, the ones that contradict the predictions
stated on the Data section of this paper are market-to-book, corruption and GDP growth. The
logarithm of sales (i.e. Size) and market capitalization of the listed companies are essentially
zero. Inflation, which was the ambiguous variable, exhibits a positive behavior towards book
leverage. All the others are according expectations. Now for control variables and market
leverage, market-to-book is now in line with expectations, and corruption, inflation and
economic growth keep the same signs as for book leverage. All else is remain the same.
Magnitudes now seem to be a bit “far away” from zero.
Let us analyze the new variables in comparison to book leverage. Effective tax rate is negative.
Central government debt, volume of stocks traded, and real interest rate are positive, going
against what was previously thought. Trade has a negative correlation with book leverage.
Government effectiveness is essentially zero. Everything else matches expectations. To finish,
for the new variables and market leverage, real interest rate is now negative, while all the rest
is similar to correlations with book leverage.
As a matter of curiosity, we can look at correlations between independent variables, especially
between firm and country variables, which might translate indirect effects of these variables on
leverage, being these one of the main contributions of De Jong et al. (2008). Unfortunately, the
correlations presented do not seem to be consistent with his work. For example, rule of law is
positive in relation to size (not expected), while corruption has a negative impact on profitability
(expected). These results could motivate academics to research it in a deeper and methodical
way.
The regression analysis of this paper heavily relies on two mentioned papers: Booth et al. (2001)
and Fan et al. (2012). First, all the regressions presented were clustered at the firm-level in order
16 order to obtain variables that are homoscedastic (i.e. do not have variation in errors) and do not
have serial correlation (i.e. error terms are not correlated over time), which could be considered
a way to get robust standard errors on a panel data model. This cluster was done through the
“White cross-sectional” option in “Coefficient covariance method” available on EViews. There are three methods of regressions used in this study: Pooled OLS, Period Fixed Effect,
and Period and Cross-Sectional Fixed Effect. These were used for four different group of
independent variables: Control Firm variables (1), Control Country variables (2), Control Firm
and Country variables (3), and Control and New with Firm and Country variables (4). As the
reader can perceive, the goal of the first three is to test the existing evidence for our aggregate
sample of Latin American firms according to the respective variables, and the last one is
intended to add new significant variables to the existing literature. All these were regressed
against two dependent variables already mentioned in the Data: Book Leverage and Market
Leverage. Twenty-four regressions in total.
Focusing on the regression methods. As a first step, Pooled OLS was used to estimate the
above-mentioned models, due to its “simplicity”. This is an OLS model adapted to panel data. Here, any specific effect either from firm or period level are ignored. There are two regression
intercepts for panel data models: one for cross sectional and one for period. In this first case,
both are fixed. As the data in unbalanced (missing observations), this method does not generate
the most “efficient or unbiased parameter estimates” (Booth et al. (2001)).
The second and third methods used to model the determinants of capital structure in Latin
America are the so-called Fixed Effect models. These allow to either one or both intercepts to
vary. In other words, we are “freezing” the effect of the Period, so that the changes in leverage are captured by the variation of the cross-sectional variables, independently of the time that we
Cross-17 Sections, promoting coefficients that translate the aggregate effects of the independent variables
on leverage, ignoring the individual characteristics of firms and time period chosen.
VI. Results
The tables can be found in the Appendix section. Significance at the 10% level will be
considered. The coefficients are on the right of the name of the variable, while the p-values for
the respective value is below the coefficient. Non-significant p-values in red color.
Pooled OLS Regressions (Table 4): For regressions (1), which uses Control variables at the
firm level, the best comparison might be with Ranjan and Zingales (1995), as they use the exact
same variables. Size is not significant for both Book Leverage and Market Leverage.
Tangibility and profitability follow the literature, with higher magnitudes in relation to Market
Leverage; Adjusted R² is way higher for Market Leverage (24%), which is also in line with the
mentioned paper. Market-to-book is more in line with the literature for market values of
leverage. For regressions (2), Taxes and Corruption are not significant, and GDP growth is not
significant for Market Leverage. Inflation contributes negatively to the models and Savings
show vigorous negative coefficients. Except for GDP growth, all the variables followed what
were expected. Adjusted R² here is lower than the one from Booth et al. (2001), which uses
only macroeconomic variables. For regressions (3), using Control variables for both Firm and
Country level, we do not reject the null for the same variables (Tax, Corruption and GDP growth
(market leverage case)). Size is now significant, following the literature. Market-to-book is
once again ambiguous. All the other variables are in line with expectations and the previous
two cases. Let us test the “big model” (4), the one with both Control and New variables at firm and country level. Many variables that were used as control are now not significant (Rule of
Law, GDP growth, Savings, Corruption and Inflation (Book case). Market-to-book is, for the
18 Inflation now has a positive effect. Regarding the new variables, Dividend payout ratio,
Effective Interest Rate and Volume of stocks traded have a negative coefficient. Effective Tax
Rate, Real Interest Rate and Financial Develop Index contribute positively to the both measures
of leverage. For Foreign Direct Investment, Central Government Debt, Trade and Government
Effectiveness the null is not rejected, making these not significant variables. Both Adjusted R²
demonstrate to be the highest of all the four models, even passing the ones from the literature.
Regressions with Year-Fixed Effect (Table 5): the ones in (1) look similar to the pooled case.
Regression with (2) variables have insignificant values for Taxes, Corruption (market level)
and Market Capitalization of Listed Companies (book level). Inflation and GDP growth have
negative coefficients, while all the others seem to be in line with expectations. Corruption has
a negative sign in the Book leverage regression. Regressions (3) have generally the same results
as the regressions (1) and (2). For the regressions of (4), all the Control firm values are
significant, and the only case that is not in line with expectations is, once again, the
market-to-book ratio. Taxes, GDP growth, rule of law and corruption are not significant. Inflation is
positive, similar to the pooled regressions. Central Government Debt and Trade are now
significant, with the first following the literature results (negative coefficient). Volume of
stocks traded in not significant now. Adjusted R² are slightly higher for this Year-Fixed Effect
case, with still a big difference between the cases with book and market leverage.
Regressions with Year- and Firm-Fixed Effects (Table 6): there are more non-rejected null
hypothesis. Regressions (1) reveal the same results as before, except for the non-significance
of market-to-book ratio in the book leverage model. For (2), corruption is now significant with
a negative sign, savings are also not significant; it is, in fact, the only significant variable of the
book leverage case. Regressions in (3) have the same results for corruption as in (2). The firm
and country variables have, respectively, the essentially the same output as the regressions of
19 Capitalization of firms is negative. Taxes, as in the pooled regressions, are significant and have
a negative coefficient. From all the new variables suggested, the only two significant are the
Financial Development Index and the Effective Interest Rate. Adjusted R² seem to be inflated
in this third round of regressions.
VII. Analysis of the Results
First, let us compare the control tests with the existing literature. Profitability and Tangibility
are always significant, in all cases, and coefficients are generally higher than the ones from Fan
et al. (2012). Size is also significant in most of times, but coefficients are very low, similar to
the previous paper. Market-to-book ratio is always positive for book leverage, and negative for
market-leverage (in line with the literature); this difference could be a target for future research.
Taxes are mostly non-significant; this may be due to the fact that it has the lowest number of
observations compared to the other variables. Inflation is always negative; its coefficient is in
line with the values for the developing economies in Fan et al. (2012), which in turn are higher
than for the developed economies. Corruption is generally not a significant value; when it is
(mostly the two effects), it is negative, which is the expected sign. Gross savings, when
significant, are negative, with the magnitude of the coefficients being enormously higher than
the one from the cited paper. Market capitalization of firms in relation over GDP follow the
predictions. The first case of a solid results that is against expectations is the one for GDP
growth, which has a negative sign (but the magnitudes are less than half), contradicting Booth
et al. (2012); is it because there is higher volatility in these countries, so managers expect a
recession in the near future, even if today the economy is thriving? Once again, this could be a
topic for further investigation. We based our predictions for the coefficient for the Rule of Law
used in De Jong et al. (2008) and, even though we use it as any other variable in our regressions
(but it is viewed by those authors as having an indirect impact on leverage) we reached a
20 Now turning the attention of the reader to the variables that can potentially influence leverage
in Latin America. When running regressions for type of variables (4), results seem strange.
Some Control variables that were significant are not now (and vice-versa), and even flipping
the sign for inflation, especially for the pooled OLS regressions. Dividend Payout Ratio are
significant, although they have a low magnitude; coefficient is negative, which contradicts our
intuition, and only next studies can find out the cause of this. Effective interest rates have zero
as p-value; but how much from that interest comes only from debt, and not from other sources
(trade credit, interest from installments of real estate)? This variable should had been studied
more carefully before being applied to the model, so that the coefficient could actually tell us
something new. The case for Effective Tax Rate is similar: how much of that debt comes from
debt, and not from taxes on products sold? As it has a positive sign, it would be in line with our
expectations for Statutory Corporate Taxes, or effective taxes (used in other papers); De Jong
et al. (2008) uses this measure for taxes, and his results are (mostly) not in line with ours and
from other literature. The Year-Fixed Effect regressions for variables (4) lead us to a significant
and negative coefficient for central government debt, confirming the study from Demirci et al.
(2016). FDI in never a significant explanatory variable. The volume of stocks traded over GDP
is only significant for pooled OLS case and is a negative contribution to leverage, as predicted
(when investors “seek” the equity market, the debt one is less relevant). Real Interest Rate has
a positive effect on leverage, and the reason is possibly because when the economy is doing
good, central bankers raise interest rates (and vice-versa), but borrowing becomes more
expensive as well, which is clearly a case of ambiguity. The Financial Development Index from
the IMF not just have significant coefficients in all regressions, but also considerable
magnitudes; as this variable gathers financial market financial institutions information, it could
alone be a proxy for many variables that are both control and new; so, as the financial
21 regressions trade is not significant, and on others it contributes negatively to debt; contrary to
the initial rationing, openness of the economy might lead to investors and firm to use more the
equity market. Government effectiveness does not generate results.
VIII. Conclusion
Although this region has a specific institutional and business environment compared to the rest
of the world and, especially, the developed world, the determinants of capital structure does not
vary abruptly. From the control variables used, either on the firm or country side (or both), the
results are similar. We found out that Tangibility, Profitability and Savings not only are in line
with previous studies at the sign level, but the magnitude of the coefficients are considerably
higher, being these a differential in relation to other geographies. We can say that inflation does
influence the leverage of Latin American firms in a positive way. Further research lies on
market-to-book ratio (ambiguity) and GDP growth (opposite sign).
New variables seem to arise as possible determinants of capital structure in the region. On the
macroeconomic level, real interest rates (even if ambiguous) and volume of traded stocks
(demand of equity from investors). On the institutional side, the Financial Development Index
produced by the IMF seems to be a good representative of many factors, and confirming the
prediction that financial development lead to higher leverage.
In order to have better results in the future, compared to this paper, the winsorization should be
made at the 1% level and multicollinearity must be analyzed, as it certainly influenced the
coefficients, overestimating them. Also, we could had found relevant effects of corporate taxes,
but the number of observations was lower than the other variables. Comparing the different
types of rejections made, the Year-Fixed Effects seems to be “better”, as it ignores the time
component that might be attached to the leverage levels and independent variables, while not
22 “inflated” R²), and it also gives higher R² compared to pooled OLS regressions. Besides that, the literature that we based this study on prefer Fixed Effects at one level only.
IX. References
Baker Mckenzie. 2018. “A Buyer’s Guide to M&A in Latin America”. Retrieved from
https://www.bakermckenzie.com/en/insight/publications/2018/01/latam-ma-guide
Modigliani, Franco, and Miller, Merton H. 1958. “The Cost of Capital, Corporation Finance
and the Theory of Investment.” The American Economic Review, Volume 48(3): 261-297.
Modigliani, Franco, and Miller, Merton H. 1963. “Corporate Income Taxes and the Cost of
Capital: A Correction.” The American Economic Review, Volume 53(3): 433-443.
Kraus, Alan, and Litzenberger, Robert H. 1973. “A State-Preference Model of Optimal
Financial Leverage.” The Journal of Finance, Volume 28(4): 911-922.
Myers, Stewart C. 1984. “The Capital Structure Puzzle.” The Journal of Finance, Volume
39(3): 574-592.
Harris, Milton, and Raviv, Artur. 1990. “Capital Structure and the Informational Role of
Debt.” The Journal of Finance, Volume 45(2): 321-349.
Zwiebel, Jeffrey. 1996. “Dynamic Capital Structure under Managerial Entrenchment.” The
American Economic Review, Volume 86(5): 1197-1215.
Baker, Malcolm, and Wurgler, Jeffrey. 2002. “Market Timing and Capital Structure.” The
Journal of Finance, Volume 57(1): 1-32.
Titman, Sheridan, and Wessels, Roberto. 1988. “The Determinants of Capital Structure
23 Rajan, Raghuram G., and Zingales, Luigi. 1995. “What Do We Know about Capital
Structure? Some Evidence from International Data.” The Journal of Finance, Volume 50(5):
1421-1460.
Booth, Laurence, Aivazian, Varouj, Demirguc-Kunt, Asli, and Maksimovic, Vojislav. 2002.
“Capital Structure in Developing Countries.” The Journal of Finance, Volume 56(1): 87-130. Desai, Mihir A., Foley, C. Fritz, and Hines Jr., James R. 2005. “A Multinational Perspective
on Capital Structure Choice and Internal Capital Markets.” The Journal of Finance, Volume
59(6): 2451-2487.
De Jong, Abe, Kabir, Rezaul, and Nguyen, Thuy Thu. 2008. “Capital structure around the
world: The roles of firm- and country-specific determinants.” Journal of Banking & Finance,
Volume 32(9): 1954-1969.
Fan, Joseph P. H., Titman, Sheridan, and Twite, Garry. 2012. “An International Comparison
of Capital Structure and Debt Maturity Choices.” The Journal of Financial and Quantitative
Analysis, Volume 47(1): 23-56.
Miller, Merton H. 1977. “Debt and Taxes.” The Journal of Finance, Volume 32(2): 261-275.
Bernheim, B. Douglas, and Wantz, Adam. 1992. “A Tax-Based Test of the Dividend
Signaling Hypothesis.” NBER Working Paper No. 4244.
Demirci, Irem, Huang, Jennifer, and Sialm, Clemens. 2016. “Government Debt and Capital
Structure Decisions: International Evidence.” Centre for Economic Policy Research Working
Paper 5650.
Alfaro, Laura, Chanda, Areendam, Kalemli-Ozcan, Sebnem, and Sayek, Selin. 2004. “FDI
and economic growth: the role of local financial markets.” Journal of International
24 Ben-David, Dan, and Loewy, Michael B. 1998. “Free Trade, Growth, and Convergence.”
Journal of Economic Growth, Volume 3(2): 143-170.
Kaufmann, Daniel, Kraay Aart, and Mastruzzi, Massimo. 2010. “The Worldwide Governance
Indicators – Methodology and Analytical Issues.” The World Bank, Policy Research Working
Paper 5430.
Svirydzenka, Katsiaryna. 2016. “Introducing a New Broad-based Index of Financial
25
X. Appendix
Table 1 – Leverage by country
Mean Median Standard Deviation
Book Leverage Market Leverage Book Leverage Market Leverage Book Leverage Market Leverage Argentina 0,31 0,27 0,27 0,19 0,21 0,22 Brazil 0,33 0,26 0,32 0,24 0,15 0,15 Chile 0,30 0,24 0,30 0,22 0,10 0,13 Colombia 0,24 0,23 0,24 0,23 0,14 0,14 Mexico 0,25 0,18 0,25 0,15 0,14 0,13 Peru 0,26 0,21 0,27 0,18 0,14 0,17 Region 0,29 0,24 0,29 0,21 0,15 0,16
Table 2 – Descriptive Statistics
Mean Median Maximum Minimum Observations
Book Leverage 0,29 0,29 1,00 0,00 2381 Market Leverage 0,24 0,21 0,90 0,00 2217 Tangibility 0,41 0,41 0,94 0,00 2441 Profitability 0,14 0,13 1,06 -0,28 2414 Size 7,44 7,45 11,89 -0,09 2428 Market-to-book 2,51 1,73 50,04 -8,09 2265 Tax 0,30 0,33 0,40 0,17 1385 Inflation 0,07 0,06 0,40 -0,01 2844 Corruption 4,14 3,70 7,50 2,50 2844 Savings 0,19 0,18 0,25 0,12 2844 Market Caps 0,49 0,41 1,56 0,06 2769 GDP growth 0,03 0,03 0,10 -0,11 2844 Rule of Law -0,14 -0,36 1,43 -0,89 2686 Dividend 0,66 0,38 78,25 0,00 1814 Eff Interest 2,13 0,08 827,77 -0,03 2310 Eff Tax 0,56 0,28 136,46 0,00 2372 Gov Debt 0,43 0,38 1,52 0,04 2686 FDI 0,04 0,03 0,11 0,01 2844 Stocks Traded 0,14 0,10 0,46 0,00 2844 Real Interest 0,17 0,10 0,48 -0,11 2724
Fin Dev Index 0,42 0,41 0,61 0,20 2686
Trade 0,42 0,37 0,81 0,22 2844
26 Table 3.1 – Correlation Matrix
Correlation Matrix Book Leverage Market Leverage Tangibility Profit Size
Book Leverage 1,0000 Market Leverage 0,7572 1,0000 Tangibility 0,1262 0,2151 1,0000 Profit -0,1641 -0,3773 0,0429 1,0000 Size 0,0002 0,0270 0,0278 0,0193 1,0000 Market-to-book 0,0349 -0,3314 -0,1393 0,3277 -0,0086 Tax 0,0360 0,0175 -0,1958 0,0696 0,0582 Inflation 0,0322 0,0361 0,0645 -0,0057 -0,0668 Corruption 0,0362 0,0437 0,1278 -0,1522 0,0119 Gross Savings -0,1306 -0,2046 0,0997 0,0911 0,0061 Market Caps -0,0060 -0,1049 0,0267 -0,0974 0,0812 GDP growth -0,0883 -0,1420 0,0554 0,1246 -0,0875 Rule of Law 0,0574 0,0529 0,0928 -0,1658 0,0822 Dividend 0,0082 0,0287 0,0348 -0,0029 0,0146 Eff Interest -0,0712 -0,0466 -0,0836 0,0244 -0,0590 Eff Tax -0,0064 -0,0115 0,0476 -0,0429 -0,0397 Gov Debt 0,1869 0,1835 -0,1065 0,0362 -0,0182 FDI 0,0105 0,0174 0,0562 -0,0757 0,0686 Stocks Traded 0,0990 -0,0120 -0,2392 -0,0604 0,2814 Real Interest 0,1489 0,1472 -0,1517 0,0479 0,0443
Fin Develop Index 0,1450 0,0469 -0,2144 -0,1115 0,3457
Trade -0,1108 -0,1540 0,1593 0,0263 -0,0233
27 Table 3.2 – Correlation Matrix
Correlation Matrix Market-to-book Tax Inflation Corruption Gross Savings
Book Leverage Market Leverage Tangibility Profit Size Market-to-book 1,0000 Tax 0,1085 1,0000 Inflation 0,0548 0,3825 1,0000 Corruption -0,0730 -0,7661 -0,2170 1,0000 Gross Savings -0,0068 -0,6264 -0,2965 0,3053 1,0000 Market Caps 0,0511 -0,7047 -0,2879 0,7462 0,3825 GDP growth 0,0196 -0,1747 -0,1340 0,0606 0,3478 Rule of Law -0,0566 -0,7234 -0,2204 0,9632 0,2781 Dividend -0,0173 0,0463 0,0428 -0,0333 -0,0429 Eff Interest 0,0283 0,0136 -0,0139 -0,0249 0,0475 Eff Tax 0,0136 0,0557 0,1470 -0,0368 -0,0342 Gov Debt 0,0513 0,7997 0,3667 -0,4995 -0,5979 FDI -0,0721 -0,7254 -0,3500 0,7225 0,3367 Stocks Traded 0,1495 0,2765 -0,1013 0,0914 -0,2143 Real Interest 0,0572 0,4796 -0,1486 -0,1864 -0,6186 Fin Develop Index 0,1086 0,1316 -0,0685 0,2822 -0,0994
Trade -0,0461 -0,7292 -0,2961 0,4636 0,8290
28 Table 3.3 – Correlation Matrix
Correlation Matrix Market Caps GDP growth Rule of Law Dividend Eff Interest
Book Leverage Market Leverage Tangibility Profit Size Market-to-book Tax Inflation Corruption Gross Savings Market Caps 1,0000 GDP growth 0,2390 1,0000 Rule of Law 0,7767 0,0370 1,0000 Dividend -0,0498 -0,0337 -0,0408 1,0000 Eff Interest -0,0190 -0,0127 -0,0226 -0,0043 1,0000 Eff Tax -0,0693 -0,0204 -0,0477 0,1371 -0,0029 Gov Debt -0,3675 -0,1893 -0,4301 0,0398 -0,0095 FDI 0,5948 0,1812 0,7243 -0,0403 -0,0359 Stocks Traded 0,4192 -0,0470 0,2336 0,0003 0,0040 Real Interest -0,0640 -0,1275 -0,1514 0,0005 -0,0268 Fin Develop Index 0,4500 -0,1367 0,4403 -0,0087 0,0125
Trade 0,3639 0,1874 0,4181 -0,0500 0,0190
29 Table 3.4 – Correlation Matrix
Correlation Matrix Eff Tax Gov Debt FDI Stocks Traded
Book Leverage Market Leverage Tangibility Profit Size Market-to-book Tax Inflation Corruption Gross Savings Market Caps GDP growth Rule of Law Dividend Eff Interest Eff Tax 1,0000 Gov Debt -0,0004 1,0000 FDI -0,0462 -0,4817 1,0000 Stocks Traded -0,0563 0,3276 0,0749 1,0000 Real Interest -0,0664 0,6366 -0,1334 0,5363 Fin Develop Index -0,0519 0,2408 0,2370 0,8754
Trade -0,0313 -0,7484 0,4510 -0,3830
30 Table 3.5 – Correlation Matrix
Correlation Matrix Real Interest Fin Develop Index Trade Gov Eff
Book Leverage Market Leverage Tangibility Profit Size Market-to-book Tax Inflation Corruption Gross Savings Market Caps GDP growth Rule of Law Dividend Eff Interest Eff Tax Gov Debt FDI Stocks Traded Real Interest 1,0000
Fin Develop Index 0,4052 1,0000
Trade -0,6862 -0,2475 1,0000
31 Table 4 – Pooled OLS (coefficients on the right of variable, p-value below coefficient)
Book Leverage Market Leverage Book Leverage Market Leverage Book Leverage Market Leverage Book Leverage Market Leverage Tangibility 0,0960 0,1423 0,0997 0,0994 0,1341 0,1133 0,0000 0,0000 0,0000 0,0000 0,0000 0,0000 Profitability -0,3914 -0,6223 -0,3179 -0,6322 -0,4346 -0,6659 0,0000 0,0000 0,0000 0,0000 0,0000 0,0000 Size 0,0030 0,0040 0,0074 0,0185 0,0051 0,0162 0,2003 0,3114 0,0000 0,0000 0,0095 0,0000 Market-to-book 0,0056 -0,0102 0,0076 -0,0050 0,0184 -0,0032 0,0000 0,0001 0,0000 0,0035 0,0000 0,0214 Tax 0,0819 -0,2172 0,1955 -0,0297 -0,4792 -0,4784 0,7034 0,3700 0,3638 0,9057 0,0107 0,0281 Inflation -0,2823 -0,3759 -0,3610 -0,3255 0,0857 0,2115 0,0001 0,0001 0,0000 0,0000 0,1915 0,0038 Corruption -0,0133 -0,0110 -0,0106 0,0001 -0,0035 -0,0052 0,1842 0,3652 0,2726 0,9924 0,7538 0,6975 Savings -0,7166 -1,0416 -0,5800 -0,7661 -0,2036 -0,0032 0,0009 0,0001 0,0149 0,0030 0,3521 0,9873 Market Caps -0,0682 -0,1600 -0,0878 -0,1509 -0,0773 -0,1117 0,0047 0,0000 0,0033 0,0000 0,0122 0,0026 GDP Growth -0,2894 -0,1899 -0,2536 -0,0760 -0,0496 0,0574 0,0298 0,1174 0,0806 0,4883 0,6702 0,6358 Rule of Law 0,0780 0,0975 0,0765 0,0617 -0,0007 0,0300 0,0002 0,0002 0,0001 0,0085 0,9754 0,3444 Dividend -0,0032 -0,0028 0,0189 0,0265 Eff Interest -0,5461 -0,3614 0,0000 0,0000 Eff Tax 0,0350 0,0343 0,0051 0,0019 Gov Debt 0,0211 -0,0765 0,8059 0,3700 FDI -0,1253 -0,3648 0,3131 0,1138 Stocks Traded -0,2676 -0,3726 0,0074 0,0000 Real Interest 0,2196 0,3525 0,0001 0,0000
Fin Dev Index 0,5708 0,5696
0,0000 0,0000 Trade 0,0517 0,0076 0,1753 0,8348 Gov Eff -0,0003 -0,0229 0,9920 0,4236 Adjusted R2 0,0591 0,2399 0,0544 0,1071 0,1220 0,3489 0,1429 0,4267 Observations 2184 2184 1360 1314 1297 1297 856 856 (1) (2) (3) (4)
32 Table 5 – Year-Fixed Effects (coefficients on the right of variable, p-value below coefficient)
Book Leverage Market Leverage Book Leverage Market Leverage Book Leverage Market Leverage Book Leverage Market Leverage Tangibility 0,0954 0,1240 0,1043 0,0994 0,1398 0,1171 0,0000 0,0000 0,0000 0,0000 0,0000 0,0000 Profitability -0,3875 -0,6537 -0,3128 -0,6322 -0,4231 -0,6699 0,0000 0,0000 0,0000 0,0000 0,0000 0,0000 Size 0,0036 0,0085 0,0069 0,0185 0,0053 0,0165 0,1215 0,0079 0,0000 0,0000 0,0058 0,0000 Market-to-book 0,0064 -0,0078 0,0074 -0,0050 0,0182 -0,0031 0,0001 0,0001 0,0000 0,0035 0,0000 0,0298 Tax 0,2456 -0,2125 0,3181 -0,0297 -0,3097 -0,2322 0,3504 0,5075 0,2560 0,9057 0,1403 0,3378 Inflation -0,2107 -0,3696 -0,3029 -0,3255 0,1747 0,2314 0,0001 0,0001 0,0000 0,0000 0,0309 0,0025 Corruption -0,0246 -0,0080 -0,0202 0,0001 -0,0102 -0,0017 0,0589 0,6624 0,1432 0,9924 0,4262 0,8815 Savings -0,4621 -1,0487 -0,4055 -0,7661 0,3307 0,5542 0,0774 0,0010 0,1653 0,0030 0,1256 0,0280 Market Caps 0,0036 -0,1039 -0,0029 -0,1509 -0,0569 -0,0857 0,8353 0,0120 0,8817 0,0000 0,0478 0,0064 GDP Growth -0,3883 -0,4820 -0,4846 -0,0760 -0,0758 0,0493 0,0037 0,0126 0,0022 0,4883 0,4371 0,6522 Rule of Law 0,0816 0,0707 0,0699 0,0617 -0,0130 0,0022 0,0014 0,0542 0,0091 0,0085 0,6391 0,9195 Dividend -0,0033 -0,0029 0,0183 0,0249 Eff Interest -0,5363 -0,3519 0,0000 0,0000 Eff Tax 0,0336 0,0326 0,0093 0,0040 Gov Debt -0,1597 -0,2134 0,0745 0,0256 FDI 0,0493 -0,1052 0,8362 0,7148 Stocks Traded -0,0588 -0,1601 0,5313 0,1025 Real Interest 0,2463 0,3107 0,0000 0,0000
Fin Dev Index 0,4668 0,4581
0,0002 0,0031 Trade -0,0887 -0,1472 0,0313 0,0007 Gov Eff 0,0098 -0,0123 0,7446 0,5763 Adjusted R2 0,073765 0,30043 0,0713 0,1087 0,1177 0,3433 0,2825 0,4286 Observations 2184 2184 1360 1314 1297 1297 856 856 (1) (2) (3) (4)
33 Table 6 - Year- and Firm-Fixed Effects (coefficients on the right of variable, p-value below
coefficient) Book Leverage Market Leverage Book Leverage Market Leverage Book Leverage Market Leverage Book Leverage Market Leverage Tangibility 0,0482 0,1301 0,0827 0,1132 0,1024 0,1594 0,0822 0,0010 0,0041 0,0019 0,0009 0,0019 Profitability -0,3768 -0,5343 -0,3506 -0,5005 -0,4121 -0,5618 0,0000 0,0000 0,0000 0,0000 0,0000 0,0000 Size 0,0361 0,0326 0,0302 0,0172 0,0520 0,0237 0,0000 0,0000 0,0000 0,0032 0,0000 0,0395 Market-to-book 0,0017 -0,0088 0,0031 -0,0052 0,0090 -0,0079 0,1576 0,0000 0,0000 0,0005 0,0000 0,0000 Tax -0,2951 -0,3517 -0,2652 -0,2841 -0,3918 -0,4668 0,2034 0,1341 0,2071 0,1580 0,0015 0,0114 Inflation -0,0530 0,0256 -0,0881 0,1251 0,2456 0,2598 0,7995 0,7995 0,6492 0,0529 0,0079 0,0010 Corruption -0,0347 -0,0438 -0,0297 -0,0311 -0,0070 -0,0168 0,0896 0,0000 0,0895 0,0015 0,5572 0,2699 Savings 0,0405 0,1521 0,1249 0,0384 -0,1992 -0,0632 0,8883 0,5251 0,6959 0,8680 0,2764 0,7152 Market Caps -0,0359 -0,1558 -0,0312 -0,1382 -0,0057 -0,0843 0,2430 0,0000 0,2833 0,0000 0,9010 0,0545 GDP Growth -0,1378 -0,4114 -0,1846 -0,3260 0,0246 -0,0162 0,3452 0,0000 0,1577 0,0000 0,8694 0,9004 Rule of Law 0,0202 0,0309 -0,0125 0,0434 0,0218 0,0512 0,5341 0,1181 0,7194 0,0000 0,5949 0,0513 Dividend -0,0006 -0,0006 0,4422 0,4676 Eff Interest -0,3394 -0,1488 0,0000 0,0162 Eff Tax -0,0014 0,0039 0,8631 0,6356 Gov Debt 0,0263 0,0493 0,7608 0,6707 FDI -0,2484 -0,1443 0,4036 0,5473 Stocks Traded -0,1346 -0,1288 0,2761 0,1944 Real Interest 0,1591 0,0923 0,1369 0,0483
Fin Dev Index 0,4838 0,3970
0,0003 0,0126 Trade -0,0030 -0,1000 0,9701 0,0658 Gov Eff -0,0450 -0,0514 0,1969 0,1446 Adjusted R2 0,5828 0,6620 0,7150 0,7429 0,7345 0,8012 0,8294 0,8215 Observations 2184 2184 1360 1314 1297 1297 856 856 (1) (2) (3) (4)