Laura Maria Tenreiro Tavares, 2316
A Work Project, presented as part of the requirements for the Award of a Masters Degree in Management from the NOVA – School of Business and Economics.
A Project carried out on the Strategy Directed Research Internship course, under the supervision of: Professor Guido Maretto and Dr. Pedro Neves
2016 (Submitted January 12, 2016)
Abstract
Companies seeking to continue growing and developing need to consider the possibility of international expansion and what that represents to their future. To tackle this challenge it becomes necessary to establish the company’s interests and priorities as well as defining and assessing the foreign market opportunities of a specific industry. This directed research internship proposes and conducts a simulation of the preliminary foreign market assessment and selection within the Juncker Plan: country filtering and ranking having as a frame of reference the second largest construction company in Brazil, Andrade Gutierrez.
Keywords: International market selection; Country ranking; Infrastructure; Andrade Gutierrez; Juncker Plan.
Introduction
The purpose of this chapter is to summarize the work developed during my three-month internship at Andrade Gutierrez Europa, Africa and Asia, in the Structured Business Department under the supervision of Dr. Pedro Neves and the contribution of Douglas Montagna, Luís Ferreira and Ricardo Oliveira.
During the internship we gave special importance to the Juncker Plan, which represents an opportunity for the development of Public-Private Partnerships, a stepping stone for the globalization and sustainable development; to Africa Infra Fund, a private equity fund dedicated to the investment in infrastructure in Africa which would serve the purpose of reducing the current “infra gap” of that continent; to the creation of the InfraBible, a private equity database containing worldwide funds with focus on infrastructure as well as a section with data analysis; to the delineation of Europe &
Africa Roadshow to discover potential partners in the construction of a road in the Democratic Republic of Congo and finally to Wales – United Kingdom, one of the targeted countries of Andrade Gutierrez (AG) in their strategic plan of action for Europe (Juncker Plan). The distribution of work throughout the internship can be seen in the calendar (Exhibit 1). Since the focus of the thesis is the Juncker Plan, in the following lines I will explain, in greater detail, my contribution to this project.
For a few months the Structured Business team had been developing a presentation about the business opportunity of the Juncker Plan to AG. To do it, the team created what is called the “Compass Strategy”, four vectors that follow the directions of a compass: N-S, S-N, E-W and W-E and that would be the method to organize, analyze and prioritize the information in order to then decide the company’s course of action. At the time they also created a fifth vector, with the purpose of insuring that the undertaken projects would be aligned with the Sustainable Development Goals of the United Nations for the next fifteen years. However, they dismissed this vector due to the complexity it would introduce when filtering the projects.
The first two vectors, N-S and S-N analyzed and identified the priority projects of each sector and their relevance to Europe (Juncker’s Vision) and organized and selected the projects that had potential to AG by applying a set of filters (Vision of the Market) respectively. The third, E-W considered the analysis of two important perspectives: from where did the capital come from and which were the main competitors AG will face when entering new markets. The fourth and last vector, W-E acted as the sum of all the information provided by the three vectors and intended to define the strategy of governance and the courses of action to the identified opportunities.
As it can be seen from the calendar, vectors S-N and E-W (capital analysis) were the ones in which I actively participated and contributed during the three-month period of internship. After a few days of collecting information about the plan and knowing the needs of the team regarding the project, the goal was to respond to the following questions:
1. Which are the main commercial banks, private equity companies and funds that would have interest in investing in such endeavour and which are their economic availability?
2. Which are the filters that could be applied to reduce the number of projects, obtaining the most advantageous and successful ones for AG and what would be the potential countries in which to invest?
To answer the first question I created a list of 500 commercial banks ranked according to its brand value, rating and domicile, analyzed and filtered them in order to obtain a list with the highest brand value banks in the different European countries. Afterwards I filtered a list of 300 private equity companies and ranked them according to domicile and amount fundraised. From this list I chose the most relevant ones with the purpose of identifying which funds these companies had, what were their characteristics and previous investments. Due to the purchase of a license that allowed AG to access Prequin’s Infrastructure Database, I was able to update this information analyze it therein.
As for the second question I worked with a set of filters previously created by the team to evaluate which projects had higher levels of attractiveness. To measure that, the sum of three categories provided the level of attractiveness:
• Geography – evaluated which countries received support of the European Cohesion Fund and organized the information according to the levels of funding (level 1 – lower; level 4 – higher):
o Level 1: Luxembourg, Netherlands, Sweden, Denmark, Austria, Germany and Belgium.
o Level 2: Finland, UK, France, Ireland, Italy, Spain and Cyprus.
o Level 3: Greece, Slovenia, Czech Republic, Portugal, Malta, Slovakia and Estonia.
o Level 4: Bulgaria, Croatia, Latvia, Romania, Lithuania, Poland and Hungary.
• Investment Level – organized the projects according to its level of investment: o Level NA: investment of the project not available.
o Level 0: investment lower than 0,1 billion euros o Level 1: investment between 0,1 and 0,33 billion euros o Level 2: investment between 0,33 and 0,66 billion euros o Level 3: investment between 0,66 and 1,0 billion euros o Level 4: investment higher than 1,0 billion euros
• Implementation – evaluated the viability and maturity of the projects: o Level 0: early stages of development
o Level 4: higher stages of development
The team and I presented this approach to the Structured Business director and after that, AG’s Investment team demonstrated an interest in working with us on this project. Due to that, the previous filtering process was put on hold and we created a new one. Instead of having different levels of investment, the focus would only be in projects with an
investment higher than 1 billion euros and that would be classified as private, public or private-public. Also, we would implement a new method in order to rank, in a transparent and objective way, the different countries allowing AG to know in which markets to enter or not. Based on that, the goal was to combine relevant and different indices that evaluated markets according to AG’s main concerns: perceived corruption, social and political risk, ease of entering the market and education and standard of living of the population. In agreement with those concerns, we chose 4 indices: Corruption Perception Index 2014, Global Risk Index 2014, Ease of Doing Business Index 2015 and Human Development Index 2014. These indices were then converted to the same scale and were attributed different weights in accordance with the current values and concerns of the company. While developing this method we were informed that the Board had already a short list of countries: Sweden, Portugal, Finland, Ireland and Norway. To this list Dr. Pedro Neves suggested adding the UK since many of that country’s projects were in Wales, a part of the country that gets funding from the European Cohesion Fund. Besides that, many private equities are located in London, providing AG a geographic advantage to have access to several sources of funding. In the end, the country list was reduced to three countries: Portugal, United Kingdom (Wales) and Norway, being no longer relevant the development and improvement of the ranked country list.
Juncker Plan: The Investment Plan for Europe
Understanding and defining the plan
The Lehman Brothers collapse in September 2008 and the subsequent credit crunch turned what was already a massive downturn into the worst recession since World War II resulting in a global economic and financial crisis. While Gross Domestic Product (GDP) and private consumption in the European Union (EU) were in the second quarter of 2014 almost at the same level as in 2007, total investment’s figures were however, 15% below. The drop in investments reached approximately €430 billion leading to a fragile recovery from the Euro Crisis since it accounted for the largest proportion of the fall in GDP between 2007 and 2013. The crisis surrounding sovereign debt and the weakness of the financial sector combined with macroeconomic imbalances were slowing down economic recovery and creating risks as low productivity, unemployment and lack of competitiveness that threatened the stability of the European Monetary Union as well as weighing down Europe’s capability to benefit from a gradual improvement of the global economic environment. (European Commission and European Investment Bank, 2015)
In order to revive growth, employment and, to restore confidence in investment, the European Council (Heads of State or Government) decided in 2012 on a Compact for Growth and Jobs suggested by the European Central Bank’s president Mr. Mario Draghi. This plan envisioned that “the EIB’s (European Investment Bank) paid-in capital should be increased by €10 billion, with the goal of strengthening its capital basis as well as increasing its overall lending capacity by €60 billion, and thus unlock up to €180 billion of additional investment, spread across the whole EU, including the most vulnerable countries.” (Council, 2012) It also considered the launch of a Project
Bond Pilot that would bring additional investments of up to €4.5 billion for pilot projects in areas such as transport, energy and broadband infrastructure. Moreover, the compact suggested using EU structural funds to provide loan guarantees for “knowledge and skills, source efficiency, strategic infrastructure and access to finance for small and medium enterprises”. (Council, 2012) Although this compact had the support of German chancellor Angela Merkel and of the, at the time, frontrunner in France’s presidential election, François Hollande, this endeavor’s performance received criticisms from leaders in Southern European countries which argued that their contribution into the EIB’s capital increase did not benefit them since most of the projects went to healthy economies where the risk was lower, not compromising EIB’s triple-A credit rating. (Atkins, Carnegy, & Peel, 2012), (Spiegel, 2014) In November 2014, European Commission (EC) President Jean-Claude Juncker unveiled a proposal for a European Investment Plan that aimed to stimulate private investment.
This plan was based on three mutually reinforcing strands: the first, mobilizing sources of investment finance to deliver at least €315 billion of additional investment, a joint effort between the EC and EIB, over the following three years; the second, making the extra financing reach the real economy and contributing to growth in ways that would be adapted to different sectors and geographies and third, improving the investment environment in Europe by improving the quality of financial regulation. According to EC forecasts, the potential of the Investment Plan was to add €330 to €410 billion to the EU’s GDP and to create 1 to 1.3 million new jobs in the following three years (2015-2017). (European Commission and European Investment Bank, 2015) A new fund, European Fund for Strategic Investments (EFSI) would be set up as a dedicated trust fund within the EIB in order to benefit from its expertise in lending and risk
management as well as the funding. To establish this fund, a €16 billion guarantee would be created under the EU budget and would be backed up by existing EU funds: €2 billion from the margins of the EU budget, €3.3 billion from the Connecting Europe Facility and €2.7 billion from the Horizon 2020 programme, resulting in a total amount of €8 billion. The expected impact of these EU funds on the real economy would have a multiplier effect of 1:2 (€16 billion). The Guarantee, coupled with the EIB-resources of €5 billion would reach the total amount of €21 billion. It would be also possible that this value increases due to public and private contributions as Member States, through their National Promotional Banks, could contribute to the Fund by paying in capital. The initial contribution of €21 billion was expected to potentially yield at least €315 billion between 2015-2017. This could be explained by a multiplier effect of 1:15 in real investment in the economy: one euro of public money in the Fund will enable it to invest three euros in subordinated debt in a specific project, giving private investors the possibility to invest five euros in the safer, senior tranches of that same project for each euro invested by the EIB. The multiplier effect was based on historical experience from EU programmes and the EIB.1 However, it would depend on the mix of activities and the specific features of each project. This initiative was meant to fund viable, valuable and economically sound projects that support both EU policies and objectives and that would boost employment within younger generations.
Although the projects focus areas may be broad, strategic infrastructure in digital and energy investments, transport infrastructures in industrial centers as well as in education, research and innovation would receive special attention and priority to the Investment Committee of the EFSI.
As a leading construction company with experience in these areas and with internationalization plans for the future, the Investment Plan for Europe arose as a promising business opportunity to AG, worth preparing for.
Criticisms to the Investment Plan for Europe
Although the Investment Plan had already been backed by EU leaders (EurActiv, 2015) (RTL Live, 2015) there was still some resistance from northern countries, particularly the UK (Spiegel, 2014) and from leading European industrialists (Gordon, 2014). German economist Daniel Gros, stated: “this European investment plan seems to consist mostly of a bundling of existing financial instruments into one package. Experience has shown that this repackaging yields little, apart from short-lived media attention.” He also expressed some concerns regarding the origin and redistribution of the money for these projects as well as the fairness and justice with which the loans would be granted to the small and medium enterprises. In his opinion the real obstacle was not financing but “the oligopolistic structure of the (national) markets, coupled with the tendency of member states to support their national champions.” (Gros, 2014)
Lastly, the estimate of the expected leverage ratio of 1:15 keeps some commentators wary as it was considered overestimated and somehow unrealistic in today’s economic environment. (Schneider, 2015) In the beginning of 2015, EC published background documents on both the investment plan and the EFSI. These documents presented answers to frequently asked questions from the Commission’s point of view to clarify the doubts of investors, politicians, industrialists and citizens about this initiative. (European Commission, 2015)
Andrade Gutierrez’s Background
In 1948, three Brazilian civil engineers from Minas Gerais, the brothers Gabriel and Roberto Andrade and their friend Flávio Gutierrez, founded Andrade Gutierrez todays second largest construction company in Brazil and one of the largest of Latin America, with presence in over 40 countries, and net sales of R$ 8 billion a year. Their portfolio has projects in areas that go from infrastructure to telecommunications, sanitation and health to oil and gas. They participated in actions for the World Cup and now for the 2016 Olympic Games. The activities of the group go far beyond engineering; they have shares in companies such as Oi, CCR, Contax, Cemig, Brio, Santo Antônio Energia, TEN, Sanepar, Logimed, Hospital Novo Metropolitano and Veotex. Their internationalization occurs in growing economies, developing countries and territories rich in natural resources as oil, gas and mining. These destinations are the ones where investments are most urgent, especially in infrastructure, sanitation and energy. Since the company’s motto is “We built the development of a society. In Brazil and worldwide” (Andrade Gutierrez, 2014), the current economic and social environment of Brazil has deteriorated (OECD, 2015) and AG group has been suffering due to recent investigations (Leahy, 2014) (Leahy, 2015) the possibility to expand their business network and conquer new European markets presents as an opportunity to continue developing and contributing with their expertise.
Andrade Gutierrez’s approach to the Investment Plan
Compass Analysis
As stated previously, the “Compass Strategy” was created to organize, analyze and filter the provisional project list of the Juncker Plan in order to obtain the most suited markets
and projects in which AG should invest. This method comprises four vectors that follow the directions of a compass N-S, S-N, E-W and W-E and represent a different stage on the analysis process.
Vector North – South
This first part of the process is meant to analyze the Juncker Plan in three perspectives: Objectives, Strategy and Features and two other plans: Europe 2020 and Europe 2025 in order to crosscheck information allowing the understanding and assessment of the focus areas that Europe targeted as priority to receive attention and investment to overcome the existent problems. In this stage the team studied, Mobility2, Utilities3, Social4 and Regional and Urban Development5 Plans to better understand which were the sectors
that needed consideration, what was already being done and what were the future goals for them.
Vector South – North
This stage in two phases, the first in which the team converted the list of projects to a dataset where it was possible to organize and standardize the information of the projects provided by the 28 participant countries (Exhibit 2) and to add two new parameters: “Observations” and “Government and Ministry in Charge”. The second phase in which the team filtered the 2089 projects6 according to their level of attractiveness. To measure it, the team created a scoring system in which the projects would be evaluated
2 Ports, Maritime transport, Airports, Roads and Railroads.
3 Gas, Waste Management and Telecommunications.
4 Health, Education, Culture and Security.
5 Agriculture, Tourism, Retail and Logistics.
6 This number does not have in consideration the proposals of Spain since it did not presented projects but
a distribution of funds through their needed areas. A possible explaination for this situation is that by providing information about the projects and their locations the tension with Catalonia might increase.
according to their geography, investment class and implementation. The projects with higher sum of scores would be the most attractive and therefore with higher priority to AG.
Later on the internship the goal was to change this methodology to obtain a ranking of countries rather than projects. This latter method consisted in assorting and weighting a group of relevant and different indices: Corruption Perception Index 2014, Global Risk Index 2014, Ease of Doing Business Index 2015 and Human Development Index 2014, to achieve a structured, organized and suited list of countries and markets in which AG would most likely be interested in penetrating. From this list, the top three to four countries would be chosen to then proceed to capital and competition analysis.
Vector East – West
The third vector comprised two important analyses to the Juncker Plan’s approach: capital and competition. For the first, I gathered data regarding brand value, rating and domicile of 500 commercial banks and also domicile and fundraising amount of 300 private equity companies7. I filtered the data for the commercial banks according to domicile, considering only commercial banks headquartered and based in the 28 European countries of the Juncker Plan, and then ranked them according to their brand value, which measures the financial strength of the brand (Exhibit 3); as for the private equity companies I also filtered the data according to domicile, similarly to what was done for the commercial banks, but ranked according to their fundraising amounts. These analyses allowed me to conjecture where the available capital, needed to complement EFSI’s contribution to fund the projects, could most likely be found. For
the second, competition analysis, the main focus was the listed European construction companies. To that end Deloitte’s European Powers of Construction 2014 report was used to understand and assess which were the main players in the construction industry and what were the challenges and opportunities AG faces when entering a new market (Deloitte, 2015). (Exhibit 4)
Vector West – East
Based on the information that resulted from the previous vectors, this last stage of the Juncker Plan’s approach meant to define AG’s course of action. By combining the identified opportunities with the resources of the company it would be possible to obtain a selection of countries from which AG can invest and enter in.
New Methodology
The purpose of this chapter is to simulate the market selection decision with the development and use of a tool that combines filtering and ranking a set of countries according to certain parameters. The concept behind this tool is similar to the one used in the vector South – North of the Compass Analysis presented previously however, different steps were added to it for the sake of creating a broader method that can be applied not only to the Juncker Plan but to other opportunities that may arise from different initiatives with different markets.
Background
The issue of international market entry strategy has been a concern for managers leading up to the identification and presentation in literature of several approaches to it (Root, 1994), (Cavusgil, 1997), (Hamill & Stonehouse, 2001), (Kotler, 2005). Root’s
model comprises five stages: (1) choosing target market/product, (2) setting the goals and objectives for the target market, (3) choosing an entry mode, (4) defining the marketing plan to penetrate the market, and (5) establish a control system to monitor performance (Root, 1994). Cavusgil sets three guidelines for doing business overseas specifically in emerging markets: (1) market potential assessment and access, (2) market entry, and (3) market establishment. In his proposed framework, special attention is given to the first phase since proper market potential analysis and identification of opportunities overseas can be essential for the survival and growth of a firm (Cavusgil, 1997). As Root, Kotler also divides his framework in five stages: (1) deciding on international market expansion, (2) selecting on a market, (3) selecting an entry mode, (4) defining the marketing plan, and (5) setting the marketing organization (Kotler, 2005). Hamill & Stonehouse propose a four-stage framework: (1) deciding on international market expansion, (2) scouting the international environment for opportunities and threats, (3) choosing a market, and (4) selecting an entry mode (Hamill & Stonehouse, 2001).
Selecting a market tends to dictate the entry mode of a company in a specific market and therefore future viability of the expansion strategy. This stage of the process, present in the models referred above, requires thorough consideration as it gathers several distinct dimensions of each market that need evaluation and due to the impact on resources and effort involved. In the literature, numerous market selection models have been suggested (Cavusgil, 1985), (Kumar, Stam, & Joachimsthaler, 1994), (Root, 1994), (Johansson, 1997), (Koch, 2001). Their goal is to standardize the international market selection, a continuous process of elimination, which intends to achieve the most attractive market(s). The models’ stages vary between three and four stages: (1) country
identification, (2) preliminary screening of markets (or screening), (3) in-depth screening of markets (or identification), and (4) final selection (or selection) (Cavusgil, 1985), (Kumar, Stam, & Joachimsthaler, 1994), (Root, 1994), (Johansson, 1997), (Koch, 2001). Preliminary screening identifies the possible target markets for following in-depth analysis. To do so, macro-level indicators should be used to eliminate countries that do not meet the firm’s goals (Kumar, Stam, & Joachimsthaler, 1994). The next phase, in-depth screening, evaluates the attractiveness of the industry by eliciting industry-specific information to contrive a short-list of potential countries. Final selection analyses firm-specific information such as profitability, forecasts of revenues and cost, product compatibility with the existent portfolio taking into account the company’s objectives, strategies and resources resulting in a country market that meets the company’s objectives. In order to keep preliminary screening process straightforward and effective some models use general country factors (Cavusgil, 1997), (Cavusgil, Kiyak, & Yeniyurt, 2004) while others incorporate industry/product-specific factors (Kumar, Stam, & Joachimsthaler, 1994), (Root, 1994).
In the literature there can also be found two different preliminary screening approaches to identifying target markets: clustering and ranking. While clustering groups countries based on similar commercial, economic, political and cultural dimensions that cannot only help to compare them but also to compare and identify potential synergies among markets; ranking assorts countries in terms of their overall market attractiveness being evaluated according to one or more weighted dimensions (Cavusgil, Kiyak, & Yeniyurt, 2004). Lastly, there are three issues worth discussing. Firstly, the indicators used to evaluate the criteria or dimensions of the preliminary screening depend on the author’s perception. To that end, establishing a more standardized list of indicators per industry
may lead to a less subjective process. Secondly, the weighting of the dimensions, while some studies attribute equal weights to the different dimensions, others give preference to certain dimensions over another’s resulting in an unclear path on how to assign weights to the dimensions. Cavusgil recommends attributing the relative importance of each dimension by using a Delphi process, a systematic forecasting method that consists in interview a panel of business and industry experts (Cavusgil, 1997). This would provide a more fitted solution to the industry in evaluation. Thirdly, which approach, clustering or ranking, should a decision-maker use? Cavusgil suggests that the decision is linked with the overall purpose of the market selection process. If a firm intends to standardize offerings and marketing strategy across different markets with structural similarities among them, then it ought to choose the clustering analysis; if however, the firm intends to identify only the best market to enter then, the ranking approach is the most suited (Cavusgil, Kiyak, & Yeniyurt, 2004).
Analysis and Results
The present study illustrates the application of ranking method in the preliminary market assessment process using the latest available data and considering some alterations to overcome the incompatibility of previous work with the characteristics of the construction industry. Initially a set of 28 countries was considered for the study having suffered a reduction of 15 countries due to the implementation of two sequential filters: “Level of information” and “Differentiation between private, public and PPP”. These filters were chosen according to the available information (Exhibit 5) from the Juncker Plan complete list of projects. By assessing and analyzing it, it was possible to create the first filter: “Level of information” which evaluates each country on three
criteria of its projects: Project Name (!), Sector Type (!) and Description (!). In order not to be dismissed, each country needs to fulfill all the following conditions:
(a) #! > 0,
(b) #! × 0,9 ≤ #! ≤ #! × 1,1 (c) #! × 0,9 ≤ #! ≤ #! × 1,1
The enforcement of this first filter, that represents having 90% of the information for the projects, led to the exclusion of the following countries: Belgium, Malta, Poland and Spain. To the remaining 24 countries the second filter was applied, dismissing the projects that (1) did not made any distinction on whether or not they were private or public and (2) were exclusively public. The goal with the implementation of this filter is to obtain only the private and PPP projects. This last filter caused 11 countries8 to drop leaving a final set of 13 countries: Austria, Bulgaria, Croatia, Czech Republic, Estonia, Finland, Germany, Ireland, Luxembourg, Portugal, Romania and Slovenia. This filtering process was necessary to remove the unsuitable countries for the application of the preliminary market assessment process, ranking.
Building on existing literature (Cavusgil, 1997), (Cavusgil, Kiyak, & Yeniyurt, 2004), (Górecka & Szalucka, 2013) and based on the specific type of industry in study, 10 economic, social and political variables were chosen to assess the markets’ attractiveness.
8 Denmark, France, Greece, Hungary, Italy, Latvia, Lithuania, Netherlands, Slovakia, Sweden and United
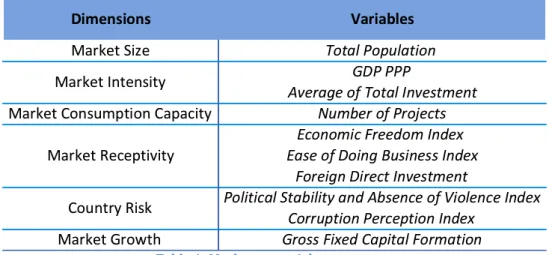
An interpretation of the market’s attractiveness approach recommended by Cavusgil was used here through 6 dimensions represented by 10 variables showed in Table 1 (Cavusgil, 1997). Some of his dimensions were aggregated or replaced: Economic Freedom was absorbed by Market Receptivity to better evaluate the country’s availability to new companies entering its market; and Country Risk replaced Commercial Infrastructure. This last modification to the original approach could be justified by the necessity to account for global political and economic risk rather than the ease of access to communication and distribution channels, since the latter is more suitable for a business-to-consumer model than for AG’s business-to-business model. A detailed table with the descriptions of the dimensions, variables and data used in analyses can be found in Exhibit 6. According to Cavusgil, to rank countries from the best to the worst from the point of view of market expansion, the previous dimensions and variables have to be combined according to their relative importance. Prior to any data aggregation, the raw values of the variables have to be normalized as the indicators in the data set have different measurement units. To this study two normalization methods were chosen: (1) Minimum-Maximum, and (2) Standardization (or z-scores). The first method normalizes data to have an identical range that goes from 0 to 1 by
performing a linear transformation on the indicators: subtracting the minimum value and dividing by the range of the indicator values (maximum – minimum). With this method, outliers (extreme values of the indicator) can distort the transformed indicator. However, this type of normalization can expand the range of indicators lying within a small interval augmenting the effect on the composite indicator greater than the z-scores transformation would. The second method converts indicators to a common scale with a mean and standard deviation of zero and one, respectively. In this case indicators with outliers have a greater effect on the composite indicator, which might not be desirable if the intent is to benefit good performance (Paruolo, Salsana, & Saltelli, 2013).
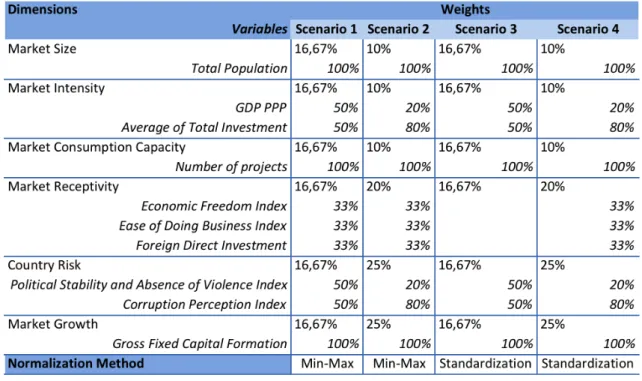
As it was previously mentioned there is no consensus on the weighting of the dimensions and variables so in order to evaluate what would be the main differences in the ranking of the countries this study presents two weighting alternatives: (1) uniform weighted dimensions and variables, and (2) company interests weighted dimensions and variables. Since the implementation of each method may lead to slightly different end results it was decided to create 4 scenarios combining types of normalization and the relative importance of each dimension and variable: (1) dimensions and variables with uniform weights and minimum-maximum normalized data, (2) dimensions and variables weighted according to company’s interests and minimum-maximum normalized data, (3) dimensions and variables with uniform weights and standardized data, and (4) dimensions and variables weighted according to company’s interests and standardized data. Table 2 lists the 6 dimensions of the index, the variables within each, the weights used and the normalization method for each scenario.
Table 3 provides a summary of the results obtained by applying this methodology. It is important to note that scenarios 2 and 4 (weighted according to company’s interests) have 3 dimensions with higher weights: Market Receptivity, Country Risk and Market Growth. These represent the main concerns of the company when deciding to expand to new markets, targeting the ones that provide the higher possibilities of entry and growth with the least amount of risk and corruption.
Table 2: Ranking methodology.
The results from scenarios 1 and 3 show that when dimensions and variables have uniform weights the normalization method used does not affect the overall ranked list of countries. However, in scenarios 2 and 4 where the company’s interests are taken into consideration, standardizing the data (scenario 4) leads two countries to improve on their positions in the ranking, Luxembourg replaces Finland in the third place and Bulgaria replaces Romania in the tenth place. In all four scenarios the first two places belong to Germany and Ireland showing that independently of the normalization method, both countries have the characteristics AG is looking for in a new market, making them the best contestants to pass to the next stages of the market selection models suggested by (Cavusgil, 1985), (Kumar, Stam, & Joachimsthaler, 1994), (Root, 1994), (Johansson, 1997), and (Koch, 2001). The detailed information regarding the indices and ranking can be seen in Exhibits 7, 8, 9 and 10.
The market potential assessment established for the Juncker Plan in this study represents not only a way of evaluating the current business opportunities provided by the plan but also the long-term ones that can arise from entering a specific market.
Future Considerations
The methodology for ranking the country market potential for the Juncker Plan showed in this thesis that it is suitable for managers in the construction industry who intend to enter in the EU. A similar approach could also be developed in order to enter other non-EU markets. To make it a reality, some changes would need to be made: in terms of dimensions a new one could be added – Quality of Life. This dimension could be
measured by the Human Development Index, which combines measures of life expectancy, education and standard of living. This index could help construction companies’ managers evaluate the country’s existent labor force and assess what will be the necessities and costs for their companies when entering a new market. Such evaluation and assessment can be considered crucial for the construction industry since it can change the allocation of specialized human resources of the company. In terms of variables, the combination of four indicators from the World Bank: investment in energy
with private participation, investment in telecoms with private participation, investment in transport with private participation and investment in water and sanitation with private participation, could be added to the Market Growth dimension resulting in the
global variable: Investment with Private Participation.9 Depending on the correlation between the new variable and the previously used (Gross Fixed Capital Formation) it would be necessary to evaluate if this new variable would come as an addition or a substitution.
Conclusion
Assessing and selecting foreign markets for entry that represent long-term potential and business opportunities can be somewhat of a daunting task for managers. They need to have guidelines to lead them through the process especially in such a competitive and fast-paced environment as Europe. Besides being a short-term opportunity, the Juncker Plan can also be seen as a steppingstone for entering new markets. The filtering and ranking method described in this study, initially set in motion in an internship at Andrade Gutierrez, is meant to help with the task in hands allowing managers to obtain
not only a way of obtaining a set of attractive markets in which to enter but also demystify the complexity surrounding market potential assessment. By considering the filters and the weighted dimensions and variables in this study managers in the construction industry can now use this method and adapt it according to the characteristics, needs and reality of their businesses. Lastly it is important to highlight that the outcomes of this method need to be subsequently in-depth analyzed for the outline of a complete market entry strategy.
Bibliography
Andrade Gutierrez. (2014). Quem Somos. Retrieved October 30, 2015, from Andrade Gutierrez: www.andradegutierrez.com.br/QuemSomos.aspx#topo
Atkins, R., Carnegy, H., & Peel, Q. (2012, April 25). "Draghi calls for Europe "growth compact"". Financial Times .
Cavusgil, S. T. (1985). Guidelines for Export Market Research. Business Horizons (November-‐December).
Cavusgil, S. T. (1997). Measuring The Potential Of Emerging Markets: An Indexing Approach. Business Horizons (January-‐February), 87-‐91.
Cavusgil, S. T., Kiyak, T., & Yeniyurt, S. (2004). Complementary approaches to preliminary foreign market opportunity assessment: Country clustering and country ranking. Industrial Marketing Management , 33 (7), 607-‐617.
Council, G. S. (2012). European Council. Retrieved September 28, 2015, from European Council, Council of the European Union:
http://www.consilium.europa.eu/uedocs/cms_Data/docs/pressdata/en/ec/1313 88.pdf
Deloitte. (2015, June). EPoC 2014 European Powers of Construction. Retrieved August 2015, from Deloitte: http://www2.deloitte.com/ie/en/pages/real-‐ estate/articles/EPoC-‐2014-‐European-‐Powers-‐of-‐Construction.html EurActiv. (2015, January 8). EurActive. Retrieved November 2, 2015, from Hollande welcomes Juncker's 300 bn euro EU investment plan:
http://www.euractiv.com/video/hollande-‐welcomes-‐junckers-‐300-‐bn-‐euro-‐eu-‐ investment-‐plan-‐307741
European Commission and European Investment Bank. (2015). Why an Investment
Plan for Europe. Retrieved September 28, 2015, from European Investment Bank:
www.eib.org
European Commission. (2015, January 16). Investment Plan. Retrieved November 2, 2015, from European Commission: http://ec.europa.eu/priorities/jobs-‐growth-‐ investment/plan/index_en.htm
Gordon, S. (2014, December 4). "Industry chiefs question Juncker investment plan".
Financial Times .
Gros, D. (2014, November 27). "The Juncker Plan: From €21 to €315 billion, through smoke and mirrors". CEPS Commentary .
Górecka, D., & Szalucka, M. (2013). Country Market Selection in International Expansion Using Multicriteria Decision Aiding Methods. Multiple Criteria Decision
Hamill, J., & Stonehouse, G. (2001). Globalizacja Strategia i zarzadzanie. Warszawa: Felberg.
Johansson, J. K. (1997). Global Marketing, Foreign Entry, Local Marketing and Global
Management. McGraw-‐Hill.
Koch, A. J. (2001). Selecting Overseas Markets and Entry Modes: Two Decision Process or One? Marketing Intelligence & Planning , 19 (1), 65-‐75.
Kotler, P. (2005). Marketing. Poznan: Rebis.
Kumar, V., Stam, A., & Joachimsthaler, E. (1994). An Interactive Multicriteria Approach to Identifying Potential Foreign Markets. Journal of International
Marketing , 2 (1), 29-‐52.
Leahy, J. (2015, June 19). "Brazil arrests top construction bosses in Petrobras probe". Financial Times .
Leahy, J. (2014, November 24). "Petrobras scam allegations weigh on Brazil as blacklist fears rise". Financial Times .
OECD. (2015). Brazil -‐ Economic Forescast summary (June 2015). Retrieved October 25, 2015, from OECD: www.oecd.org/eco/outlook/brazil-‐economic-‐forecast-‐ summary.htm
Paruolo, P., Salsana, M., & Saltelli, A. (2013). Rating and rankings: voodoo or science? Journal of the Royal Statistical Society: Series A (Statistics in Society) , 176 (3), 609-‐634.
Root, F. R. (1994). Entry Strategies for International Markets. Lexington Books. RTL Live. (2015, March 3). Merkel: Juncker Plan does not preclude structural
reforms. Retrieved November 2, 2015, from RTK Live:
www.rtklive.com/en/?id=3&r=1046
Schneider, J. D. (2015, March 20). Growth for Europe -‐ Is the Juncker Plan the answer? EPC Discussion Paper , 5-‐6.
Spiegel, P. (2014, November 25). "How Juncker plans to unleash investment in Europe". Financial Times .
Spiegel, P. (2014, November 24). "Jean-‐Claude Juncker to unveil €315 bn EU programme". Financial Times .
Appendix
Exhibit 1: Internship Work Calendar.
Exhibit 7: Country index and rankings– scenario 1.
Exhibit 9: Country index and ranking -‐ scenario 3.