Research Article
Port J Public HealthThe Prevalence of Overweight and Obesity in
Adolescents from 1988 to 2014: Results from the
HBSC Portuguese Survey
Adilson Marques
a–cMargarida Gaspar de Matos
c, dMaria do Céu Machado
eAna Naia
d, fJorge Mota
gaCentro Interdisciplinar de Estudo da Performance Humana, Faculdade de Motricidade Humana, Universidade
de Lisboa, Cruz Quebrada, Portugal; bCentro de Investigação em Saúde Pública, Escola Nacional de Saúde
Pública, Universidade Nova de Lisboa, Lisbon, Portugal; cInstituto de Saúde Ambiental, Faculdade de Medicina,
Universidade de Lisboa, Lisbon, Portugal; dFaculdade de Motricidade Humana, Universidade de Lisboa,
Cruz Quebrada, Portugal; eFaculdade de Medicina, Universidade de Lisboa, Lisbon, Portugal; fCentro de
Investigação em Arquitetura, Urbanismo e Design, Faculdade de Arquitetura, Universidade de Lisboa, Lisbon, Portugal; gCentro de Investigação em Atividade Física Saúde e Lazer, Faculdade de Desporto, Universidade do
Porto, Porto, Portugal
Received: March 1, 2018 Accepted: September 21, 2018 Published online: November 13, 2018
Adilson Marques © 2018 The Author(s). Published by S. Karger AG, Basel
DOI: 10.1159/000493987
Keywords
Excess weight · Children · School · HBSC
Abstract
Objective: Using a national representative sample of Portu-guese adolescents, this study aimed to report the preva-lence of overweight and obesity over 16 years, from 1998 to 2014. Methods: The total sample comprised 26,479 adoles-cents (12,711 boys and 13,768 girls) aged 11–16 years (mean age ± SD = 13.5 ± 1.7) from the Health Behaviour in School-aged Children (HBSC) Portuguese survey cohorts from 1998 (n = 5,999), 2002 (n = 5,454), 2006 (n = 4,430), 2010 (n = 4,702), and 2014 (n = 5,894). Weight and height were self-reported. The prevalence of overweight and obesity was calculated along with a 95% confidence interval (CI). Re-sults: The highest prevalence of overweight and obesity was achieved in 2010 (20.5%; 95% CI: 19.5, 21.9) and the low-est in 1998 (17.8%; 95% CI: 16.8, 18.8). The results of trend tests between 1998 and 2014 show that there was no
sig-nificant change in overweight and obesity prevalence. Al-though the prevalence of obesity increased from 1998 to 2014 for the entire sample (0.8%; 95% CI: –5.5, 7.0), for boys (1.1%; 95% CI: –4.1, 6.3), and girls (0.5%; 95% CI: –4.5, 5.4), there were no significant changes in obesity prevalence. Conclusion: The prevalence of overweight and obesity in Portuguese adolescents was around 20% between 1998 and 2014. The extent of overweight and obesity seems to have stabilized over time.
© 2018 The Author(s). Published by S. Karger AG, Basel on behalf of NOVA National School of Public Health Prevalência de excesso de peso e obesidade
dos adolescentes portugueses de 1988 a 2014: Resultados do HBSC
Palavras Chave
Resumo
Objetivo: Com uma amostra representativa de adolescen-tes portugueses, o objetivo do estudo foi reportar a pre-valência de excesso de peso e obesidade entre 1998 e 2014. Metodologia: Participaram no estudo 26,479 ado-lescentes (12,711 rapazes, 13,768 raparigas) com idades entre os 11 e os 16 anos (M = 13.5 ± 1.7), que participaram no estudo Health Behaviour in School-aged Children (HBSC) em 1998 (n = 5,999), 2002 (n = 5,454), 2006 (n = 4,430), 2010 (n = 4,702), e 2014 (n = 5,894). O peso e a altura foram auto reportados. A prevalência de excesso de peso e obesidade foi calculada para um intervalo de confiança de 95%. Resultados: O valor mais elevado para a prevalên-cia de excesso de peso e obesidade foi observado em 2010 (20.5%, 95% CI: 19.5%, 21.9%) e o valor mais baixo foi regis-tado em 1998 (17.8%, 95% CI: 16.8%, 18.8%). Os resulregis-tados da tendência entre 1998 e 2014 mostram que não houve mudanças estatisticamente significativas na prevalência de excesso de peso e obesidade. Relativamente aos va-lores da obesidade, apesar de se verificar um aumento en-tre 1998 e 2014 para a globalidade da amostra (0.8%, 95% CI: –5.5%, 7.0%), para os rapazes (1.1%, 95% CI: –4.1%, 6.3%), e raparigas (0.5%, 95% CI: –4.5%, 5.45), não se veri-ficou uma mudança estatisticamente significativa. Con-clusões: A prevalência de excesso de peso e obesidade dos adolescentes portugueses rondou os 20% entre 1998 e 2014. Ao longo dos 16 anos os valores de prevalência de excesso de peso e obesidade estiveram estabilizados.
© 2018 The Author(s). Published by S. Karger AG, Basel on behalf of NOVA National School of Public Health
Introduction
Over the past 3 decades, the prevalence of adolescent
obesity had increased worldwide, and due to serious
pub-lic health consequences, it was considered a global
epi-demic [1]. Indeed adolescent obesity increases the risk of
experiencing a host of adverse health problems, such as
metabolic syndrome, obstructive sleep apnea,
dyslipid-emia diabetes type II, hypertension [2], and a greater risk
of bullying and social isolation [3]. Moreover, overweight
and obesity in adolescence tends to track into adulthood
and becomes difficult to treat [4].
Therefore, collecting epidemiological data of obesity is
important to support the development of preventive
pro-grams and public strategies [5]. Using a national
repre-sentative sample of Portuguese adolescents, this study
aimed to report the prevalence of overweight and obesity
over 16 years, from 1998 to 2014. Considering the
na-tional implemented policies for preventing overweight
and obesity in schools and municipalities, we also wanted
to evaluate if overweight and obesity in children is
in-creasing.
Methods
Participants and Procedures
The total sample comprised 26,479 adolescents (12,711 boys and 13,768 girls) aged 11–16 years (mean age ± SD = 13.5 ± 1.7) from the Health Behaviour in School-aged Children (HBSC) Por-tuguese survey cohorts from 1998 (n = 5,999), 2002 (n = 5,454), 2006 (n = 4,430), 2010 (n = 4,702), and 2014 (n = 5,894). The HBSC is an international survey that collects data on the health and well-being, social environments, and health behaviors of children and adolescents every 4 years. These data are used to gain new insight into young people’s health and well-being, to understand the social and psychological determinants of health, and to incorporate pol-icies to improve young people’s lives. The methodological aspects of the HBSC study are well developed and published elsewhere [6]. Briefly, the survey is based on a self-administered questionnaire that is completed in public schools. The schools are randomly se-lected from a national list of schools, which has been stratified by Portuguese administrative regions. In each school, classes are ran-domly selected according to the number of students required for each grade. This research was in accordance with the Ethical Com-mittee of Porto Medical School and the National Data Protection System. All school administrators gave their consent, the legal guardians gave written informed consent, and the students pro-vided assent.
BMI
Weight and height were self-reported. The adolescents were aware of their weight and height because they performed a physical fitness test (FitnessGram) several times a year, and physical educa-tion teachers provided informaeduca-tion about their weight and height. It should be noted that FitnessGram began to be widely used in schools in 2005. However, physical education teachers assessed students’ physical fitness with the Eurofit test battery, and many weighed and measured the height of their students.
Self-reporting weight and height is considered a valid tool for BMI estimates of overweight and obesity in epidemiological stud-ies [7]. BMI was then calculated, and the adolescents were classi-fied into underweight, normal weight, overweight, and obese cat-egories according to age- and gender-specific cutoff points pro-posed by the International Obesity Task Force [8]. The cutoff points for adolescent overweight and obesity are linked to the widely accepted adult cutoff points of a BMI of 25 and 30. Because the number of underweight adolescents was very small, under-weight and normal under-weight categories were defined as normal weight.
Statistical Analysis
Descriptive data are presented as percentages, means, and standard deviation for each year’s survey. The differences between participants’ characteristics over time were tested by χ2 and
ANO-VA, for categorical and continuous variables, respectively. The prevalence of overweight and obesity was calculated along with a
95% confidence interval (CI). A p value <0.05 was regarded as sig-nificant. Data analysis was performed using IBM SPSS Statistics version 24.
Results
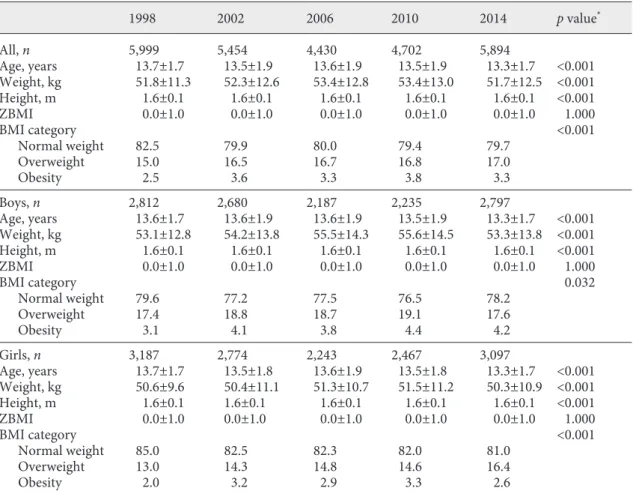
Table 1 shows the characteristics of adolescents over
time. There is a statistically significant difference between
the BMI category and year’s survey for the total sample
(χ
2(12) = 45.201, p < 0.001), boys and girls (χ
2(12) =
22.479, p = 0.032), and girls (χ
2(12) = 37.246, p < 0.001).
However, there is no possibility of establishing a pattern.
The prevalence of overweight and obesity by age and
sex are shown in Table 2. Adolescents aged 11 years had
the highest prevalence of overweight and obesity and, on
the other hand, the oldest had the lowest prevalence. For
the entire sample, the highest prevalence was achieved in
2010 (20.5%; 95% CI: 19.5, 21.9) and the lowest was in
1998 (17.8%; 95% CI: 16.8, 18.8). Of the boys, 23.7% (95%
CI: 21.9, 25.5) were overweight or obese in 2010, and
19.1% (95% CI: 17.7%, 20.5%) of the girls in 2014. The
results of trend tests between 1998 and 2014 show that
there was not significant change in overweight and
obe-sity prevalence.
For the prevalence of obesity, the youngest (aged 11
and 12 years) presented the highest prevalence in all years
surveys (Table 3). Among boys, the estimated prevalence
of obesity was highest in 2010 (4.4%; 95% CI: 2.6, 6.2) and
lowest in 1998 (3.1%; 95% CI: 1.5, 4.6). The highest
prev-alence among girls was in 2002 (3.3%; 95% CI: 1.8, 4.7)
and the lowest was in 1998 (2.1%; 95% CI: 0.8, 3.3).
Al-though the prevalence increased from 1998 to 2014 for
the entire sample (0.8%; 95% CI: –5.5, 7.0), for boys (1.1%;
95% CI: -4.1, 6.3), and girls (0.5%; 95% CI: -4.5, 5.4), there
were no significant changes in obesity prevalence.
Table 1. Participants’ characteristics
1998 2002 2006 2010 2014 p value* All, n 5,999 5,454 4,430 4,702 5,894 Age, years 13.7±1.7 13.5±1.9 13.6±1.9 13.5±1.9 13.3±1.7 <0.001 Weight, kg 51.8±11.3 52.3±12.6 53.4±12.8 53.4±13.0 51.7±12.5 <0.001 Height, m 1.6±0.1 1.6±0.1 1.6±0.1 1.6±0.1 1.6±0.1 <0.001 ZBMI 0.0±1.0 0.0±1.0 0.0±1.0 0.0±1.0 0.0±1.0 1.000 BMI category <0.001 Normal weight Overweight Obesity 82.5 15.0 2.5 79.9 16.5 3.6 80.0 16.7 3.3 79.4 16.8 3.8 79.7 17.0 3.3 Boys, n 2,812 2,680 2,187 2,235 2,797 Age, years 13.6±1.7 13.6±1.9 13.6±1.9 13.5±1.9 13.3±1.7 <0.001 Weight, kg 53.1±12.8 54.2±13.8 55.5±14.3 55.6±14.5 53.3±13.8 <0.001 Height, m 1.6±0.1 1.6±0.1 1.6±0.1 1.6±0.1 1.6±0.1 <0.001 ZBMI 0.0±1.0 0.0±1.0 0.0±1.0 0.0±1.0 0.0±1.0 1.000 BMI category 0.032 Normal weight Overweight Obesity 79.6 17.4 3.1 77.2 18.8 4.1 77.5 18.7 3.8 76.5 19.1 4.4 78.2 17.6 4.2 Girls, n 3,187 2,774 2,243 2,467 3,097 Age, years 13.7±1.7 13.5±1.8 13.6±1.9 13.5±1.8 13.3±1.7 <0.001 Weight, kg 50.6±9.6 50.4±11.1 51.3±10.7 51.5±11.2 50.3±10.9 <0.001 Height, m 1.6±0.1 1.6±0.1 1.6±0.1 1.6±0.1 1.6±0.1 <0.001 ZBMI 0.0±1.0 0.0±1.0 0.0±1.0 0.0±1.0 0.0±1.0 1.000 BMI category <0.001 Normal weight Overweight Obesity 85.0 13.0 2.0 82.5 14.3 3.2 82.3 14.8 2.9 82.0 14.6 3.3 81.0 16.4 2.6
Values are presented as n (%) or mean ± SD. ZBMI, standardized BMI. * Comparison between the five waves. The differences were tested by ANOVA and χ2 tests.
Discussion
This study aimed to report the prevalence of
over-weight and obesity of Portuguese adolescents over a
pe-riod of 16 years, from 1998 to 2014. Trends and correlates
of overweight and obesity among Portuguese adolescents
from 2002 to 2010 were previously addressed in a
differ-ent paper using data from the HBSC survey in Portugal
[9]. This study further expanded this information, adding
data of 1998 and 2014, which is the most recent HBSC
survey [10]. The results of trend tests show that there was
no significant change in overweight and obesity
preva-lence between 1998 and 2014.
The results from this study estimate that at least 1 in
5 adolescents is overweight or obese. This prevalence,
which has been relatively stable over the years [11], is
con-Table 2. Prevalence of overweight and obesity of Portuguese adolescents by sex and age Overweight
or obese 1998 2002 2006 2010 2014 Change from 1998 to 2014, points (95% CI) All 11 years 12 years 13 years 14 years 15 years 16 years 27.0 (24.1, 29.9) 20.6 (17.6, 23.5) 19.2 (16.9, 21.4) 18.1 (15.6, 20.6) 13.1 (11.1, 15.1) 11.1 (9.1, 13.0) 30.3 (27.4, 33.1) 20.8 (17.7, 23.9) 27.2 (24.3, 30.1)23.6 (19.0, 28.2) 24.1 (21.4, 26.7)22.0 (17.3, 26.7) 21.0 (18.7, 23.2)21.9 (18.5, 25.3) –6.0 (–13.5, 1.4)1.3 (–8.5, 11.1) 3.5 (–3.2, 10.2) 3.0 (–5.9, 11.8) 3.8 (–3.8, 11.4) 6.0 (–4.3, 16.3) Total 17.8 (16.8, 18.8) 21.6 (19.2, 24.0) 18.1 (15.3, 20.9) 15.1 (12.8, 17.4) 14.6 (11.9, 17.3) 20.6 (19.5, 21.7) 17.8 (15.4, 20.2) 17.3 (13.5, 21.0) 19.2 (16.9, 21.5) 14.0 (10.8, 17.2) 20.2 (19.0, 21.5) 19.7 (17.3, 22.0) 26.2 (21.7, 30.7) 18.5 (16.4, 20.5) 16.6 (12.9, 20.2) 20.5 (19.5, 21.9) 22.7 (20.7, 24.7) 21.1 (18.0, 24.1) 16.9 (14.7, 19.0) 17.0 (13.6, 20.5) 20.4 (19.4, 21.5) 2.6 (–0.7, 5.9) Boys 11 years 12 years 13 years 14 years 15 years 16 years 30.3 (25.9, 34.6) 22.5 (18.1, 26.9) 21.0 (17.7, 24.4) 19.8 (16.1, 23.4) 17.3 (13.8, 20.7) 14.6 (11.3, 17.8) 29.5 (25.3, 33.7) 21.8 (17.5, 26.1) 28.0 (23.9, 32.0)22.7 (16.8, 28.6) 25.7 (21.8, 29.6)22.6 (16.0, 29.2) 22.9 (19.5, 26.4)22.2 (17.3, 27.2) –7.3 (–18.0, 3.4)–0.3 (–14.3, 13.7) 2.7 (–6.9, 12.2) 4.0 (–8.2, 16.2) 1.5 (–9.8, 12.7) 0.9 (–14.6, 16.4) Total 20.7 (19.2, 22.2) 27.0 (23.2, 30.8) 23.1 (18.8, 27.4) 17.5 (14.0, 21.0) 19.7 (15.6, 23.9) 23.4 (21.8, 25.1) 19.2 (15.7, 22.8) 20.6 (15.0, 26.1) 25.7 (21.8, 29.6) 14.5 (10.0, 19.0) 22.7 (20.8, 24.5) 24.0 (20.3, 27.7) 30.4 (23.8, 36.9) 21.9 (18.5, 25.2) 17.5 (12.0, 22.9) 23.7 (21.9, 25.5) 23.7 (20.7, 26.7) 23.8 (19.4, 28.2) 18.7 (15.4, 22.0) 15.5 (10.4, 20.6) 21.9 (20.3, 23.4) 1.1 (–3.6, 5.8) Girls 11 years 12 years 13 years 14 years 15 years 16 years 24.0 (20.1, 27.9) 18.8 (14.8, 22.7) 17.5 (14.5, 20.5) 16.4 (13.0, 19.8) 10.0 (7.7, 12.3) 8.1 (5.8, 10.4) 31.0 (27.1, 34.9) 19.7 (15.3, 24.1) 26.4 (22.3, 30.5)25.0 (17.5, 32.5) 22.5 (18.9, 26.1)21.4 (14.7, 28.1) 19.3 (16.4, 22.3)21.6 (16.8, 26.4) –4.7 (–15.1, 5.7)2.8 (–10.9, 16.6) 4.3 (–5.1, 13.6) 1.7 (–11.1, 14.5) 5.3 (–5.0, 15.5) 10.1 (–3.7, 23.9) Total 15.3 (14.0, 16.5) 17.0 (14.1, 20.0) 12.8 (9.3, 16.3) 13.0 (10.0, 15.9) 8.8 (5.7, 12.0) 17.9 (16.4, 19.3) 16.5 (13.3, 19.7) 13.8 (9.0, 18.6) 14.3 (11.6, 17.1) 13.4 (8.8, 18.0) 17.9 (16.3, 19.5) 15.7 (12.7, 18.7) 21.7 (15.6, 27.8) 15.8 (13.2, 18.4) 15.8 (10.8, 20.7) 18.0 (16.5, 19.6) 21.7 (18.9, 24.5) 18.1 (14.0, 22.2) 15.3 (12.5, 18.1) 18.3 (13.5, 23.0) 19.1 (17.7, 20.5) 3.9 (–0.7, 8.4)
sidered high as it was above the average of the
Organiza-tion for Economic Co-operaOrganiza-tion and Development
coun-tries [12]. These data are relatively consistent with the
data from a previous cross-sectional study in Portuguese
youth, which also used a representative sample of
chil-dren and adolescents [13]. Furthermore, the study results
are also in line with the results of the most recent data of
childhood obesity surveillance in Portugal, with children
aged between 6 and 8 years [14]. There is a trend towards
stabilization of the prevalence of overweight and obesity
in children over the years. The results of this childhood
obesity survey in Portugal are still similar in relation to
the tendency to reduce the prevalence of obesity with
in-creasing age. Analyzing the results together, the stability
of the prevalence of overweight and obesity has occurred
in childhood and adolescence.
Even though the prevalence of overweight and obesity
is increasing in some parts of the world [15–17], in other
parts, a levelling off of overweight and obesity among
adolescents can be seen, such as in Australia, Japan,
Rus-Table 3. Prevalence of obesity of Portuguese adolescents by sex and age
Obese 1998 2002 2006 2010 2014 Change from 1998
to 2014, points (95% CI) All 11 years 12 years 13 years 14 years 15 years 16 years 4.7 (1.8, 7.7) 3.6 (0.7, 6.6) 2.9 (0.6, 5.1) 2.1 (–0.4, 4.6) 1.4 (–0.5, 3.4) 1.0 (–0.9, 3.0) 5.8 (3.0, 8.7) 4.1 (1.0, 7.2) 4.6 (2.2, 7.0) 5.6 (2.8, 8.5) 6.8 (2.2, 11.5) 2.1 (–0.3, 4.5) 5.1 (2.4, 7.7) 5.0 (0.3, 9.7) 3.2 (0.8, 5.6) 3.8 (1.5, 6.0) 4.5 (1.1, 7.9) 3.2 (1.1, 5.2) 1.0 (–14.2, 12.2) 0.9 (–16.9, 18.6) 0.3 (–12.5, 13.1) 2.1 (–14.1, 18.2) 0.8 (–14.7, 16.3) 1.5 (–21.6, 24.5) Total 2.5 (1.5, 3.5) 2.8 (0.0, 5.6) 2.2 (–0.1, 4.5) 1.9 (–0.7, 4.6) 3.7 (2.6, 4.8) 2.0 (–1.7, 5.7) 2.6 (0.3, 5.0) 2.7 (–0.5, 5.9) 3.4 (2.2, 4.7) 5.5 (1.0, 10.0) 2.9 (0.8, 4.9) 2.8 (–0.9, 6.4) 3.8 (2.6, 5.0) 4.2 (1.1, 7.2) 2.2 (0.1, 4.4) 2.5 (–1.0, 6.0) 3.3 (2.3, 4.3) 0.8 (–5.5, 7.0) Boys 11 years 12 years 13 years 14 years 15 years 16 years 5.4 (1.1, 9.8) 5.2 (0.8, 9.6) 3.0 (–0.4, 6.4) 2.6 (–1.0, 6.3) 1.5 (–1.9, 4.9) 1.3 (–1.9, 4.6) 4.8 (0.6, 9.0) 5.4 (1.1, 9.7) 6.1 (2.3, 9.9) 6.6 (2.5, 10.6) 5.2 (–0.7, 11.0) 2.5 (–1.0, 6.1) 5.9 (2.0, 9.8) 5.8 (–0.8, 12.4) 3.6 (0.0, 7.3) 4.3 (0.9, 7.7) 6.3 (1.3, 11.3) 3.7 (0.7, 6.6) –1.2 (–13.4, 11.0) 1.1 (–14.4, 16.5) 0.7 (–9.9, 11.3) 2.9 (–10.6, 16.4) 1.1 (–11.1, 13.4) 2.8 (–13.7, 19.3) Total 3.1 (1.5, 4.6) 3.5 (–0.8, 7.8) 2.2 (–1.3, 5.7) 2.8 (–1.3, 7.0) 4.2 (2.6, 5.9) 2.5 (–3.1, 8.0) 3.8 (–0.1, 7.7) 3.0 (–1.5, 7.5) 4.0 (2.2, 5.9) 4.2 (–2.3, 10.7) 4.1 (0.8, 7.5) 2.1 (–3.3, 7.5) 4.4 (2.6, 6.2) 5.5 (1.1, 9.9) 2.6 (–0.7, 5.9) 4.1 (–1.0, 9.2) 4.1 (2.6, 5.7) 1.1 (–4.1, 6.3) Girls 11 years 12 years 13 years 14 years 15 years 16 years 4.1 (0.2, 8.0) 2.1 (–1.8, 6.1) 2.8 (–0.2, 5.7) 1.5 (–1.9, 4.9) 1.4 (–0.9, 3.7) 0.7 (–1.6, 3.0) 6.7 (2.8, 10.6) 2.6 (–1.8, 7.0) 3.4 (0.4, 6.3) 4.7 (0.6, 8.7) 9.4 (1.9, 16.9) 1.7 (–1.5, 4.9) 4.3 (0.7, 7.9) 4.1 (–2.5, 10.8) 2.8 (–0.2, 5.8) 3.3 (0.4, 6.3) 2.8 (–2.0, 7.5) 2.7 (–0.2, 5.5) –0.8 (–12.3, 10.8) 0.6 (–14.6, 15.8) –0.1 (–10.4, 10.2) 1.1 (–12.8, 15.1) 0.5 (–10.4, 11.4) 0.5 (–14.4, 15.3) Total 2.1 (0.8, 3.3) 2.0 (–1.5, 5.5) 2.2 (–0.7, 5.1) 0.9 (–2.2, 4.1) 3.3 (1.8, 4.7) 1.5 (–3.3, 6.4) 1.8 (–1.0, 4.5) 2.4 (–2.2, 7.0) 2.9 (1.2, 4.5) 6.9 (0.7, 13.0) 1.9 (–0.7, 4.5) 3.3 (–1.6, 8.3) 3.2 (1.7, 4.8) 2.7 (–1.4, 6.8) 1.9 (–0.9, 4.7) 1.2 (–3.6, 6.0) 2.5 (1.1, 3.9) 0.5 (–4.5, 5.4)
sia, the United States, and some European countries [18–
21]. The results from the present study including
Portu-guese adolescents from 1998 to 2014 contributed to the
growing evidence of the observed stabilization of the
prevalence of overweight and obesity, refuting what has
been suggested, namely that adolescent overweight and
obesity are increasing exponentially. Since only recent
studies have approached the levelling off in overweight
and obesity, the reasons for stagnation in some countries
are yet unclear. One reason could be that being
over-weight has been recognized as a public health concern,
which has led to the implementation of programs to
pro-mote physical activity and healthy eating habits, mainly
in the school setting to reach all children and adolescents.
Another reason could be that children and adolescents
with a predisposition to becoming overweight or obese
have already become overweight or obese, and thus a
sat-uration equilibrium was achieved [19]. However, this
theoretical explanation can easily be refuted because
sta-bilization has been occurring at very different levels in
different countries.
As observed previously in Portugal [13] and Spain
[22], the prevalence of overweight and obesity is higher
among the youngest adolescents. On the contrary, older
adolescents in the United Stated of America were more
likely to be overweight or obese [23, 24]. The differences
may reflect sociocultural dissimilarities among countries
and denote that the relationship between obesity and age
is not determined biologically.
Some limitations and strengths should be addressed.
First, height and weight were self-reported and are
sub-ject to bias. Nevertheless, self-reporting weight and
height is considered a valid tool for BMI estimates in
epidemiological studies [7], and BMI has been shown to
correlate highly with dual energy X-ray absorptiometry
of body fatness in adolescents [25]. Second, BMI does
not discriminate between lean and fat mass. Yet, it is an
appropriate measurement for the indirect assessment of
adiposity in young people [26]. Third, in studies that use
data from samples from different periods of time,
self-reporting weight and height might be subject to
tempo-ral changes because attitudes about overweight and
obe-sity are changing [27]. Although the present study used
a representative sample of Portuguese adolescents,
strat-ified by region, the analysis did not take into account
socioeconomic data. This, perhaps, would be of
impor-tance because in Portugal, the socioeconomic status is a
determinant of overweight and obesity among girls [28].
The strengths of this study include the sample size,
na-tional representativeness in all years surveys, and the use
of an international definition for overweight and obese
status that allows a comparison between the year’s
sur-vey.
Conclusion
The prevalence of overweight and obesity in
Portu-guese adolescents was around 20% between 1998 and
2014. Despite the study’s methodological limitations, the
extent of overweight and obesity seems to have stabilized
over time. Nonetheless, the prevalence is still considered
high, which means that a high proportion of adolescents
may have the risk of a cardiovascular disease associated
with excess weight. Therefore, strategies that promote
healthy weight among children and adolescents, using
families as partners, are required to prevent overweight
and obesity.
Statement of Ethics
This research was in accordance with the Ethical Committee of Porto Medical School and the National Data Protection System. All school administrators gave their consent, the legal guardians gave written informed consent, and the students provided assent.
Disclosure Statement
The authors declare that they have no conflicts of interest to disclose.
Funding Sources
The manuscript received no external financial support.
Author Contributions
Conception and design: Adilson Marques and Margarida Gas-par de Matos.
Data acquisition: Margarida Gaspar de Matos.
Data analysis and interpretation: Adilson Marques, Margarida Gaspar de Matos, Jorge Mota, Maria do Céu Machado, Ana Naia.
Drafting the manuscript: Adilson Marques and Margarida Gaspar de Matos.
Critical revision of the intellectual content: Jorge Mota, Maria do Céu Machado, Ana Naia.
Statistical expertise: Adilson Marques.
Administrative, technical, or material support: Ana Naia. Study supervision: Margarida Gaspar de Matos.
References
1 WHO. Global status report on noncommuni-cable diseases 2014. Geneva: World Health Organization; 2014.
2 Steinberger J, Daniels SR, Eckel RH, Hayman L, Lustig RH, McCrindle B, et al.; American Heart Association Atherosclerosis, Hyperten-sion, and Obesity in the Young Committee of the Council on Cardiovascular Disease in the Young; Council on Cardiovascular Nursing; and Council on Nutrition, Physical Activity, and Metabolism. Progress and challenges in metabolic syndrome in children and adoles-cents: a scientific statement from the Ameri-can Heart Association Atherosclerosis, Hy-pertension, and Obesity in the Young Com-mittee of the Council on Cardiovascular Disease in the Young; Council on Cardiovas-cular Nursing; and Council on Nutrition, Physical Activity, and Metabolism. Circula-tion. 2009 Feb;119(4):628–47.
3 Lobstein T, Baur L, Uauy R; IASO Interna-tional Obesity TaskForce. Obesity in children and young people: a crisis in public health. Obes Rev. 2004 May;5(Suppl 1):4–104. 4 Park MH, Falconer C, Viner RM, Kinra S. The
impact of childhood obesity on morbidity and mortality in adulthood: a systematic review. Obes Rev. 2012 Nov;13(11):985–1000. 5 WHO. Report of the commission on ending
childhood obesity. Geneva: World Health Or-ganization; 2016.
6 Currie C, Hurrelmann K, Settertobulte W, Smith R, Todd J. Health and health behavior among young people. Health Behaviour in School-aged Children: a WHO cross-national study (HBSC). Copenhagen: World Health Organization; 2000.
7 Fonseca H, Silva AM, Matos MG, Esteves I, Costa P, Guerra A, et al. Validity of BMI based on self-reported weight and height in adoles-cents. Acta Paediatr. 2010 Jan;99(1):83–8. 8 Cole TJ, Bellizzi MC, Flegal KM, Dietz WH.
Establishing a standard definition for child overweight and obesity worldwide: interna-tional survey. BMJ. 2000 May;320(7244): 1240–3.
9 Marques A, Gaspar De Matos M. Trends and correlates of overweight and obesity among adolescents from 2002 to 2010: a three-cohort
study based on a representative sample of Portuguese adolescents. Am J Hum Biol. 2014 Nov-Dec;26(6):844–9.
10 Matos M, Simões C, Camacho I, Reis M. Equipa Aventura Social: A saúde dos adoles-centes portugueses em tempos de recessão: dados nacionais 2014. Lisboa: Edições FMH; 2015.
11 Marques A, de Matos MG. Trends in preva-lence of overweight and obesity: are Portu-guese adolescents still increasing weight? Int J Public Health. 2016 Jan;61(1):49–56. 12 OECD. Health at a glance 2013: OECD
indi-cators. Paris: OECD Publishing; 2013. 13 Sardinha LB, Santos R, Vale S, Silva AM,
Fer-reira JP, Raimundo AM, et al. Prevalence of overweight and obesity among Portuguese youth: a study in a representative sample of 10-18-year-old children and adolescents. Int J Pediatr Obes. 2011 Jun;6(2-2):e124–8. 14 Rita A, Cruz de Sousa R, Mendes S, Graça P.
Childhood obesity surveillance initiative. COSI Portugal 2016. Lisboa: Instituto Nacio-nal de Saúde Doutor Ricardo Jorge; 2017. 15 Martínez-Vizcaíno V, Solera Martínez M,
Notario Pacheco B, Sánchez López M, García-Prieto JC, Torrijos Niño C, et al. Trends in excess of weight, underweight and adiposity among Spanish children from 2004 to 2010: the Cuenca Study. Public Health Nutr. 2012 Dec;15(12):2170–4.
16 Masuet-Aumatell C, Ramon-Torrell JM, Ban-qué-Navarro M, Dávalos-Gamboa MR, Mon-taño-Rodríguez SL. [Prevalence of over-weight and obesity in children and adoles-cents from Cochabamba (Bolivia); a cross- sectional study]. Nutr Hosp. 2013 Nov;28(6): 1884–91.
17 Zhang YX, Wang SR. Rural-urban compari-son in prevalence of overweight and obesity among adolescents in Shandong, China. Ann Hum Biol. 2013 May;40(3):294–7.
18 Rokholm B, Baker JL, Sørensen TI. The level-ling off of the obesity epidemic since the year 1999 – a review of evidence and perspectives. Obes Rev. 2010 Dec;11(12):835–46. 19 Schmidt Morgen C, Rokholm B, Sjöberg
Brix-val C, Schou Andersen C, Geisler Andersen L, Rasmussen M, et al. Trends in prevalence of
overweight and obesity in danish infants, chil-dren and adolescents – are we still on a pla-teau? PLoS One. 2013 Jul;8(7):e69860. 20 Olds T, Maher C, Zumin S, Péneau S, Lioret
S, Castetbon K, et al. Evidence that the preva-lence of childhood overweight is plateauing: data from nine countries. Int J Pediatr Obes. 2011 Oct;6(5-6):342–60.
21 Popkin BM, Conde W, Hou N, Monteiro C. Is there a lag globally in overweight trends for children compared with adults? Obesity (Sil-ver Spring). 2006 Oct;14(10):1846–53. 22 Sánchez-Cruz JJ, Jiménez-Moleón JJ,
Fernán-dez-Quesada F, Sánchez MJ. Prevalence of child and youth obesity in Spain in 2012. Rev Esp Cardiol (Engl Ed). 2013 May;66(5):371– 6.
23 Moreno G, Johnson-Shelton D, Boles S. Prev-alence and prediction of overweight and obe-sity among elementary school students. J Sch Health. 2013 Mar;83(3):157–63.
24 Hughes AR, Sherriff A, Lawlor DA, Ness AR, Reilly JJ. Incidence of obesity during child-hood and adolescence in a large contemporary cohort. Prev Med. 2011 May;52(5):300–4. 25 Steinberger J, Jacobs DR, Raatz S, Moran A,
Hong CP, Sinaiko AR. Comparison of body fatness measurements by BMI and skinfolds vs dual energy X-ray absorptiometry and their relation to cardiovascular risk factors in ado-lescents. Int J Obes (Lond). 2005 Nov;29(11): 1346–52.
26 Lindsay RS, Hanson RL, Roumain J, Ravussin E, Knowler WC, Tataranni PA. Body mass in-dex as a measure of adiposity in children and adolescents: relationship to adiposity by dual energy x-ray absorptiometry and to cardio-vascular risk factors. J Clin Endocrinol Metab. 2001 Sep;86(9):4061–7.
27 Stommel M, Osier N. Temporal changes in bias of body mass index scores based on self-reported height and weight. Int J Obes. 2013 Mar;37(3):461–7.
28 WHO. Growing up unequal: gender and so-cioeconomic differences in young people’s health and well-being. Health Behaviour in School-aged Children (HBSC) study: interna-tional report from the 2013/2014 survey. Co-penhagen: World Health Organization; 2016.