Repositório ISCTE-IUL
Deposited in Repositório ISCTE-IUL: 2019-02-06
Deposited version: Post-print
Peer-review status of attached file: Peer-reviewed
Citation for published item:
Peralta, M., Ramos, M., Lipert, A., Martins, J. & Marques, A. (2018). Prevalence and trends of
overweight and obesity in older adults from 10 European countries from 2005 to 2013. Scandinavian Journal of Public Health. 46 (5), 522-529
Further information on publisher's website: 10.1177/1403494818764810
Publisher's copyright statement:
This is the peer reviewed version of the following article: Peralta, M., Ramos, M., Lipert, A., Martins, J. & Marques, A. (2018). Prevalence and trends of overweight and obesity in older adults from 10 European countries from 2005 to 2013. Scandinavian Journal of Public Health. 46 (5), 522-529, which has been published in final form at https://dx.doi.org/10.1177/1403494818764810. This article may be used for non-commercial purposes in accordance with the Publisher's Terms and Conditions for self-archiving.
Use policy
Creative Commons CC BY 4.0
The full-text may be used and/or reproduced, and given to third parties in any format or medium, without prior permission or charge, for personal research or study, educational, or not-for-profit purposes provided that:
• a full bibliographic reference is made to the original source • a link is made to the metadata record in the Repository • the full-text is not changed in any way
Prevalence and trends of older adults’ overweight and obesity in 10
European countries from 2005 to 2013
Adilson Marques1, Miguel Peralta2, Madalena Ramos3, Anna Lipert4, João Martins6,7, Luís Saboga Nunes2
1 Centro Interdisciplinar de Estudo da Performance Humana, Faculdade de Motricidade Humana, Universidade de Lisboa, Lisboa, Portugal
2 Faculdade de Motricidade Humana, Universidade de Lisboa, Lisboa, Portugal
3
Centro de Investigação e Estudos de Sociologia, Escola de Sociologia e Políticas Públicas, Instituto Universitário de Lisboa, Lisboa, Portugal
4
Department of Sport Medicine, Medical University of Lodz, Poland 5
Laboratório de Pedagogia, Faculdade de Motricidade Humana e UIDEF, Instituto de Educação, Universidade de Lisboa, Portugal
7
Centro de Investigação em Saúde Pública, Escola Nacional de Saúde Pública, Universidade NOVA de Lisboa, Lisboa, Portugal
Corresponding author: João Martins, Faculdade de Motricidade Humana, Universidade de Lisboa, Estrada da Costa, 1499-002, Cruz Quebrada, Dafundo, Portugal. Telephone: (+351) 214149100. Fax: (+351) 214151248. Email: jmartins@fmh.ulisboa.pt.
What was already known about the topic
Overweight and obesity are clinical public health concerns worldwide.Among older adults, the prevalence of overweight and obesity in considered high and stable in the last years.
What new knowledge the manuscript contributes
The current study provides important insight into the prevalence of overweight and obesity in Europe using standardized research methodology across a large
representative European sample and across several years. It adds to the literature that the prevalence of overweight among elderly Europeans is relatively stable, but the number of obese people is rising.
Abstract
Objective: Overweight and obesity are clinical public health concerns
worldwide. Among older adults, the prevalence of overweight and obesity is considered high. The purpose of this study was to provide current data regarding the prevalence and trends of overweight and obesity of adults, from 2005 to 2013, in 10 European countries. Methods: The data used in the present study was derived from the first, second, fourth and fifth waves of the Survey of Health, Ageing and Retirement in Europe (SHARE). The present study includes individuals aged ≥ 50 years from 10 European countries. Body mass index (BMI) was calculated from self-reported height and weight (kg/m2). Results: More than half of the participants were overweight or obese (BMI≥25). Between 2005 and 2013 the general prevalence of overweight (BMI≥25 kg/m2) was slightly above 60%. The prevalence of overweight or obesity was relatively stable between 2005 (60.1%, 95% CI: 59.3%, 60.9%) and 2013 (60.3%, 95% CI: 59.7%, 60.9%). Obesity (BMI≥30) prevalence increased significantly (1.6%, 95% CI: 0.7%, 2.6%), from 17.5% in 2005 to 19.2% in 2013. In most countries there is an increase of the prevalence of obesity, but the only significant increase was observed in Germany (5.8%, 95% CI: 1.8%, 9.9%). In Spain the prevalence of obesity decreased significantly between 2005 and 2013 (-4.7%, 95% CI: -8.8%, -0.5%). Conclusion: This study findings indicate that the prevalence of overweight among elderly Europeans is relatively stable, but the number of obese people is rising.
Introduction
Overweight and obesity are clinical public health concerns worldwide.1-3 Among older adults, the prevalence of overweight and obesity in considered high.4 Obesity is a major risk factor for diabetes,5 hypertension,6 coronary heart disease,7 and certain types of cancer.8 Obesity is also associated with osteoarthritis, asthma, and depression.9
Over the last decades, the prevalence of overweight and obesity in most economic developed countries remained stable,4 but with a huge health and economic impact. By 2009 obesity was estimated to account for between 0.7% and 2.8% of a country’s total healthcare expenditure.10 Additionally, obese individuals were found to have medical costs that were approximately 30% higher than their normal weight peers. Monitoring obesity and overweight prevalence and trends is important for assessing interventions aimed at preventing or reducing the burden of obesity. This is particularly important among older adults, because overweight and obesity in this population group is also associated with a greater risk of physical inactivity,11
mobility limitation,12 osteoarthritis9 and poor functional performance.13 Consequently this impacts health and quality of life for older individuals. Therefore, the purpose of this study was to provide current data regarding the prevalence and trends of
overweight and obesity of adults, from 10 European countries, aged over 50 years from 2005 to 2013.
Methods
Participants and study design
The data used in the present study were derived from the first, second, fourth and fifth waves of the Survey of Health, Ageing and Retirement in Europe (SHARE).
SHARE is an interdisciplinary survey on ageing that is run every two years and collects extensive information on health, socioeconomic status and family interactions of individuals aged 50 and over in several European countries from Scandinavia to the Mediterranean.14 The survey aimed to produce a representative sample of both
citizens and households within countries. Households were eligible for inclusion if at least one member was ≥50 years old, if household members were not living in an institution (e.g., nursing home, prison) or were abroad when fieldwork took place, and if the official language of the country was spoken in the household. Within
households, all individuals meeting these criteria, plus their spouses and partners, independent of their age, qualified for participation in interviews. Households were selected randomly using local, regional or national citizen registries depending on availability in their respective countries.
The present study included individuals aged ≥ 50 years from 10 countries (Austria, Belgium, Denmark, France, Germany, Italy, Netherlands, Spain, Sweden, Switzerland). Data from 6 other countries (Czech Republic, Estonia, Greece,
Hungary, Ireland, Israel, Luxembourg, Poland, Portugal, Slovenia,) that participated in the SHARE project were excluded because in those countries there were no data from all the waves that characterize the SHARE project. For the present study there were no data from wave three, in 2009, because in this wave weight and height were not assessed. The final sample comprised 24356 participants (11115 men, 13241 women) from wave one in 2005, 24508 participants (11128 men, 13380 women) from wave two in 2007, 35428 participants (15877 men, 25560 women) from wave four in 2011, 46903 participants (21343 men, 25560 women) from wave five in 2013.
Data were collected face to face by trained interviewers using a computer-assisted personal interviewing program, supplemented by a self-completed
paper-and-pencil questionnaire (available at http://www.share-project.org/methodological-research.html). Comparable questionnaires were applied in each country. Translation guidelines were applied and pilots were performed to enhance comparability. The study protocol was approved by the Ethics Committee of the University of Mannheim, and by the Ethics Council of the Max-Planck-Society for the Advancement of Science.
Body mass index
Body mass index (BMI) was calculated from self-reported height and weight (kg/m2). BMI categories were calculated in accordance with World Health
Organization guidelines15: normal weight (18.5-24.9 kg/m2), overweight (25-29.9 kg/m2), and obese (≥30 kg/m2).
Statistical analysis
Descriptive statistics were performed to characterize the sample. For the prevalence of overweight and obesity was calculate the percentage and 95%
confidence interval (CI). The differences between participants’ characteristics in all waves were tested by ANOVA and Chi-square tests. Data analysis were performed using IBM SPSS Statistics version 22 (SPSS Inc., an IBM Company, Chicago, Illinois, U.S.A.). When statistical tests were applied the level of significant was set at
p<0.05.
Results
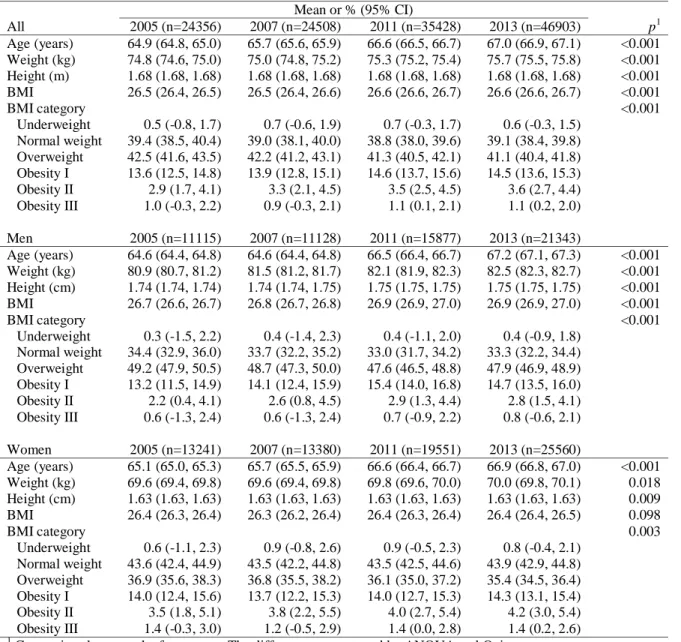
Table 1 presents the participants characteristics in 2005, 2007, 2011, and 2013. Weight increased slightly, but significantly, between 2005 and 2013 in men (p<0.001) and women (p=0.018), whereas, BMI increased significantly only in men (p<0.001).
***** Table 1 *****
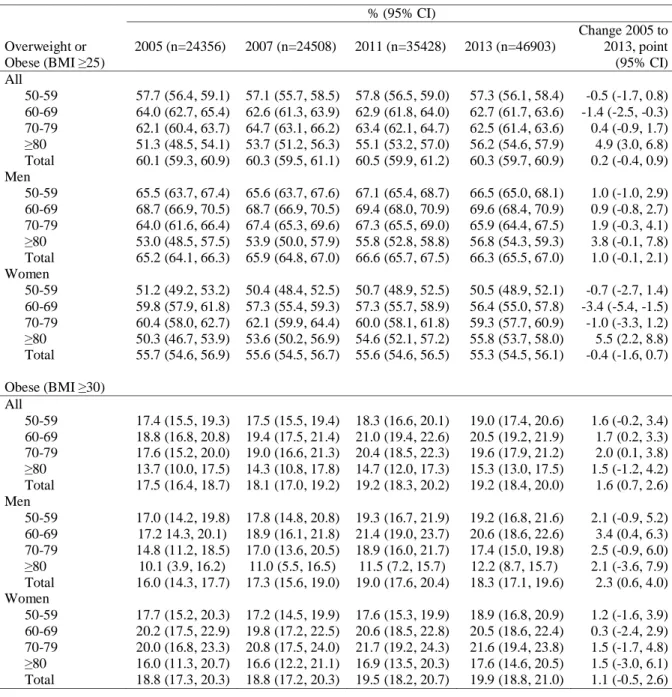
Prevalence of overweight and obesity by sex and age are shown in Table 2. Between 2005 and 2013 the general prevalence of overweight (BMI≥25 kg/m2) or obesity (BMI≥30 kg/m2) was slightly above 60% (2005: 60.1, 95% CI: 59.3, 60.9; 2007: 60.3, 95% CI: 59.5, 61.1; 2011: 60.5, 95% CI: 59.9, 61.2; 2013: 60.3, 95% CI: 59.7, 60.9), increasing 0.2% (95% CI: -0.4, 0.9) from 2005 to 2013. However there were differences between sexes and age groups. Although men’s overweight or obesity prevalence increased 1.0% (95% CI -0.1, 2.1), the prevalence for women has decreased 0.4% (95% CI: -1.6, 0.7). Estimates indicate that the general prevalence of overweight or obesity decreased in age groups 50-59 (-0.5%, 95% CI: -1.7, 0.8) and 60-69 (-1.4%, 95% CI: -2.5, -0.3) years old, while increasing in age groups 70-79 (0.4%, 95% CI: -0.9, 1.7) and ≥80 (4.9%, 95% CI: 3.0, 6.8) years. Whereas for men prevalence has increased for all age groups, between 0.9% (60-69 years) and 3.8% (≥80years), for women it has only increased in age group ≥80 years old (5.5%, 95% CI: 2.2, 8.8).
General prevalence of obesity (BMI≥30) has increased 1.6% (95% CI: 0.7, 2.6) from 17.5 (95% CI: 16.4, 18.7) in 2005 to 19.2 (95% CI: 18.4, 20.0) in 2013. Overall, men’s prevalence of obesity (2.3%, 95% CI: 0.6, 4.0) increased slightly more than women’s (1.1%, 95% CI: -0.5, 2.6), between 2005 and 2013. Age group 60-69 (3.4%, 95% CI: 0.4, 6.3) years old for men and age groups 7079 (1.5%, 95% CI: -1.7, 4.8) and ≥80 (1.5%, 95% CI: -3.0, 6.1) years old for women presented the biggest increases in prevalence of obesity.
***** Table 2 *****
In every country more than half of the participants were overweight or obese (BMI≥25) (Figure 1). In 2013, Switzerland (53.9%, 95% CI: 51.5%, 56.3%), Denmark (55.0%, 95% CI: 53.0%, 57.1%) and Sweden (56.0%, 95% CI: 54.0%, 57.9%) had the lowest prevalence of overweight or obesity, while Spain (67.4%, 95% CI: 66.0%, 68.8%), Germany (64.0%, 95% CI: 62.5%, 65.6%) and Austria (62.9%, 95% CI: 61.1%, 64.7%) had the highest. Overall, the prevalence of overweight or obesity was stable between 2005 (60.1%, 95% CI: 59.3%, 60.9%) and 2013 (60.3%, 95% CI: 59.7%, 60.9%). However there are some differences when analysing countries separately. For example, France (2.7%, 95% CI: -0.3%, 5.7%), Denmark (2%, 95% CI: -1.9%, 6.0%) and Switzerland (2%, 95% CI: -3.0%, 7.0%) prevalence of overweight or obesity rose more than 1.9% from 2005 to 2013, however, the increase was not significant. On the other hand, it was observed a significant decreased in the prevalence of overweight in Spain (-3.5%, 95% CI: -6.1%, -0.9%) and Italy (-4.3%, 95% CI: -7.3%, -1.3%).
***** Figure 1 *****
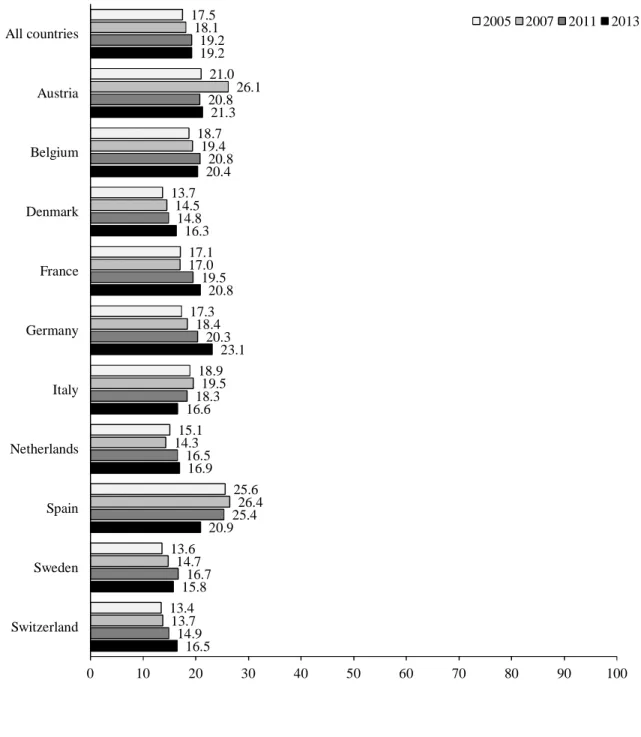
Obesity (BMI≥30) prevalence was between 13.4% (95% CI:7.5%, 19.3%) in Switzerland and 25.6% (96% CI: 22.0%, 29.1%) in Spain in 2005, and between 15.8% (95% CI: 13.1%, 18.4%) in Sweden and 23.1% (95% CI: 18.7%, 23.0%) in Spain in 2013 (Figure 2). From 2005 to 2013 the prevalence of obesity increased 1.6% (95% CI: 0.7%, 2.6%). Likewise, in most countries prevalence of obesity rose, but the only significant increase was observed in Germany (5.8%, 95% CI: 1.8%,
9.9%). In Spain the prevalence of obesity decreased significantly (4.7%, 95% CI: -8.8%, -0.5%).
***** Figure 2 *****
Discussion
Based on the results from this study, between 2005 and 2013 the general prevalence of overweight (BMI≥25 kg/m2) or obesity (BMI≥30 kg/m2) in European adults was slightly above 60%, increasing 0.2% from 2005 to 2013. The results are in line with previous research conducted in Europe in which over 50% of the European population was overweight.16 The highest prevalence of overweight or obesity was in Spain (67.4%), Germany (64.0%) and Austria (62.9%). From 2005 to 2013 the prevalence of overweight and obesity decreased slightly, but the prevalence of obesity in Germany increased significantly, whereas decreased in Spain and Italy. It is in contrast with a previous study that report the geographic variation of prevalence rates, which the higher prevalence was in Central, Eastern, and Southern Europe.17
Only in Spain and Italy the prevalence of overweight or obesity decreased significantly from 2005 to 2013 (-3.5%; -4.7% respectively). The most updated information on trends and determinants of excessive body weight in Italian adults shows that there are no unfavourable trends in overweight and obesity prevalence, but there are specific subgroups of the population with elevated prevalence of overweight and obesity, mainly adults from southern Italy and those with lower levels of
education.18
The wide variations in BMI seen in different European populations may be due in part to differences in sedentary lifestyle and a lack of physical activity,19-21 and
due in part to ethnic affiliation. In studies including various groups of immigrants in Canada22 and Sweden,23 ethnicity has been shown to be a major determinant of obesity independently of socioeconomic factors. Many European countries have undergone substantial population changes due to immigration from Eastern Europe, as well as from outside of Europe, over the past two decades.
The current study shows that in every country more than half of the participants were characterized by excess body weight, but there were some
noticeable differences in prevalence of overweight or obesity depending on sex and age. In European men, overweight or obesity prevalence increased in all age groups, while overweight or obesity prevalence among European women has only increased in age group ≥80 years old. The biggest increases in prevalence of obesity were observed in age group 60-69 years old for men and in age groups 70-79 and ≥80 years old for women. Similar associations between excess body weight and sex and age have been reported in other studies within specific European countries, including Spain, Germany, and the UK.24,25
The current study possesses many strengths, including providing important insight into the prevalence of overweight and obesity in Europe using standardized research methodology across a large representative sample. The study analysed the data collected for a long period of time, and in this context it could be seen more objective the prevalence of overweight and obesity in European population, than if calculated from data of just only one year. Furthermore, despite the multifaceted burden imposed by obesity, paucity of research pertaining to consider the prevalence of overweight and obesity in adult population in Europe is noticeable.
However, even if this study aims at bringing more contributions to this
on the data of the SHARE project, collected between 2005-2013 (with the gap in 2009, the year in which the weight and the height were not assessed). Second, the results concern 10 European countries, because we had to exclude a few countries due to the lack of data. Consequently our results cannot be generalized on the whole of Europe. Further, whereas the BMI classification system possesses important utility in studying population health, it is not without its limitations.26 BMI can be biased when based on self-reported height and weight, with individuals traditionally
overestimating their height and underestimating their weight. In addition, BMI classifications can be inaccurate for certain groups (e.g., professional athletes or those possessing a high level of muscle mass).16
This study findings indicate that although the estimated prevalence of
overweight and obesity are different in various studies, the prevalence of overweight and obesity is considered high among elder European population. It is similar to what have been reported in the United States.27 Based on the data currently available for Europe, European older adults’ prevalence of obesity has already reached epidemic proportions.
As obesity is a risk factor for a number of diseases, its higher prevalence nurtures the supposition that obesity is related with a rowing and significant economic burden to society.28 This study highlight that obesity in Europe is a serious disorder and reinforce the need for the development of effective healthy lifestyles programs, enhancing health literacy about this conditions. There is a need for a medical management approach of obesity, and shifts in public health policy. Even modest weight-loss (approximately 5% of initial weight) has been associated with important improvements in health and is likely to be associated with reduced costs to the health care system and society at large.
Acknowledgement
The author thanks Kurt J. Greenlund, from CDC, for his feedback and for revising the document.
References
1. Finucane MM, Stevens GA, Cowan MJ, Danaei G, Lin JK, Paciorek CJ, et al. National, regional, and global trends in body-mass index since 1980: systematic analysis of health examination surveys and epidemiological studies with 960 country-years and 9.1 million participants. Lancet. 2011;377(9765):557-67.
2. LST, HSCIC. Statistics on obesity, physical activity and diet: England 2015: Health and Social Care Information Centre; 2015.
3. Flegal K, Carroll M, Ogden C, Curtin L. Prevalence and trends in obesity among US adults, 1999-2008. Journal of the American Medical Association. 2010;303(3):235-41. Epub 2010/01/15.
4. Ng M, Fleming T, Robinson M, Thomson B, Graetz N, Margono C, et al. Global, regional, and national prevalence of overweight and obesity in children and adults during 1980-2013: a systematic analysis for the Global Burden of Disease Study 2013. Lancet. 2014;384(9945):766-81.
5. Pinto G, Beltran-Sanchez H. Prospective study of the link between overweight/obesity and diabetes incidence among Mexican older adults: 2001-2012. Salud Publica Mex. 2015;57 Suppl 1:S15-21.
6. Matsuo T, Sairenchi T, Suzuki K, Tanaka K, Muto T. Long-term stable obesity increases risk of hypertension. Int J Obes. 2011;35(8):1056-62. Epub 2010/11/03.
7. Mann DM, Lee J, Liao Y, Natarajan S. Independent effect and population impact of obesity on fatal coronary heart disease in adults. Prev Med. 2006;42(1):66-72.
8. Rapp K, Schroeder J, Klenk J, Stoehr S, Ulmer H, Concin H, et al. Obesity and incidence of cancer: a large cohort study of over 145,000 adults in Austria. Br J Cancer. 2005;93(9):1062-7.
9. Dixon JB. The effect of obesity on health outcomes. Mol Cell Endocrinol. 2010;316(2):104-8.
10. Withrow D, Alter DA. The economic burden of obesity worldwide: a systematic review of the direct costs of obesity. Obes Rev. 2011;12(2):131-41.
11. Tucker JM, Tucker LA, Lecheminant J, Bailey B. Obesity increases risk of declining physical activity over time in women: a prospective cohort study. Obesity. 2013;21(12):E715-20.
12. Brown CJ, Flood KL. Mobility limitation in the older patient: a clinical review. JAMA. 2013;310(11):1168-77.
13. Jensen GL, Hsiao PY. Obesity in older adults: relationship to functional limitation. Current opinion in clinical nutrition and metabolic care. 2010;13(1):46-51. 14. Börsch-Supan A, Brandt M, Hunkler C, Kneip T, Korbmacher J, Malter F, et al. Data resource profile: the Survey of Health, Ageing and Retirement in Europe (SHARE). Int J Epidemiol. 2013;42(4):992-1001.
15. WHO. Obesity: preventing and managing the global epidemic. Report of a WHO consultation. Beneva: World Health Organization; 2000.
16. Gupta S, Richard L, Forsythe A. The humanistic and economic burden associated with increasing body mass index in the EU5. Diabetes Metab Syndr Obes. 2015;8:327-38. Epub 2015/08/01.
17. Berghofer A, Pischon T, Reinhold T, Apovian CM, Sharma AM, Willich SN. Obesity prevalence from a European perspective: a systematic review. BMC Public Health. 2008;8:200. Epub 2008/06/07.
18. Gallus S, Odone A, Lugo A, Bosetti C, Colombo P, Zuccaro P, et al. Overweight and obesity prevalence and determinants in Italy: an update to 2010. Eur J Nutr. 2013;52(2):677-85. Epub 2012/05/31.
19. Lee I, Shiroma EJ, Lobelo F, Puska P, Blair SN, Katzmarzyk PT. Effect of physical inactivity on major non-communicable diseases worldwide: an analysis of burden of disease and life expectancy. Lancet. 2012;380(9838):219-29. Epub 2012/07/24.
20. Kohl HW, Craig CL, Lambert EV, Inoue S, Alkandari JR, Leetongin G, et al. The pandemic of physical inactivity: global action for public health. Lancet. 2012;380(9838):294-305.
21. Murtagh EM, Murphy MH, Murphy NM, Woods C, Nevill AM, Lane A. Prevalence and correlates of physical inactivity in community-dwelling older adults in Ireland. PloS one. 2015;10(2):e0118293.
22. Tremblay MS, Perez CE, Ardern CI, Bryan SN, Katzmarzyk PT. Obesity, overweight and ethnicity. Health Rep. 2005;16(4):23-34. Epub 2005/09/30.
23. Gadd M, Sundquist J, Johansson SE, Wandell P. Do immigrants have an increased prevalence of unhealthy behaviours and risk factors for coronary heart disease? Eur J Cardiovasc Prev Rehabil. 2005;12(6):535-41. Epub 2005/12/02.
24. Oliva-Moreno J, Gil-Lacruz A. Body weight and health-related quality of life in Catalonia, Spain. Eur J Health Econ. 2013;14(1):95-105. Epub 2011/08/20.
25. Konig HH, Lehnert T, Brenner H, Schottker B, Quinzler R, Haefeli WE, et al. Health service use and costs associated with excess weight in older adults in Germany. Age Ageing. 2015;44(4):616-23. Epub 2015/04/02.
26. Connor Gorber S, Tremblay M, Moher D, Gorber B. A comparison of direct vs. self-report measures for assessing height, weight and body mass index: a systematic review. Obes Rev. 2007;8(4):307-26. Epub 2007/06/21.
27. Ogden CL, Carroll MD, Kit BK, Flegal KM. Prevalence of childhood and adult obesity in the United States, 2011-2012. JAMA. 2014;311(8):806-14.
28. Wolfenstetter SB. Future direct and indirect costs of obesity and the influence of gaining weight: results from the MONICA/KORA cohort studies, 1995-2005. Econ Hum Biol. 2012;10(2):127-38. Epub 2011/10/11.
Tables
Table 1. Participants characteristics in 2011 and 2013.
All Mean or % (95% CI) p1 2005 (n=24356) 2007 (n=24508) 2011 (n=35428) 2013 (n=46903) Age (years) 64.9 (64.8, 65.0) 65.7 (65.6, 65.9) 66.6 (66.5, 66.7) 67.0 (66.9, 67.1) <0.001 Weight (kg) 74.8 (74.6, 75.0) 75.0 (74.8, 75.2) 75.3 (75.2, 75.4) 75.7 (75.5, 75.8) <0.001 Height (m) 1.68 (1.68, 1.68) 1.68 (1.68, 1.68) 1.68 (1.68, 1.68) 1.68 (1.68, 1.68) <0.001 BMI 26.5 (26.4, 26.5) 26.5 (26.4, 26.6) 26.6 (26.6, 26.7) 26.6 (26.6, 26.7) <0.001 BMI category Underweight Normal weight Overweight Obesity I Obesity II Obesity III 0.5 (-0.8, 1.7) 39.4 (38.5, 40.4) 42.5 (41.6, 43.5) 13.6 (12.5, 14.8) 2.9 (1.7, 4.1) 1.0 (-0.3, 2.2) 0.7 (-0.6, 1.9) 39.0 (38.1, 40.0) 42.2 (41.2, 43.1) 13.9 (12.8, 15.1) 3.3 (2.1, 4.5) 0.9 (-0.3, 2.1) 0.7 (-0.3, 1.7) 38.8 (38.0, 39.6) 41.3 (40.5, 42.1) 14.6 (13.7, 15.6) 3.5 (2.5, 4.5) 1.1 (0.1, 2.1) 0.6 (-0.3, 1.5) 39.1 (38.4, 39.8) 41.1 (40.4, 41.8) 14.5 (13.6, 15.3) 3.6 (2.7, 4.4) 1.1 (0.2, 2.0) <0.001 Men 2005 (n=11115) 2007 (n=11128) 2011 (n=15877) 2013 (n=21343) Age (years) 64.6 (64.4, 64.8) 64.6 (64.4, 64.8) 66.5 (66.4, 66.7) 67.2 (67.1, 67.3) <0.001 Weight (kg) 80.9 (80.7, 81.2) 81.5 (81.2, 81.7) 82.1 (81.9, 82.3) 82.5 (82.3, 82.7) <0.001 Height (cm) 1.74 (1.74, 1.74) 1.74 (1.74, 1.75) 1.75 (1.75, 1.75) 1.75 (1.75, 1.75) <0.001 BMI 26.7 (26.6, 26.7) 26.8 (26.7, 26.8) 26.9 (26.9, 27.0) 26.9 (26.9, 27.0) <0.001 BMI category Underweight Normal weight Overweight Obesity I Obesity II Obesity III 0.3 (-1.5, 2.2) 34.4 (32.9, 36.0) 49.2 (47.9, 50.5) 13.2 (11.5, 14.9) 2.2 (0.4, 4.1) 0.6 (-1.3, 2.4) 0.4 (-1.4, 2.3) 33.7 (32.2, 35.2) 48.7 (47.3, 50.0) 14.1 (12.4, 15.9) 2.6 (0.8, 4.5) 0.6 (-1.3, 2.4) 0.4 (-1.1, 2.0) 33.0 (31.7, 34.2) 47.6 (46.5, 48.8) 15.4 (14.0, 16.8) 2.9 (1.3, 4.4) 0.7 (-0.9, 2.2) 0.4 (-0.9, 1.8) 33.3 (32.2, 34.4) 47.9 (46.9, 48.9) 14.7 (13.5, 16.0) 2.8 (1.5, 4.1) 0.8 (-0.6, 2.1) <0.001 Women 2005 (n=13241) 2007 (n=13380) 2011 (n=19551) 2013 (n=25560) Age (years) 65.1 (65.0, 65.3) 65.7 (65.5, 65.9) 66.6 (66.4, 66.7) 66.9 (66.8, 67.0) <0.001 Weight (kg) 69.6 (69.4, 69.8) 69.6 (69.4, 69.8) 69.8 (69.6, 70.0) 70.0 (69.8, 70.1) 0.018 Height (cm) 1.63 (1.63, 1.63) 1.63 (1.63, 1.63) 1.63 (1.63, 1.63) 1.63 (1.63, 1.63) 0.009 BMI 26.4 (26.3, 26.4) 26.3 (26.2, 26.4) 26.4 (26.3, 26.4) 26.4 (26.4, 26.5) 0.098 BMI category Underweight Normal weight Overweight Obesity I Obesity II Obesity III 0.6 (-1.1, 2.3) 43.6 (42.4, 44.9) 36.9 (35.6, 38.3) 14.0 (12.4, 15.6) 3.5 (1.8, 5.1) 1.4 (-0.3, 3.0) 0.9 (-0.8, 2.6) 43.5 (42.2, 44.8) 36.8 (35.5, 38.2) 13.7 (12.2, 15.3) 3.8 (2.2, 5.5) 1.2 (-0.5, 2.9) 0.9 (-0.5, 2.3) 43.5 (42.5, 44.6) 36.1 (35.0, 37.2) 14.0 (12.7, 15.3) 4.0 (2.7, 5.4) 1.4 (0.0, 2.8) 0.8 (-0.4, 2.1) 43.9 (42.9, 44.8) 35.4 (34.5, 36.4) 14.3 (13.1, 15.4) 4.2 (3.0, 5.4) 1.4 (0.2, 2.6) 0.003 1
Table 2. Prevalence of high body mass index (overweight and obesity) of European adults aged 50 years or older by sex and age.
Overweight or Obese (BMI ≥25) % (95% CI) 2005 (n=24356) 2007 (n=24508) 2011 (n=35428) 2013 (n=46903) Change 2005 to 2013, point (95% CI) All 50-59 60-69 70-79 ≥80 Total 57.7 (56.4, 59.1) 64.0 (62.7, 65.4) 62.1 (60.4, 63.7) 51.3 (48.5, 54.1) 60.1 (59.3, 60.9) 57.1 (55.7, 58.5) 62.6 (61.3, 63.9) 64.7 (63.1, 66.2) 53.7 (51.2, 56.3) 60.3 (59.5, 61.1) 57.8 (56.5, 59.0) 62.9 (61.8, 64.0) 63.4 (62.1, 64.7) 55.1 (53.2, 57.0) 60.5 (59.9, 61.2) 57.3 (56.1, 58.4) 62.7 (61.7, 63.6) 62.5 (61.4, 63.6) 56.2 (54.6, 57.9) 60.3 (59.7, 60.9) -0.5 (-1.7, 0.8) -1.4 (-2.5, -0.3) 0.4 (-0.9, 1.7) 4.9 (3.0, 6.8) 0.2 (-0.4, 0.9) Men 50-59 60-69 70-79 ≥80 Total 65.5 (63.7, 67.4) 68.7 (66.9, 70.5) 64.0 (61.6, 66.4) 53.0 (48.5, 57.5) 65.2 (64.1, 66.3) 65.6 (63.7, 67.6) 68.7 (66.9, 70.5) 67.4 (65.3, 69.6) 53.9 (50.0, 57.9) 65.9 (64.8, 67.0) 67.1 (65.4, 68.7) 69.4 (68.0, 70.9) 67.3 (65.5, 69.0) 55.8 (52.8, 58.8) 66.6 (65.7, 67.5) 66.5 (65.0, 68.1) 69.6 (68.4, 70.9) 65.9 (64.4, 67.5) 56.8 (54.3, 59.3) 66.3 (65.5, 67.0) 1.0 (-1.0, 2.9) 0.9 (-0.8, 2.7) 1.9 (-0.3, 4.1) 3.8 (-0.1, 7.8) 1.0 (-0.1, 2.1) Women 50-59 60-69 70-79 ≥80 Total 51.2 (49.2, 53.2) 59.8 (57.9, 61.8) 60.4 (58.0, 62.7) 50.3 (46.7, 53.9) 55.7 (54.6, 56.9) 50.4 (48.4, 52.5) 57.3 (55.4, 59.3) 62.1 (59.9, 64.4) 53.6 (50.2, 56.9) 55.6 (54.5, 56.7) 50.7 (48.9, 52.5) 57.3 (55.7, 58.9) 60.0 (58.1, 61.8) 54.6 (52.1, 57.2) 55.6 (54.6, 56.5) 50.5 (48.9, 52.1) 56.4 (55.0, 57.8) 59.3 (57.7, 60.9) 55.8 (53.7, 58.0) 55.3 (54.5, 56.1) -0.7 (-2.7, 1.4) -3.4 (-5.4, -1.5) -1.0 (-3.3, 1.2) 5.5 (2.2, 8.8) -0.4 (-1.6, 0.7) Obese (BMI ≥30) All 50-59 60-69 70-79 ≥80 Total 17.4 (15.5, 19.3) 18.8 (16.8, 20.8) 17.6 (15.2, 20.0) 13.7 (10.0, 17.5) 17.5 (16.4, 18.7) 17.5 (15.5, 19.4) 19.4 (17.5, 21.4) 19.0 (16.6, 21.3) 14.3 (10.8, 17.8) 18.1 (17.0, 19.2) 18.3 (16.6, 20.1) 21.0 (19.4, 22.6) 20.4 (18.5, 22.3) 14.7 (12.0, 17.3) 19.2 (18.3, 20.2) 19.0 (17.4, 20.6) 20.5 (19.2, 21.9) 19.6 (17.9, 21.2) 15.3 (13.0, 17.5) 19.2 (18.4, 20.0) 1.6 (-0.2, 3.4) 1.7 (0.2, 3.3) 2.0 (0.1, 3.8) 1.5 (-1.2, 4.2) 1.6 (0.7, 2.6) Men 50-59 60-69 70-79 ≥80 Total 17.0 (14.2, 19.8) 17.2 14.3, 20.1) 14.8 (11.2, 18.5) 10.1 (3.9, 16.2) 16.0 (14.3, 17.7) 17.8 (14.8, 20.8) 18.9 (16.1, 21.8) 17.0 (13.6, 20.5) 11.0 (5.5, 16.5) 17.3 (15.6, 19.0) 19.3 (16.7, 21.9) 21.4 (19.0, 23.7) 18.9 (16.0, 21.7) 11.5 (7.2, 15.7) 19.0 (17.6, 20.4) 19.2 (16.8, 21.6) 20.6 (18.6, 22.6) 17.4 (15.0, 19.8) 12.2 (8.7, 15.7) 18.3 (17.1, 19.6) 2.1 (-0.9, 5.2) 3.4 (0.4, 6.3) 2.5 (-0.9, 6.0) 2.1 (-3.6, 7.9) 2.3 (0.6, 4.0) Women 50-59 60-69 70-79 ≥80 Total 17.7 (15.2, 20.3) 20.2 (17.5, 22.9) 20.0 (16.8, 23.3) 16.0 (11.3, 20.7) 18.8 (17.3, 20.3) 17.2 (14.5, 19.9) 19.8 (17.2, 22.5) 20.8 (17.5, 24.0) 16.6 (12.2, 21.1) 18.8 (17.2, 20.3) 17.6 (15.3, 19.9) 20.6 (18.5, 22.8) 21.7 (19.2, 24.3) 16.9 (13.5, 20.3) 19.5 (18.2, 20.7) 18.9 (16.8, 20.9) 20.5 (18.6, 22.4) 21.6 (19.4, 23.8) 17.6 (14.6, 20.5) 19.9 (18.8, 21.0) 1.2 (-1.6, 3.9) 0.3 (-2.4, 2.9) 1.5 (-1.7, 4.8) 1.5 (-3.0, 6.1) 1.1 (-0.5, 2.6)
Figure 1. Prevalence of high body mass index (overweight and obesity, BMI ≥ 25) for European adults aged 50 years or older by country.
53.9 56.0 67.4 58.0 59.0 64.0 60.3 55.0 59.6 62.9 60.3 53.4 58.0 70.5 58.7 63.8 63.6 58.9 54.2 60.7 61.6 60.5 51.7 57.1 73.6 56.1 64.6 63.3 56.1 54.1 61.1 64.9 60.3 51.9 55.0 70.9 58.1 63.3 62.5 57.6 53.0 61.0 63.0 60.1 0 10 20 30 40 50 60 70 80 90 100 Switzerland Sweden Spain Netherlands Italy Germany France Denmark Belgium Austria All countries 2005 2007 2011 2013
Figure 2. Prevalence of high body mass index (obesity, BMI ≥ 30) for European adults aged 50 years or older by country.
16.5 15.8 20.9 16.9 16.6 23.1 20.8 16.3 20.4 21.3 19.2 14.9 16.7 25.4 16.5 18.3 20.3 19.5 14.8 20.8 20.8 19.2 13.7 14.7 26.4 14.3 19.5 18.4 17.0 14.5 19.4 26.1 18.1 13.4 13.6 25.6 15.1 18.9 17.3 17.1 13.7 18.7 21.0 17.5 0 10 20 30 40 50 60 70 80 90 100 Switzerland Sweden Spain Netherlands Italy Germany France Denmark Belgium Austria All countries 2005 2007 2011 2013