BMW AG – Equity
Valuation
Dissertation submitted in partial fulfilment of requirements for the MSc in Business Administration, Major in Corporate Finance and Control, at Católica Lisbon School of Business and Economics
Author: João António Ferro da Costa
Nº 152112327
June 2015
Recommendation: BUY BMW AG, GR Equity Date: 31st December 2014 Price: 89,77€ Target Price: 108,77€ # Shares: 656,50 million Performance Credit Rating Moody’s: A+
Standard & Poor’s: A-
NATIXIS Valuation
Date: 15th December 2014 Target Price: 90€
Stock Price historical performance
Research Report
BMW Automotive Group
Bayerische Motoren Werke (BMW) is the leading company in the premium car and motorcycles manufacturing industry. It has been showing profitable and sustainable operations throughout the years, mostly as a result of good management decisions, like the implementation of Strategy NUMBER ONE, and constant efforts to keep technology and innovation at its best. With such sensitivity to macroeconomic effects, represented by a correlation of 0,93 with world’s GDP behavior, BMW is inserted in a highly competitive and volatile industry. Nevertheless, its constant product restructuration and the creation of new models, together with the powerful brand name, have been helpful for overcoming such obstacles like the latest financial crisis.
By presenting CAGR of 9,7% from 2009 to 2014, the company showed an outstanding ability to adapt to adverse situations, making one believe on its future success. The expectation of world’s economy stabilization and continuous growth in china, albeit no longer in double digits, provides BMW to keep growing in more moderate level, much like what is to happen with the industry itself, than what was registered in 2014, while still guaranteeing its leading position among its peers.
Valuation Methods
Discounted Cash Flows: DCF discounted at WACC is the main method used to value BMW’s common stock. An explicit period of five years was created, as a way to reflect the impact of economic stabilization in one’s projections. A CAGR of 5,8% was applied between 2014 and 2019, together with a perpetuity growth of 1%. WACC was computed as a function of cost of debt, equity and capital structure, that is to keep constant over the projection period, resulting in a value of 3,23%.
Multiples Approach: Used as a benchmark for DCF. A peer group was defined, taking into account growth, capital structure, profitability and risk. Two multiples were used, the EV/EBITDA and the P/E.
Financials 2015E 2016E 2017E
EBIT Margin 0,112 0,112 0,112 Growth rate 0,087 0,073 0,063 EPS 9,760 10,514 11,214 Multiples Ratio Po P/E 9,91 104,19 EV/EBITDA 8,83 118,66 Firm Value 139 028,20 Market Cap 71 409,21 Po 108,77 DCF 0 0,5 1 1,5 2 20 07 20 08 20 09 20 10 20 11 20 12 20 13 20 14
Financials
The automotive segment has been and will keep on being the most important business area for the group in what sales are concerned. Assumptions about this account are undoubtedly the most relevant and with most impact on the final price.
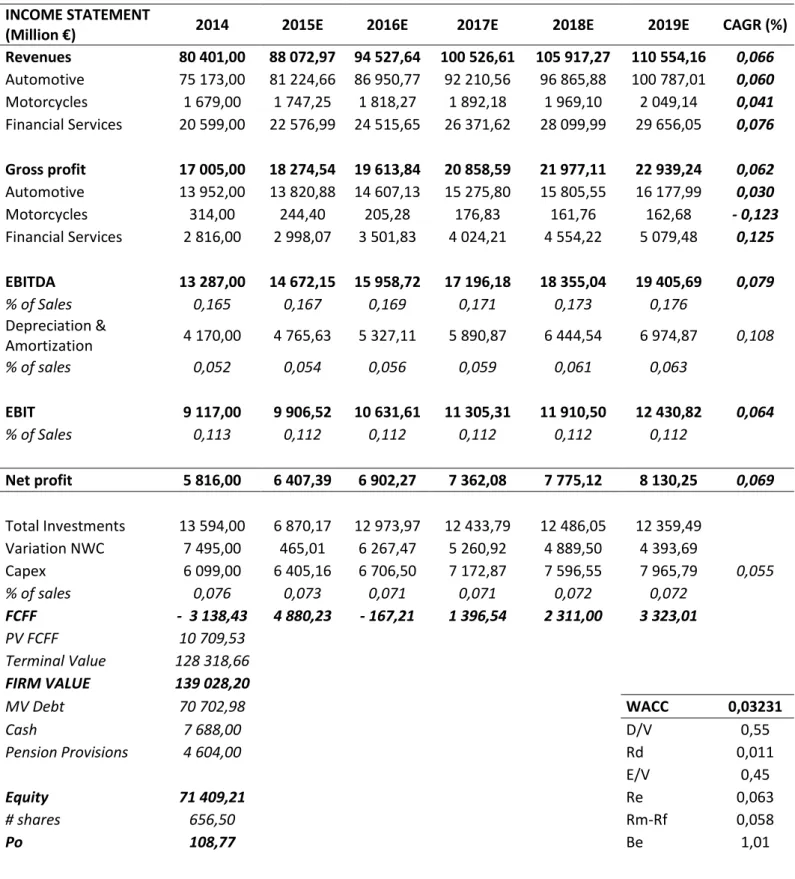
Table 1 - Financials analysis and forecast INCOME STATEMENT
(Million €) 2014 2015E 2016E 2017E 2018E 2019E CAGR (%) Revenues 80 401,00 88 072,97 94 527,64 100 526,61 105 917,27 110 554,16 0,066 Automotive 75 173,00 81 224,66 86 950,77 92 210,56 96 865,88 100 787,01 0,060 Motorcycles 1 679,00 1 747,25 1 818,27 1 892,18 1 969,10 2 049,14 0,041 Financial Services 20 599,00 22 576,99 24 515,65 26 371,62 28 099,99 29 656,05 0,076 Gross profit 17 005,00 18 274,54 19 613,84 20 858,59 21 977,11 22 939,24 0,062 Automotive 13 952,00 13 820,88 14 607,13 15 275,80 15 805,55 16 177,99 0,030 Motorcycles 314,00 244,40 205,28 176,83 161,76 162,68 - 0,123 Financial Services 2 816,00 2 998,07 3 501,83 4 024,21 4 554,22 5 079,48 0,125 EBITDA 13 287,00 14 672,15 15 958,72 17 196,18 18 355,04 19 405,69 0,079 % of Sales 0,165 0,167 0,169 0,171 0,173 0,176 Depreciation & Amortization 4 170,00 4 765,63 5 327,11 5 890,87 6 444,54 6 974,87 0,108 % of sales 0,052 0,054 0,056 0,059 0,061 0,063 EBIT 9 117,00 9 906,52 10 631,61 11 305,31 11 910,50 12 430,82 0,064 % of Sales 0,113 0,112 0,112 0,112 0,112 0,112 Net profit 5 816,00 6 407,39 6 902,27 7 362,08 7 775,12 8 130,25 0,069 Total Investments 13 594,00 6 870,17 12 973,97 12 433,79 12 486,05 12 359,49 Variation NWC 7 495,00 465,01 6 267,47 5 260,92 4 889,50 4 393,69 Capex 6 099,00 6 405,16 6 706,50 7 172,87 7 596,55 7 965,79 0,055 % of sales 0,076 0,073 0,071 0,071 0,072 0,072 FCFF - 3 138,43 4 880,23 - 167,21 1 396,54 2 311,00 3 323,01 PV FCFF 10 709,53 Terminal Value 128 318,66 FIRM VALUE 139 028,20 MV Debt 70 702,98 WACC 0,03231 Cash 7 688,00 D/V 0,55 Pension Provisions 4 604,00 Rd 0,011 E/V 0,45 Equity 71 409,21 Re 0,063 # shares 656,50 Rm-Rf 0,058 Po 108,77 Be 1,01
It is assumed that product life cycle will keep on increasing sales for the next year, given the most recent model lines created and product restructuration in late 2013. Sales are to increase by 8% in 2015 and smoothed until GDP values in 2019. Furthermore, it is believed that further restructuration is to be kept, reason why capital expenditures are to represent around 7% of sales, as expected by the group. As a consequence, Depreciation and Amortization are to follow the same trend.
Table 2 - Peer Group
Company EV/EBITDA P/E Ratio
VOLKSWAGEN AG 6,44 8,25
TOYOTA MOTOR CORP 8,83 10,13
DAIMLER AG-REGISTERED SHARES 10,62 10,59
NISSAN MOTOR CO LTD 7,65 9,91
RENAULT SA 9,74 8,75
Peer Group Median 8,83 9,91
Table 3 - Multiples Valuation Output
BAYERISCHE MOTOREN WERKE AG EV/EBITDA 2Yr Forward EV/EBITDA P/E Ratio 2Yr Forward P/E Ratio
Peer Ratio 8,83 8,83 9,91 9,91
Critical Factor 13 287,00 15 958,72 5 816,00 6 902,27
# Shares 656,50 656,50 656,50 656,50
Price 82,73€ 118,66€ 87,79€ 104,19€
Peer group was computed by the application of five different approximations: top twenty companies by sales volume according to Bloomberg, Return on Invested Capital to control for profitability, Capital Structure, EBITDA growth and Raw Beta to account for risk. Two year forward multiples are used as a way to cut the error from the median of the peer group by 16%.
This valuation model, which yields an average price of 111,43€, supports the result from the DCF valuation and the statement that the market has been undervaluing BMW’s stocks.
Abstract
Title: Bayerische Motoren Werke’s Valuation
Author: João António Ferro da Costa
The main goal of this master thesis to is compute the most accurate common share price for Bayerische Motoren Werke (BMW) at the date of 31st December 2014. For that, a review of relevant literature was done to find the Discounted Cash Flows valuation model, with the Weighted Average Cost of Capital (WACC) as the discount rate, as the most commonly used and appropriate to be applied for such purpose.
With a WACC of 3,23%, the result was market capitalization of 71 409,21 million Euros and price per share of 108,77€. The multiples approach was also used both as a benchmark that confirmed the results of the mentioned valuation and as a means of proving the group’s over performance when compared to its most relevant peers.
This makes one believe that BMW is being undervalued by the market, given a price at time of valuation of 89,77€, making it a good investment opportunity. A “BUY” recommendation is the result of this master thesis, taking into consideration that macroeconomic effects may have significant influence. Nevertheless, it is expected that only with either a decrease in perpetuity growth rate of 18,5% or an increase in WACC of 7,7% will the above statement not hold. Also, it is believed that with a 95% confidence level, price per share of BMW will not go below 100,39€.
Acknowledgments
The execution of this Master thesis has been of greatest importance to me, as it enabled me to improve my knowledge and expertise in the field of Equity Valuation.
For that, I would first like to thank Professor José Carlos Tudela Martins for all his help, availability and guidance throughout the process.
Finally, I would like to dedicate this dissertation to all my friends and family, who were always available to support and motivate me in every step and stage of such important project.
Contents
Research Report ... i BMW Automotive Group ... i Valuation Methods ... i Financials ... ii Abstract ... iv Acknowledgments ... v Introduction ... 1Research question and sub-research questions ... 2
Literature Review ... 3
Discounted Cash Flows Model ... 4
Free Cash Flows ... 5
Weighted Average Cost of Capital ... 6
Cost of Equity ... 7
Cost of Debt ... 9
Terminal Value ... 9
Limitations of the DCF model ... 10
Relative Valuation Models ... 11
Price to Earnings Ratio ... 12
Price to Book Ratio ... 13
Revenue Multiples ... 14
Enterprise Value Multiples ... 15
Conclusion ... 16
The Industry ... 17
Automotive Sector ... 20
Motorcycles Sector ... 21
Financial Services Sector ... 22
The stock markets ... 23
Commodity risk ... 24
Currency risk ... 25
Valuation ... 27
Forecasting the Income Statement ... 27
Automotive Revenues ... 27
Motorcycle Revenues ... 28
Financial Services ... 29
Cost of Goods Sold ... 30
Research and Development ... 31
Selling and administrative costs ... 32
Other Operating Income and expenses ... 32
Taxes ... 33
Discounted Cash Flows ... 33
Capital Expenditures, PP&E and Depreciation and Amortization ... 33
Net Working Capital Changes ... 35
Impairment Losses ... 37
Weighted Average Cost of Capital ... 38
Output ... 40
Relative Valuation ... 42
Peer Group ... 42
Multiples ... 43
Value at Risk ... 47
Investment bank report comparison ... 49
Conclusion ... 52
Appendix ... 53
Appendix 1 – Additional Literature ... 53
Adjusted Present Value ... 53
Dividend Discount Model ... 55
Gordon Growth Model ... 56
Two-stage Growth Model ... 57
Option Pricing Model ... 58
Economic Value Added ... 59
Economic Profit ... 59
Valuation on emerging markets ... 60
Appendix 2 – Forecast Assumptions ... 60
Appendix 3 – Forecasted Income Statement ... 72
Appendix 4 – Discounted Cash Flows ... 75
Appendix 5 – Weighted Average Cost of Capital ... 76
Appendix 6 – Centroids Output ... 77
Appendix 7 – Multiples ... 77
Appendix 8 – Financials comparison ... 78
Appendix 9– GDP performance ... 79
Appendix 10 – Industry composition for Correlation analysis (Sales Volume) ... 79
Nomenclature ... 80
Introduction
Valuation is known as the action of determining the economic value of a specific asset or company. The perception of value is acknowledged as a relevant management technique and is becoming more and more important. For that, the purpose of this Master Thesis is to find the value per share of the BMW group, at the 31st of December 2014.
As there is no common consensus on what is the best valuation technique to be used to value such company, a presentation of relevant literature is initially done to review the different approaches and its advantages. Valuable inputs are considered from several public and leading articles on the subject to help one choosing the best model to be used.
There is also the need to understand what the conditions of the surrounding environment of BMW are. Whilst having recovered from the past financial crisis and keeping to break new sales records all over the world, the company is competing in the very competitive market of premium cars and motorcycles, with several players and threats that need to be taken into account. Factors like the uncertainty of emerging markets, economic conditions and raw materials are drivers for the performance of the industry and are further explained by an industry analysis and presentation of the company.
After choosing the DCF method discounted at the rate of WACC and the multiples approach as the most suitable, the result is a target stock price that one believes to reflect future expectations about the company. Nevertheless, a sensitivity analysis is done, in order to find a suitable range of values between which the price is expected to fluctuate and the Value at Risk approach is applied to find the maximum weekly loss for one that is considering BMW as a possible investment.
The last step is a comparison to the valuation of a leading investment bank, NATIXIS, is done, where the most relevant differences in valuation models, assumptions and results are discussed.
Research question and sub-research questions
“By applying a fundamental analysis to BMW, what is the fair value of its stock as of 31st December 2014 and how is it compared to the value perceived by the market?”
To find the correct answer to the presented research question, three defined sub-questions are presented and answered in different sections throughout this dissertation, as a way to better structure the ideas behind the valuation.
a) What are the main macroeconomic effect and external drivers for BMW and its industry?
b) What are the future expectations for the industry and how will BMW perform financially?
c) What are the most suitable valuation approaches and their sensitivity to changes on main assumptions?
Literature Review
The valuation of a project, a strategic partnership or, as in the case of this dissertation, of a company, has not only become a prerequisite for any manager who wants to have significant impact in a company, but also the financial competency that today’s managers want to learn and master.
(Luehrman, 1997a) states that the way a company makes its estimations on the value of any decision process is of most importance to how it allocates its resources, which makes it a key driver for the overall performance of the business. In that sense, the way it distributes its resources has, as its foundation, a set of calculations to compute the value added from each move.
However, according to (Young et al., 1999), there are a whole lot of new methods and theories coming every year that is converging to a point of overload. This constitutes a problem, as the more approaches we use on our assets, the weaker the result of our analysis will be. By having different mathematical basis, they may very likely produce different or even contradictory valuations.
(Luehrman, 1997a) states that in order to value their opportunities all managers now tend to apply the same basic models to all problems. Also, their valuation and assumptions should be based on three main principles: risk, timing and cash. Furthermore, if we take into consideration that the existing models are just a different approach to value the same underlying, it should be safe to say that, using similar assumptions, we should be able express one in terms of any other (Young et al., 1999).
(Damodaran, 2002) uses a much more practical approach to this topic, by stating that there are three different ways to valuation: Discounted Cash Flows (DCF), that expresses the value of an asset as a function of the present value (PV) of the future expected cash flows; Relative Valuation, that tries to make an estimation to the value of an underlying, by using the price of similar assets in the active market using analogous variables such as earnings, cash flows book values or sales; and Contingent Claim that is focused on assets that share option characteristics and uses option pricing models.
This section tries to summarize the most well-known models that are to be used for valuing the BMW group. More relevant literature can be found referenced in appendix 1.
Discounted Cash Flows Model
The DCF valuation, invented in the 1970’s, came as the model to be used in any corporate asset valuation process (Luehrman, 1997a). According to (Goedhart et al., 2005), managers gravitate toward DCF analysis as the most accurate and flexible valuation method for any project, division or company. The DCF model is a valuation used to estimate the attractiveness of any investment opportunity. It is based on the PV of the future expected cash flows that will flow to the entity by a specific project (Luehrman, 1997a). The computation of these values goes according to the formula:
Equation 1 – Discounted Cash Flows
Where:
n = life of the asset
CFt = Cash Flow in period t
r = Discount rate that reflects the risk of the estimated cash flows
(Luehrman, 1997a) also explains that one specific version of the DCF model came to be the standard. In order to get to the market value of a business one should discount the future expected cash flows, more specifically the free cash flows to the firm (FCFF) using the weighted average cost of capital (WACC). This should be the same as saying that it is the value of debt plus the one of shareholder’s equity (Fernandez, 2013).
Herewith, we should get to an approximation (or exact, if the calculations are done with extreme precision) of the market value of the firm. Because we are talking about forecasting expected cash flows, it is also safe to say that we cannot estimate all the values until infinity, meaning that we will have to consider two different growth stages. That is why one needs to add the terminal value to the formula, which is going to be explained below and as shown in the formula.
𝑉𝑎𝑙𝑢𝑒 = 𝐶𝐹𝑡
(1 + 𝑟)𝑡 𝑡=𝑛
Equation 2 - Firm Value by Discounted Cash Flows
(Damodaran, 2002) states that the FCFF represent the remaining cash flows after considering all operating expenses, reinvestment needs and taxes, but excluding both the impacts of equity and debt holders.
The DCF valuation represents only one of the three most used methods and it is on the basis for any other model used for valuation, being the most used one in the real world the ones based in Relative Valuation. In this valuation, the objective is to try to find the intrinsic value of an asset, based on its fundamentals. This can be defined as the actual value of a company or an asset based on the causal perception of its true value that includes all features of the business.
It is the correct estimation of the future expected cash flows but also considering the correct discount rate associated with them with absolute precision. Furthermore, it can be expected that the result determined by these computations will differ from the prices in the market, as the markets tend to make mistakes. However, it is also safe to assume that sooner or later both values will converge (Damodaran, 2002).
Free Cash Flows
FCFF can be defined as a measure of performance that is based on the net amount of cash generated by a company, including expenses, taxes and variations of working capital and investments for the year.
Equation 3 – Free Cash Flows to the Firm
Depreciation is considered to be a cost and is included in the financial statements of a company, but it is not a cash expense. However, its value still needs to be considered for tax purposes. This is why we use EBIT (1 - t) and add up the value of depreciation again. This is
𝑉𝑎𝑙𝑢𝑒 𝑜𝑓 𝑡ℎ𝑒 𝐹𝑖𝑟𝑚 = 𝐹𝐶𝐹𝐹𝑡 (1 + 𝑊𝐴𝐶𝐶)𝑡 𝑡=𝑛 𝑡=1 +𝑇𝑒𝑟𝑚𝑖𝑛𝑎𝑙 𝑉𝑎𝑙𝑢𝑒 (1 + 𝑊𝐴𝐶𝐶)𝑡 𝐹𝐶𝐹𝐹 = 𝐸𝐵𝐼𝑇 1 − 𝑡 + 𝐷𝑒𝑝𝑟𝑒𝑐𝑖𝑎𝑡𝑖𝑜𝑛 − 𝐶𝐴𝑃𝐸𝑋 − 𝛥𝑊𝐶𝑁
also valid for all other non-cash expenses that the company might have. FCFF can also be described as the cash available to pay the company’s suppliers (Pinto, 2010), thus all the expenditures that are crucial to keep the business running in a productive manner need to be deducted, even if they are not considered as core activities, again because they do not represent available cash. As an example we have the impact of accounts receivable/payable. (Pinto, 2010) also states that Free Cash Flows to the Equity (FCFE) are another type of free cash flow. It is the cash available to pay all the common equity holders after interest, principal payments and expenses have been paid and necessary investments in working capital (WC) and fixed capital have been made. It is also possible to get to FCFE from FCFF:
Equation 4 – Free Cash Flows to the Equity
The advantage of using one of these two types of free cash flows is that they are a possibility for DCF models when one is trying to analyze either the market value of a company, with FCFF discounted at WACC, or the market value of Equity, with FCFE discounted at the required rate of return on equity.
The author also states that there can be reasons for preferring one kind of cash flow over the other. If we are talking about a relatively stable capital structure, FCFE is more direct and simpler to use. If we are facing a levered company with a negative FCFE, however, FCFF should be more effective on valuing the entire company or its equity. Furthermore, if talking about a company with a history of leverage changes, it is easier to accept a growth rate applied to FCFF than to FCFE.
Weighted Average Cost of Capital
According to (Luehrman, 1997a), WACC is nothing more than an opportunity cost that represents the return that any company could expect to get from other investments with the same risk characteristics. Opportunity cost is based on time value, the return on a nominal risk-free investment for not using your money in other riskier moves. It also includes a risk premium effect, which reflects the extra risk we are referring to and that the user might be willing to bear, according to its profile. Also, WACC tries to get the effect of tax advantages
related to borrowing money. It is a tax-adjusted discount rate that adds this effect by picking up the value of interest tax shields (ITS) associated with the debt level of the user.
(Damodaran, 2002) states WACC is the cost of capital resulting from the different ways of financing used by the firm, weighted by their market value proportions. Being the result of a combination between the cost of capital and the required rate of return on capital, referring to this measure as a “cost of capital” can be misleading, as it is not just a cost (Fernandez, 2013). (Luehrman, 1997a) explains that both cost of debt and cost of equity are opportunity costs that include time value and its own risk premium. However, WACC also considers the capital structure of the company and the adjustment for the tax effect, by deducting its absolute value. Needless to say that this assumption contributes for reducing the value of WACC, increasing the PV of future expected cash flows, when compared with a non-tax adjusted opportunity cost.
Equation 5 – Weighted Average Cost of Capital
As we can see, the cost of debt, Rd, is weighted by its respective level of debt on the overall market value of the company, D/V, and deducted by the effect of taxes. This feature of WACC is based on the restrictive assumption that the values of the ITS are computed with precision (Fernandez, 2013). The same happens with the required return of equity, Re, that is weighted by its level of equity on the overall market value of the company.
Finally, according to (Goedhart et al., 2010), the weight of cost of debt and cost of equity, for mature companies, should be computed using the company’s current debt-to-value ratio, with market values of debt and equity, as this represents an approximation of its target capital structure.
Cost of Equity
The cost of equity represents, in financial theory, the return that the stockholders require for a company. According to (Goedhart et al., 2010) it can be computed having in mind three main factors, that go accordingly to the foundations of the Capital Asset Pricing Model (CAPM), which represents the most commonly used model for the estimation of this cost. It has been
𝑊𝐴𝐶𝐶 = 𝐷
𝑉∗ 𝑅𝑑 ∗ 1 − 𝑇 + 𝐸 𝑉∗ 𝑅𝑒
the most commonly used and has become the standard in real-world analyses of risk and return (Damodaran, 2002).
The CAPM differs from other models, like the Fama-French three-factor model or the Arbitrage Pricing Theory model (APT), for the way it defines risk. The model tries to define risk having in mind its sensitivity to the stock market. It takes into consideration the risk-free return rate (rf), the market risk premium, that represents the difference between the expected return on a market portfolio (Rm) and the return on riskless bonds and is common to all companies, and the risk of each company relative to the average company (βi) (Goedhart et al., 2010).
CAPM can be expressed according to the following equation: Equation 6 – Capital Asset Pricing Model
There are also four assumptions that need to be taken into account: first, the existence of transaction costs is excluded. Second, every underlying can be traded. Then, investments are infinitely divisible, meaning that anyone can purchase a small fraction of a unit of the underlying. Finally, it is assumed that the market is perfect and that there is no asymmetry of information, thus investors are not able to find any under or overvalued assets in the marketplace (Damodaran, 2002).
The presence of beta in the equation is what enables the model to adjust for the company-specific risk, measuring asset’s price movement relative to the market and representing to what extent the portfolio of the investor is diversified. This means that companies with a high risk relative to the market will present excess returns that exceed the market risk premium and that companies with low betas will present the opposite effect (Goedhart et al., 2010). Also, when computing values like β, a critical analysis must be made when results are presented. As an example, both the industry average and historical data are many times used to compute this parameter. However, the value presented can be so big or so small, due to the high variation that can happen driven by the different time period used for the computation, that goes against common sense (Fernandez, 2004).
Cost of Debt
Cost of debt represents the effective rate that a company has to pay for its current debt. However, it is normally computed in after-tax basis, since the interest payments represent a tax-deductible expense. Also, for the computation of WACC, we need to take into consideration de after-tax cost of debt. (Goedhart et al., 2010) states that there are different ways of computing this cost, according to the different types and stages of companies we are analyzing.
When analyzing firms with publicly traded debt, one should consider the cost of debt to be equal to the Yield to Maturity (YTM), computed by the PV of the bond’s price and the promised future cash flows (Goedhart et al., 2010). If considering a company that does not trade its debt very often, the company’s debt rating should be used to make a more accurate estimation of the YTM, using the company’s marginal tax rate to keep cost of debt in an after-tax basis.
Also, if analyzing an investment-grade firm, which represents a company with relatively low probability of default, one should consider the YTM of the long-term, option-free bonds as its cost of debt, again using an after-tax basis. Finally, if the firm is not rated, a good estimate should be the computation of the interest coverage ratio, which gives more emphasis on the borrowings incurred in a recent past (Damodaran, 2001).
Equation 7 – Interest Coverage Ratio
The YTM, however, can lead to an inconsistent enterprise valuation, as we are using a promised rate of return for a company’s debt, assuming that all coupons and debt are fully paid and on time. Thus, while considering expected future cash flows one should also use an expected rate of return as the discount rate. YTM then represents only a good proxy for the cost of debt.
Terminal Value
The terminal value represents an expectation for how the growth of a company will be in perpetuity. In a DCF valuation, analysts normally consider a specific amount of years at their choice for individual annual forecasts and the terminal value (Young et al., 1999).
𝐼𝑛𝑡𝑒𝑟𝑒𝑠𝑡 𝐶𝑜𝑣𝑒𝑟𝑎𝑔𝑒 𝑅𝑎𝑡𝑖𝑜 =𝐸𝑎𝑟𝑛𝑖𝑛𝑔𝑠 𝐵𝑒𝑓𝑜𝑟𝑒 𝐼𝑛𝑡𝑒𝑟𝑒𝑠𝑡𝑠 𝑎𝑛𝑑 𝑇𝑎𝑥𝑒𝑠 𝐼𝑛𝑡𝑒𝑟𝑒𝑠𝑡 𝐸𝑥𝑝𝑒𝑛𝑠𝑒
As the years go by, it becomes harder and harder to predict the growth of a company. Will it maintain high growth? Will it start growing at a slower rate that will match the one in which the economy will operate? This second possibility is what is called as stable growth that can be sustained in perpetuity, allowing for an estimation of all the future cash flows beyond the point where the computation of the terminal value begins (Damodaran, 2002).
The author also states that there are three different ways of computing the terminal value: Assuming a liquidation value for the firm’s assets in the terminal value and determining what would be the potential payment from other for those assets; applying a multiple to earnings, revenues or book value to estimate the terminal value; and assuming that the FCFF will grow at a constant rate in perpetuity, as stated earlier. According to (Young et al., 1999), this specific method of computing the terminal value goes as follows:
Equation 8 – Terminal Value
The author also states that these two last methods are more focused in valuing the firm on a going concern basis at the time of estimation of the terminal value.
Limitations of the DCF model
Despite being the most used and well know firm valuation method, the DCF also comes with limitations, mainly about its assumptions and potential for errors in its computation.
(Damodaran, 2002) explains that DCF valuation is much based on expected cash flows and discount rates. Having this in mind, the approach becomes the easiest to use for companies that present positive cash flow, which can be forecasted with reliability. As we get further from this idealized setting, the harder the valuation becomes.
Also, the author believes that there is a lot of information about a company’s assets that is not shared with analysts and assumptions need to be made. This means that the intrinsic value we are computing by using DCF might not be the true intrinsic value needed for a precise valuation. (Luehrman, 1997a) complements that the problem increases with the presence of WACC in the equation. This type of discount factor is only suitable for companies with
𝑇𝑒𝑟𝑚𝑖𝑛𝑎𝑙 𝑉𝑎𝑙𝑢𝑒 =𝐹𝐶𝐹(𝑛 + 1)
simple and static capital structures. The more complicated the capital structure, tax position or funding policy, the more likely it is for mistakes to happen.
One of the precautions we must have is to carefully make adjustments not only project by project, but also period by period. Furthermore, (Luehrman, 1997b) argues that WACC has never been the best at introducing financial effects into the equation, unless when considering simple capital structures.
Finally, (Fernandez, 2013) also states that there is a set of variables, misconceptions and errors that come with the use of WACC. One example is the fact that the computation of this discount factor is fairly dependent on a correct valuation of tax shields, which are highly dependent on the debt policy of the company and, consequently, its capital structure. Unless it is fixed, harder will it become to forecast the appropriate discount rate and its impact on the accounts of the company.
Relative Valuation Models
As it has been explained, the concept of valuation is much reliant on estimating key ingredients of firm value, such as Return on Invested Capital (ROIC), growth and WACC, that if misinterpreted can lead to errors in valuation or strategic moves. It is then believed that Multiples can be helpful in creating a fair proxy to such forecasts (Goedhart et al., 2005). Relative Valuation provides an opportunity to value the overall company or its assets upon the similarity to others priced in the market (Damodaran, 2005). It is of course necessary to only take into consideration companies with similar expectations for the key components used. If done right, the valuation can even make one conclude about the expectations of the market or industry the asset is in (Goedhart et al., 2005). Additionally, if markets are pricing assets right, both DCF and Multiples valuation should congregate to the same values. The opposite can happen as well, if the market is overpricing or underpricing assets of a given industry (Damodaran, 2005).
(Damodaran, 2005) also states that there are three main steps to be followed when using relative valuation models: The first is to find comparable assets, also called peer group, that are priced in the market. Companies that are from the same sector as the one being analyzed are many times considered as a comparable, but that doesn’t mean they are appropriate. The underlying assumption here made is that companies from the same industry are similar in terms of risk, growth and cash flows, meaning that they can be compared. (Liu et al., 2002)
agrees with this idea, by stating that having a peer group composed by companies from the same sector should result in a more reliable valuation.
However, it becomes difficult to implement when there is a relatively small amount of firms in the same sector. Then, as assets tend to be different in terms of size or units, the need for standardization arises. It is the process of turning market prices into variables that can be compared. In the case of stocks, the process normally means turning market values of equity or firm to multiples like earnings, revenues or book value or to measures that are a particular attribute of firms in the same industry. The last step is to analyze and validate data. Again, the different attributes in comparable companies should yield different multiples. As an example, a company with a higher growth rate should return higher multiples than one with a lower rate in the same sector.
Moreover, (Goedhart et al., 2005) supports that, based on empirical evidence, multiples should have in their foundation forecasts, rather than historical values or, if not possible, to be based in the latest values available, in order to exclude one-time events.
Another characteristic of this valuation model in question is that different sectors should be more effectively valued by different multiples. (Fernandez, 2001) has come to the conclusion that in the sector of investment banking, P/E and EV/EBITDA ratios are the most common and effective employed. (Damodaran, 2005), on the other hand considers that EV/EBITDA is most suitable to companies with heavy infrastructure, like cable or telecom, and price to book ratios more common in financial services.
As a complement, we shall present and describe the most commonly used multiples. Price to Earnings Ratio
The Price to Earnings Ratio (PER), is considered to be the most commonly used multiple. Its attractiveness comes from its simplicity on relative valuations or even on pricing initial public offerings (IPO) (Damodaran, 2002). However, the author also states that there are some complications relating to its proximity to the company’s financial structure and variations on earnings. (Goedhart et al., 2005) complements this statement, by identifying two main flaws to the ratio: First, the fact that it is dependent on capital structure, meaning that given the impact of leverage, managers can intentionally increase PER, by replacing debt with equity. Then, the fact that it is based on earnings, which means it may be including one-time events such as write-offs, and other non-operating items. PER can be computed by:
Equation 9 - Price to Earnings Ratio
(Koller et al., 2012) summarizes that a company that is fully financed by equity should show different PER results than one financed partially with debt. The one with higher debt should
show lower PER, having in mind the ceteris paribus assumption.
One also needs to take into account that PER is not suitable for companies with negative earnings. Thus, seasonable companies should not be valued according to this ratio (Damodaran, 2002).
Price to Book Ratio
Many investors have taken their time to better analyze the Price to Book Ratio (PBR). It is believed that stocks that are being traded at a lower price than the book value of equity can be considered as great candidates for undervalued portfolios and vice-versa (Damodaran, 2002). The author also presents many reasons why the ratio has been so useful. First, looking at book values gives a more stable and intuitive perspective of the company that can then be compared with market values. Second, given the consistency and effort of the accounting standards to ensure comparability across firms, a better proxy is provided for signs of under or over valuation. Third, as there are far fewer companies that present negative book values than firms that present negative earnings, the PBR can be used more often, including to value firms that cannot be valued by the PER. The computation of the ratio goes as follows:
Equation 10 - Price to Book Ratio
There are also some disadvantages that need to be considered, according to (Damodaran, 2002). To begin, some book values, as the example of earnings, can also be affected by accounting rules, such as the ones for depreciation or other measures. When the accounting standards used are different across companies, or even across countries, PBR can become insignificant. Then, PBR also becomes useless when comparing companies that do not have significant tangible assets, as the example of services or technology firms. Finally, reporting
𝑃𝐸𝑅 =𝑀𝑎𝑟𝑘𝑒𝑡 𝑃𝑟𝑖𝑐𝑒 𝑝𝑒𝑟 𝑠ℎ𝑎𝑟𝑒 𝐸𝑎𝑟𝑛𝑖𝑛𝑔𝑠 𝑝𝑒𝑟 𝑠ℎ𝑎𝑟𝑒
𝑃𝐵𝑅 =𝑀𝑎𝑟𝑘𝑒𝑡 𝑉𝑎𝑙𝑢𝑒 𝑜𝑓 𝐸𝑞𝑢𝑖𝑡𝑦 𝐵𝑜𝑜𝑘 𝑉𝑎𝑙𝑢𝑒 𝑜𝑓 𝐸𝑞𝑢𝑖𝑡𝑦
negative earnings over many years, can also lead to negative book values of equity and consequent negative values of PBR.
Revenue Multiples
The basic concept about revenue multiples is to translate the relation between the value of a business and the revenues it provides. In this case, firms with higher value for revenue ratio should be better priced in the market than companies with lower ratio.
(Damodaran, 2002) presents three reasons why sales multiples are attractive to investors as proxies for valuation: They can never be negative, even for young or distressed firms, as it happens with both ratios presented above. This way, it may not be needed to eliminate companies from the sample of comparable companies; they are hardly manipulated, as they are not so dependent on accounting rules and decisions; when talking about cyclical firms, for example, revenue multiples are much more effective, as they are less affected by changes in the economy than earnings multiples.
(Damodaran, 2002) also states that there are two main multiples presented in this category. The first is the most simple and popular that establishes the relationship between market value of equity and revenues of a firm and is called price to sales ratio.
Equation 11 - Price to Sales Ratio
The second is seen as more robust and relates the enterprise value of a firm, which includes debt and equity in market values, and revenues.
Equation 12 - Enterprise Value to Sales Ratio
Again, there are some disadvantages to these multiples. Even though accounting principles for revenues are much similar across different industries, there have been cases of companies that
𝑃𝑟𝑖𝑐𝑒 𝑡𝑜 𝑆𝑎𝑙𝑒𝑠 𝑅𝑎𝑡𝑖𝑜 =𝑀𝑎𝑟𝑘𝑒𝑡 𝑉𝑎𝑙𝑢𝑒 𝑜𝑓 𝐸𝑞𝑢𝑖𝑡𝑦 𝑇𝑜𝑡𝑎𝑙 𝑆𝑎𝑙𝑒𝑠
𝐸𝑉 𝑡𝑜 𝑆𝑎𝑙𝑒𝑠 𝑅𝑎𝑡𝑖𝑜 =𝐸𝑛𝑡𝑒𝑟𝑝𝑟𝑖𝑠𝑒 𝑉𝑎𝑙𝑢𝑒 𝑇𝑜𝑡𝑎𝑙 𝑆𝑎𝑙𝑒𝑠
use questionable methods for reporting sales, in order to increase their ratios. Likewise, using revenue multiples can lead to misleading and incorrect conclusions.
Assessing high values because revenues are high can mean excluding many other important measures of performance like costs and profit margins. Eventually, companies can be generating negative earnings and cash flows, that are of most importance when valuing a company (Damodaran, 2002).
Enterprise Value Multiples
Enterprise value multiples are seen as valuable solution for firm valuation, as they are not troubled by the same biases as the ones presented for earnings multiples (Koller et al., 2012). The author also states that they represent a viable solution especially for investors and bankers that want to compare companies in the same sector.
Enterprise Value to EBITDA has been the most used alternative as a multiple and can be computed as follows:
Equation 13 - Enterprise Value to EBITDA ratio
As Earnings before Interest, Taxes, Depreciation and Amortization (EBITDA) represent a flow to debt and equity all together (Pinto, 2010), it is less vulnerable to changes in the capital structure of the company, unless big changes lead also to changes in the cost of capital (Goedhart et al., 2005).
Furthermore, a multiple using the enterprise value as the numerator can only be suitable for the valuation of a firm, as it is not only considering but also an indicator for the overall value of the company. With the assumption that the market value of debt can be priced with reliability, one can even assess the correct value for equity by this multiple (Pinto, 2010). However, enterprise multiples have two big flaws, by not including or reflecting variations that can happen either by changes in WC requirements or capital expenditures (Fernandez, 2001).
𝐸𝑉 𝑡𝑜 𝐸𝐵𝐼𝑇𝐷𝐴 =𝐸𝑛𝑡𝑒𝑟𝑝𝑟𝑖𝑠𝑒 𝑉𝑎𝑙𝑢𝑒 𝐸𝐵𝐼𝑇𝐷𝐴
Conclusion
The DCF and multiples approach are then the ones to be used on this valuation. The first method was chosen for its importance and for being the most commonly used in the field of equity valuation. Also, it is the one that provides the most detailed analysis of the company, by allowing one to evaluate the evolution of all the relevant accounts for its operation. The second approach is used not only as a proxy for the DCF valuation and to check its validity, but also to compare the performance of BMW to its peers and industry.
The Industry
For a proper valuation of the BMW group, it becomes important to get to know the environment where it is competing and what the main behaviors, drivers and trends are, that need to be taken into account.
One should start by stating the importance of macroeconomic factors on the performance of the overall industry. Even though today’s society has embraced automobiles and motorcycles as part of their basic needs, they are still to be considered as luxury goods. Past behavior of the automotive industry is one of the best examples to illustrate this idea.
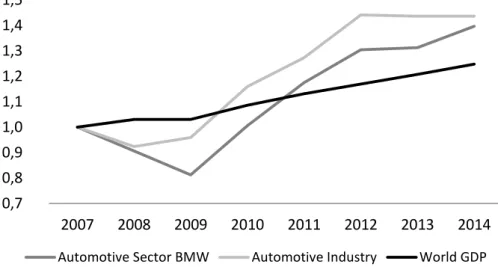
Figure 1 – Historical Growth correlation between World GDP, Automotive Industry and BMW
The automotive industry has been displaying considerable growth throughout the past years and has been one of the main drivers for industrial revolution, which was only possible by an outstanding effort from all its players to satisfy the needs for constant innovation while meeting demanding regulations.
However, it has shown to be not only one of the most important and with highest impact in today’s economy, but also one that is highly dependent on the world economy’s performance, with a degree of correlation of 0,952, according to own calculations. For the computation of total Industry sales, one found the most relevant companies in the sector that are considered as
0,7 0,8 0,9 1,0 1,1 1,2 1,3 1,4 1,5 2007 2008 2009 2010 2011 2012 2013 2014
Automotive Sector BMW Automotive Industry World GDP
peers for BMW, as shown in appendix 10. This means that a shock in the global economy will have a directly proportional impact, as the example of the financial crisis of 2009.
The industry appears, though, to be significantly recovering from the past shock by being able to successfully penetrate different countries and spread all over the world, even in new and emerging markets with special emphasis to China, which may also be the reason why the industry was not as affected as expected during the Global Financial Crisis.
This also means that a broader perspective of the economy needs to be taken into account, as high levels of public debt in Europe, USA and Japan, together with over-capacities in China and conflicts in the middle east, could definitely have considerable impact on the general outlook of the economy and, consequently, across the entire industry. Likewise, one can consider that the risks associated with the operation in emerging markets can be offset by this global presence of BMW, meaning that if any shock is to happen, the company is well diversified and established to counter that effect and better exploit new growth opportunities. The motorcycle industry has also seen high levels of growth, especially in the turn of the new millennium. Nonetheless, this upwards trend was heavily hit in 2007. Albeit in recovery, it is not expected to grow at the same pace as it was before. One needs to consider demographic and environmental conditions that are affecting the industry much like the economic factor that the world is facing. Nevertheless, the fact that it is a global industry, that emerging markets are considering motorcycles as a basic need of transportation and that the needs of the consumer are always changing and new markets are appearing, makes one believe that there are a lot of new opportunities to be found with high growth potential.
The financial services industry, being much related and going side by side with sales of automobiles and motorcycles, has also been showing signs of improvement. It has been benefiting much with the general stabilization of the world’s car and financial markets. Good examples of this statement are the lift on the public debt ceiling in the USA, the continuous expansionary monetary policy kept by the Japanese Reserve Bank and a more stable situation in the Eurozone, leading to a decrease in reference interest rates.
Finally, it is also important to care that the volatility of exchange rates, raw materials and interest rates as main drivers across all the industries under analysis. The availability of basic materials, being the most relevant the crude oil, and its price volatility need to be taken into
account and monitored constantly with well-defined management techniques. The way the BMW group offsets these effects will be explained in the section bellow.
Presentation of BMW AG
This section aims to make the reader acquainted with the BMW group, by making a brief summary of its history, structure and share and overall performance.
BMW is a German company based in Munich and was founded in 1917. It was initially focused on the production of aircrafts under the name Bayerische Flugzeug Werke AG (BFW). However, at the end of World War I, the group was prohibited to continue its current production and forced to restructure its business. Its first solution was to start the assembly of railway brakes and then turned to the manufacturing of motorcycles in 1923. Only in 1928 did BMW got to be as we know it today, with the production of its first automotive line.
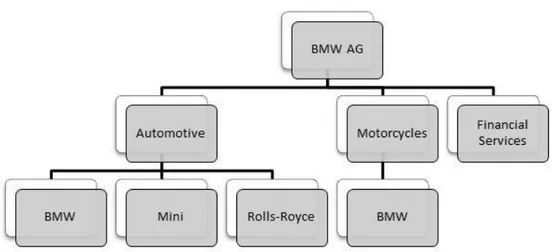
Nowadays, it is considered as one of the greatest industrial companies in the world with its focus on premium car and motorcycle manufacturing. Albeit competing in such a demanding market, the group is proving to be providing innovative and successful strategic solutions that make them a major player and leading company in its core segments. The group’s structure goes as follows:
Figure 2 – BMW’s Business Structure
Automotive Sector
The automotive business is definitely the most relevant for BMW’s operations. It has been representing, on average and throughout the past 5 years, 92% oftotal revenues registered by the group. Much like the entire industry, one can notice considerable recovery from the past crisis with sustained and consistent growth from 2009 until today. In fact, BMW has been Source: Annual report BMW 2014
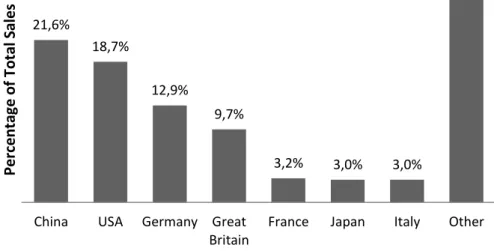
showing record sales volumes, with a total of 2 117 965 cars sold in 2014 for all its brands: BMW, MINI and Rolls-Royce, thus surpassing the two-million mark for the first time in its history. As a consequence, the group has been able to keep its pole position in the premium segment worldwide, despite the high volatility of many markets. The company’s distribution of sales can be seen on the figure below.
Figure 3 – BMW’s automotive global distribution for the year 2014
China is clearly taking the lead on sales contribution for the group with a total amount of almost 22%, represented by an increase of +13,8% in units sold, when compared with the previous year 2013. EUA has also been performing quite well with an increase in units sold of +5,8%. Europe, thanks to a more stable environment, has been able to keep up with reasonable levels of units sold and confirmed an increase of +6,4%. Germany and Great Britain are also contributing to the healthy growth of the group with an increase of +5,1% and +8,4%, respectively, in units sold.
Motorcycles Sector
BMW’s motorcycles industry was no exception to the global financial crisis. From 2007 to 2009, the company saw their revenues decrease by 14%. Recovery from that event is noticeable and BMW seems to be on the right track, finding new profitable opportunities in the premium motorcycle segment.
By having one of its brands, Husqvarna, bought by one of its competitors in 2014, BMW seems to be focusing all its attention to the BMW Motorrad brand, together with the new
21,6% 18,7% 12,9% 9,7% 3,2% 3,0% 3,0% 27,9%
China USA Germany Great Britain
France Japan Italy Other
Perc en ta ge o f T o ta l S al es
motto “MAKE LIFE A RIDE” and raising enthusiasm worldwide for motorcycle riding. This has shown signs of great improvement for the 500cc plus class, also as a result of the implementation of new models in the market. Together with entry in the world of electromobility, which is seen as the beginning of a new chapter in urban mobility, sales are spreading and increasing all over the world, therefore outperforming the market as a whole. The highest improvement can be seen in France, with +11,5% when compared to 2013, followed by USA and Europe with +8,5% and +6,7% respectively.
Figure 4 - BMW's motorcycle global distribution
Financial Services Sector
For BMW, financial services turned to be the second most relevant account, in what revenues are concerned, accounting on average for 27% of total revenues for the group. It comprises areas of business such as leasing, fleet business, retail customer and dealer financing, customer deposit and insurance activities. Credit financing and leasing of motorcycles and cars to retail and business clients are clearly the most significant of them all.
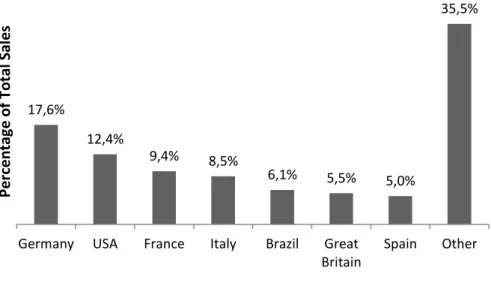
Being so related to the two other main business areas, one can notice that the attractiveness of the new product portfolio that the company has been developing also had a positive impact in the financial services area. Furthermore, alongside the sales record previously stated for both automobiles and motorcycles, the financial services segment is operating in over 50 countries and retail customers and dealers have placed 4 359 572 lease and credit financing contracts representing an increase of +5,6%. 17,6% 12,4% 9,4% 8,5% 6,1% 5,5% 5,0% 35,5%
Germany USA France Italy Brazil Great Britain Spain Other Perc e n ta ge o f T o ta l S al es
Finally, there is also a risk profile that needs to be associated with this segment, given its correlation with macroeconomic factors. Yet, the positive trend in the global economy and a more stable environment post to the euro crisis also enables it to improve in 2014.
The stock markets
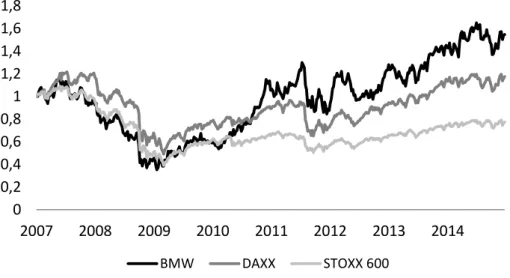
The BMW group has been trading in the German stock exchange market, DAX, since 1918 and in the EURO STOXX 600 with a price at the date of valuation of 89,77€ per share. Its historical performance and comparison with both stock markets can be seen below.
Figure 5 – Historical price performance for BMW, DAX and SXXP 600.
Again, one can see that the BMW group was no exception to shocks in the economy, as it also saw its price decline to half during the most recent financial crisis. However, one can also observe a fast and strong recovery during the year’s right after. This was only possible with the so called Strategy Number One that tries to set the course for a bright future. The strategy has as its foundation profitability and constant long-term added value.
Also, the group means to be the leading provider of premium products and services for individual mobility worldwide, as a consequence of a long term strategy and constant innovation that have on their foundation the manufacturing of premium brands that set the highest standards for esthetics, dynamics, technology and quality. Nonetheless, this constant effort and success is also highly correlated with increases in expenditure, as it can be seen below. 0 0,2 0,4 0,6 0,8 1 1,2 1,4 1,6 1,8 2007 2008 2009 2010 2011 2012 2013 2014 BMW DAXX STOXX 600 Source: Bloomberg
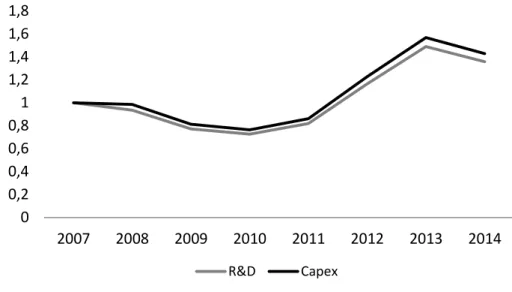
Figure 6 - Revenues and expenditures over the years
BMW has been showing record values for capital expenditures and research and development costs (R&D). However, this steep increase for both expenditures is derived from the fact that the group has been investing in new model start-ups and launches across all its brands, automotive and motorcycles, especially with the new BMW i3 and BMW i8, that are being able to disrupt the market with new opportunities in the field of electromobility; and the development of their connected mobility and efficient dynamics features, that provide more efficient navigation systems, aerodynamic characteristics and, most importantly, engines that manage to keep up with EU emission standards.
Commodity risk
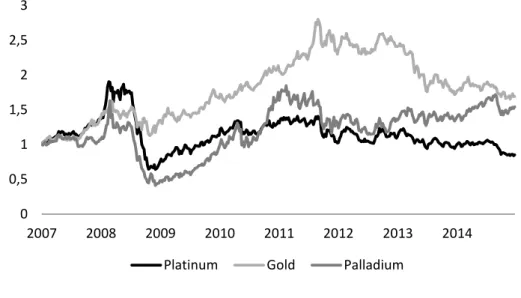
The volatility of raw materials, as mentioned before, is of great importance for BMW and are monitored on the basis of a set of well-defined management procedures. The most significant is undoubtedly the price of crude oil. Not only is it an important basic material in the manufacturing process, having an impact in production costs, but also does it change the purchasing behavior for new cars, by having direct effect in fuel prices. Likewise, the prices for steel, non-ferrous metals, precious metals, like aluminum and copper, and energy sources also have great impact in the manufacturing process for both cars and motorcycles. Performance for some of the above mentioned materials are presented on the following chart.
0 0,2 0,4 0,6 0,8 1 1,2 1,4 1,6 1,8 2007 2008 2009 2010 2011 2012 2013 2014 R&D Capex
Figure 7 - Historical Commodity performance
The Group uses financial hedging through the use of financial derivatives and/or supply of contracts with fixed pricing arrangements to counter the present adversities. If the risks of raw materials are to be materialized, medium impact should be expected. Conversely, it can also present significant opportunities if they are to develop favorably for the group.
For the case of Crude oil, BMW also invests on the development and manufacturing of highly efficient, low-consumption engines and alternative drive technologies, as a way to reduce its dependency from both the manufacturer and the customer.
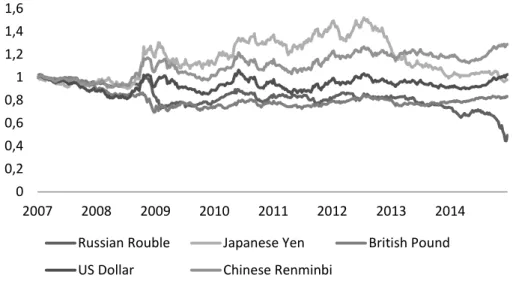
Currency risk
Being such a global company, BMW is constantly facing exchange rate risks that can have great impact on its results. The Group pays special attention to the US Dollar and the Chinese Renminbi when compared to the Euro. Both of them have shown quite pronounced variations over the years, much like the Russian Rouble, as shown below.
0 0,5 1 1,5 2 2,5 3 2007 2008 2009 2010 2011 2012 2013 2014
Platinum Gold Palladium
Figure 8 - Historical Currency performance
Given this, there is some uncertainty that BMW counters by the use of two different types of hedging. On the one hand, it uses financial hedging, much like the one that is used to offset the effect of raw material volatility. On the other hand, and most importantly, it uses natural hedging by increasing the volume of local production and purchases and, consequently, reducing its currency exposure.
0 0,2 0,4 0,6 0,8 1 1,2 1,4 1,6 2007 2008 2009 2010 2011 2012 2013 2014
Russian Rouble Japanese Yen British Pound US Dollar Chinese Renminbi
Valuation
This section is meant to present the output and valuation of the BMW group and the resulting price per share, much like all the assumptions that are related. Two methods are used: The Discounted Cash Flow and the Multiples method. The date of valuation is the 31st of December 2014.
Forecasting the Income Statement
The preceding analysis is meant to be used as a basis for the projection of all the accounts present on the Income Statement of BMW. Forecasts (appendix 2 and 3) are to be made as a way to facilitate the valuation through cash flow discounting and are divided between the explicit period, composed of 5 years where it is assumed that the world’s economy is to become stabilized, especially in the Eurozone and China, and a more detailed analysis of all the accounts is done; and the terminal value.
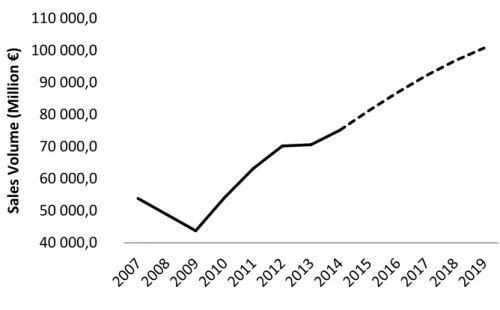
Automotive Revenues
Revenues are undoubtedly the most relevant items for the correct valuation of the BMW Group, due to the fact that many things are held up against it. (Goedhart et al., 2010) suggests two methods for valuing the behaviour of revenues. The top-down approach was used, as there seems to be a huge influence of macroeconomic factors on its behaviour. One should depart from these deeds to extrapolate a specific behaviour for revenues.
With a high correlation degree of 0,93 with the world’s GDP and BMW’s global presence, the next step is to analyse how the world GDP is to perform. According to the IMF database, projections for growth are to be stable at a level of 4% until 2019 (appendix 9).
Nevertheless, it is still needed to take into account past performance and beliefs about future behaviours of the market and BMW. Previous product restructuration is having a great impact on the customer’s willingness to buy, which makes one trust that BMW will keep performing well for the next years and with significant values of growth, assuming that economic conditions remain stable, enabling to keep its position as the world’s foremost premium car manufacturer.
Figure 9 - Automotive revenues performance
Additionally, it is stated by the Group that new models for cars are also target of product life cycles theories. In the specific case, cars are supposed to sell most after 18-24 months and tend to slow down after four to five years. Given that the most recent product restructuration in 2013 has been the most relevant for the past years, one is to give special emphasis to this statement.
With a growth rate of 6% from 2013 to 2014, one is to increase revenues to 8% in 2015, value that is equal to the average of the past five years that include periods of high and low growth. With that, it is also intended a more conservative view than other existing reports that forecast an increase of 9% for vehicle production in 2015, and to keep with BMW’s expectations for growth in 2015 of between 5% and 10%. From then on, it was decided to smooth the growth rate to values similar to the ones of GDP in 2019. This way, one is hopefully representing the expected leading position in the premium car market from BMW over the years.
Motorcycle Revenues
For the case of motorcycles, one is to apply the same reasoning as the one for the automotive industry. According to the forecasts of the group, the market for the 500cc plus motorcycle is expected to keep growing in the future, although at a lower rate than the one registered until now, still translating an increase in almost every market. For that matter, one is again to include in the calculations periods of high and low growth to take assumptions about future
40 000,0 50 000,0 60 000,0 70 000,0 80 000,0 90 000,0 100 000,0 110 000,0 Sa le s V o lu me (M ill io n € )
developments. The rate of about 4,1% was calculated and assumed to be constant throughout the explicit period.
Figure 10 - Motorcycle revenues performance
Financial Services
As previously stated, the financial services segment is mainly composed by credit financing and lease contracts for both cars and motorcycles and is expected by the group to keep performing well in future years. Thus, one is to assume that those are the relevant aspects to take into consideration when forecasting this account. Also, it is safe to say that, as a consequence, the growth rate of the segment will most likely follow the one presented by the other two business areas.
By historical analysis, it can be seen that financial services have been representing, on average, 29% of total revenues coming from automobiles and motorcycles, between 2007 and 2014, meaning that it also takes into consideration periods of high growth and decline, giving a more balanced and conservative view of what future performance may be. Given this, financial services’ revenues are to assume the presented ratio in 2019, being smoothed to that value during the following five projection years, as presented below.
900,0 1 100,0 1 300,0 1 500,0 1 700,0 1 900,0 2 100,0 2 300,0 Sa le s Vo lu me (M ill io n € )
Figure 11 - Financial Services revenues performance
Cost of Goods Sold
(Goedhart et al., 2010) recommends that operating expenses, such as Cost of Goods Sold (COGS), Sales and Administrative Expenses and Other operating Expenses should be forecasted as a percentage of revenues. This argument becomes even stronger, when one can notice by the analysis of the annual report that all the items are, indeed, highly correlated with the operations of the Group.
Figure 12 - COGS performance over Revenues
10 000,0 15 000,0 20 000,0 25 000,0 30 000,0 35 000,0 Sa le s V o lu me (M ill io n € )
Source: Annual Report and own calculations
0,60 0,65 0,70 0,75 0,80 0,85 0,90 Perc e n ta ge o f T o ta l Rev e n u e s
For the specific case of COGS, they have been adjusted to exclude the effect of R&D costs. For the past seven years, BMW has shown a ratio of COGS over sales of between 69% and 85%. However, this value seems to have been stabilizing from 2009 onwards to 74%, hence being the percentage of revenues assumed for the projections.
Research and Development
In a company like BMW with constant requirements for new and innovative technologies, especially in such a competitive market as the one of premium manufacturers, R&D pays one of the most important roles for future success and are analysed separately.
The company has been registering record values for this account over the past two years, mainly as a result of new vehicle models, drive systems and innovative technologies. Still, this peak should not be seen as a one-time event, given that BMW has planned further developments not only in existing car series, but also for new models and expansion of existing facilities.
One can then consider that there was, in fact, a peak on the R&D over sales ratio and that it is to decrease in 2015 to the average of the past five years’ average. From then on, one is to consider the ratio constant, as a way to increase R&D expenses proportionately to revenues, considering both scenarios of higher and lower investment needs.
Figure 13 - R&D performance over Revenues
0,04 0,04 0,04 0,05 0,05 0,05 0,05 0,05 0,06 0,06 0,06 Pe rc en ta ge o f T o ta l Re ve n u es
Selling and administrative costs
Selling and administrative costs are mainly related to marketing, advertising and sales personnel costs, showing to have high correlation to sales. It is then expected that if the business is to expand, these costs will follow the same trend. Also, the ratio over sales has been proving to be quite stable over time, with variations between 9% and 10% of sales. Given this, Selling and Administrative costs should be expected to keep that trend. For that, one may assume an historical average over the period of estimation equal to 9,5% of revenues.
Figure 14 – Selling and Administrative Costs performance over Revenues
Other Operating Income and expenses
Other operating income and expenses refer mainly to the existence of public-sector grants, exchange gains, changes in reversal of provisions and impairments and disposal of assets, making it harder to predict. Still, by presenting very close values over the years, one may assume that both income and expenses can converge to the same value, as a percentage of revenues in 2019. Since the ratio has been slightly varying between 1% and 2,5%, the value used will be the average from 2007 to 2014.
0,084 0,086 0,088 0,090 0,092 0,094 0,096 0,098 0,100 0,102 Perc e n ta ce o f T o ta l Rev en u es