DISCUSSION PAPER SERIES
IZA DP No. 12656
Jorge Bravo Mercedes Ayuso Robert Holzmann
Making Use of Home Equity: The
Potential of Housing Wealth to Enhance
Retirement Security
Any opinions expressed in this paper are those of the author(s) and not those of IZA. Research published in this series may include views on policy, but IZA takes no institutional policy positions. The IZA research network is committed to the IZA Guiding Principles of Research Integrity.
The IZA Institute of Labor Economics is an independent economic research institute that conducts research in labor economics and offers evidence-based policy advice on labor market issues. Supported by the Deutsche Post Foundation, IZA runs the world’s largest network of economists, whose research aims to provide answers to the global labor market challenges of our time. Our key objective is to build bridges between academic research, policymakers and society.
IZA Discussion Papers often represent preliminary work and are circulated to encourage discussion. Citation of such a paper should account for its provisional character. A revised version may be available directly from the author.
DISCUSSION PAPER SERIES
ISSN: 2365-9793
IZA DP No. 12656
Making Use of Home Equity: The
Potential of Housing Wealth to Enhance
Retirement Security
SEPTEMBER 2019
Jorge Bravo
Universidade Nova de Lisboa, Université Paris-Dauphine, MagIC and CEFAGE-UE
Mercedes Ayuso
University of Barcelona
Robert Holzmann
Austrian Academy of Sciences, CEPAR, Uni-versity of New South Wales, SSRC, Univer-sity of Malaya, IZA and CESifo
ABSTRACT
IZA DP No. 12656 SEPTEMBER 2019
Making Use of Home Equity: The
Potential of Housing Wealth to Enhance
Retirement Security
The demographic change underway, declining adequacy levels from traditional pay-as-you-go old-age social security systems, structural reforms in pension schemes and the reduction in the traditional family support have increased the need for additional private savings to cover the old age income gap. In this paper we discuss the necessity, the role and the viability of home equity release schemes in supplementing public and private pensions in an integrated way. We use the latest European data from the Eurosystem Household Finance and Consumption Survey (HFCS) to analyse the household’s wealth composition and accumulation process in the euro area. To quantify the size of the housing wealth and its potential to enhance existing and future retirement income, we compute the equity-to-value ratio (ETV) for all countries, estimate the time to loan payoff and compute the amount of home equity that is expected to be released over a 10-year period through regular monthly mortgage payments. We then catalogue and discuss the many alternative options for managing and accessing housing wealth over the life cycle, and highlight the main characteristics, risks, advantages and drawbacks of the two most important market products (home reversion plans and reverse mortgages). Finally, we discuss the main demand-side and supply-side obstacles and challenges to the development of equity release markets and extract some policy implications.
JEL Classification: D1, G1, J1, R2, R3
Keywords: equity release schemes, housing wealth, reverse mortgage, homeownership, retirement income, pensions adequacy
Corresponding author:
Robert Holzmann
Austrian Academy of Sciences Dr. Ignaz Seipel-Platz 2 1010 Wien
Austria
1. Motivation, approach, and structure
The demographic change underway in developed and developing countries, the increasing problems of traditional pay-as-you-go old-age social security systems, the fiscally driven public pension reforms, the move from non-funded (collective) defined benefit (NDB) schemes towards (individualised) funded and defined contribution (FDC) schemes, the decreasing generosity of public health care systems and of public annuities, with deep adequacy and poverty concerns in several countries and within certain groups of people (e.g., women, less-educated groups and migrants), the reduction in the traditional family support at old-age because of falling fertility rates, urbanisation and migration, all have increased the need for additional private savings to cover the old age income gap and to avoid relying on state-managed social transfers to counter the risks of poverty (Bravo & Holzmann, 2014; EC, 2018).
Empirical evidence shows that although private pensions are becoming more widespread, the coverage rates are still small and the contribution amounts insignificant in most cases (see, e.g., Household Finance and Consumption Survey, ECB 2016). Most DC scheme members have not contributed enough to receive even a modest income stream in retirement. For the contrary, building up housing wealth through homeownership and mortgage repayment is by far the main way European households set aside for old age. In the Euro area countries, the household's wealth (excluding pension wealth, the present value of all future expected pension benefits) is primarily held in the form of real assets, which represent 82.2% of total assets owned by households (85.1% in Spain, 88% in Portugal) with the remaining assets (17.8%) being financial. The largest component of real assets is the household main residence (HMR), representing 60.2% of total real assets, followed by other real estate property (22.3%). In the EU, roughly 70% of Europeans live in owner occupied accommodation, ownership is higher in poorer countries and the proportion of home owners by age band has been steadily increasing with each successive generation. Empirical evidence also shows that homeowners are generally wealthier than their non-home owning counterparts, and this conclusion is valid across the income or net wealth distribution and across countries. The poverty rates among older tenants are much higher than those of older people who own their house, which means that for them the scope for enhancing retirement income using their properties is limited. The wealth distribution is highly unequal in the population, partially explained (and expected) due to different life cycle stages, but also observed at equal ages.
Personal pensions and private homeownership are the two main assets individuals have to finance (supplement) retirement consumption in an asset-based approach to welfare in which individuals accept greater responsibility for their own welfare needs. They both involve long-term saving and investment decisions over the life cycle, they are motivated by potentially competing objectives and generate different options and outcomes at old-age. Home homeownership provides a stream of housing services starting at time of house acquisition and represents wealth which could be liquidated in old age if needed. The asset serves both consumption and investment functions, which are assessed differently by households based on their personal preferences. Contrary to renting, home ownership is often regarded by individuals as an investment in asset-building, a better option to cope with inflation and to profit from house price appreciation. Access to affordable housing is crucial to any retirement income system since it contributes to
reduce poverty by allowing retirees to maintain an adequate standard of living. Housing is in reality a complex welfare good that supplements and mediates the flow of other welfare goods and services at the household level (e.g., health, education, integration, family welfare exchanges), making individuals more or less dependent on the state, market and family for the satisfaction of other needs (Doling & Ronald, 2010). Personal pension assets serve mainly as an investment vehicle and have benefits commencing only at the retirement age, i.e., contrary to housing assets their utility is deferred until retirement age. Both financial products and property assets may increase in value over time and expand future consumption opportunities but there are risks involved. Both can, at least in theory, be used in the future to supplement consumption and welfare needs when labour or capital income is reduced and expenditure demands (e.g., due to long-term care) increase, or used throughout life for consumption or investment purposes. They have, however, different levels of liquidity and their initiation and mobilization entails in the case of home equity significant monetary and non-monetary costs.
Accumulating wealth through homeownership usually requires entering into a fixed or floating-rate mortgage loan on the mortgage market to buy a house and saving over the working lifetime to pay off the debt. However, we should not ignore those who inherit properties and the importance of intergenerational transfers for wealth accumulation. Additionally, in countries, regions and cities in which house prices had positive developments over the past decades, households owning their dwelling benefited substantially from accrued capital gains. This may trigger a housing wealth effect with important macroeconomic impact on consumption, saving and economic growth. However, despite being asset rich they are in many cases cash poor since their wealth is tied up in the house.
The increasing need of private savings for old-age is potentially in conflict with savings for homeownership. In many cases, an average household repays annually in mortgage capital an amount that is substantially higher than that saved into the pension pot. Together with taxation, the resources required for paying for a home act as a strong disincentive to funded social security and welfare, although there is still no clear evidence to conclude whether households owning property and repaying mortgages save more than renters or to what extent homeowners with a mortgage substitute any financial savings with mortgage payments or see them as complements. If paying off a mortgage is perceived as equivalent to savings for retirement there is no apparent trade-off, but the existence of liquidity constraints and the need to align and integrate the objectives and incentives for both investment decisions is difficult in practice. One way of mitigating this potential conflict involves unlocking the wealth people have accumulated in their homes to help fund retirement and care by using a number of alternative Equity Release Schemes (ERS). Some of these mechanisms involve selling the dwelling and moving, while in others accessing the wealth accumulated in the form of his or her home is possible while being able to continue to live in it until you die or move to a residential care home.
Against this background, this paper examines the necessity and the viability of home equity release schemes and the possible routes by which housing wealth may enhance retirement income. We use the latest European data from the Eurosystem Household Finance and Consumption Survey (HFCS) to analyse the household's wealth composition and accumulation process in the euro area. The paper focuses
on four main factors underlying the wealth accumulation process: (i) the portfolio asset composition between financial and real assets; (ii) the importance of homeownership and house price dynamics; (iii) housing wealth inequalities within countries (across age groups and income and wealth quintiles); (iv) the mortgage debt burden and the equity release potential from servicing the loan. To quantify the size of the housing wealth, we compute the average equity-to-value ratio (ETV) for all countries, estimate the time to loan payoff and estimate the amount of home equity released over a 10-year period through regular monthly mortgage payments. We then catalogue and discuss the many alternative options for managing and accessing housing wealth over the life cycle, summarizing the main characteristics, risks, advantages and drawbacks of the two most important market products (home reversion plans and reverse mortgages). Finally, we discuss some of the existing obstacles to the development of equity release markets and sum up the main conclusions and next steps.
The use of equity release schemes is supported by the life cycle theory of consumption (Modigliani & Brumberg 1954) which has long been the workhorse to model wealth accumulation and decumulation decisions of individuals. The theory assumes that individuals optimize their consumption over their active and retirement age based on expected lifetime or permanent income. In order to perform lifecycle redistribution and smooth consumption over the lifecycle, it is assumed that individuals accumulate financial and non-financial assets during the earlier years of their life course when (permanent or transitory) income exceeds consumption, and draw down their wealth thereafter till death when income falls below levels required to fulfil consumption needs in later life (Ong et al., 2013). In such a model wealth acts as a buffer between consumption and income enabling individuals to shift purchasing power through time. The life-cycle model is not only used to analyze consumers’ lifetime consumption, saving and household finance decisions, but also for studying asset allocation within specific periods.
In its simplest form, the life cycle model predicts an individual will consume all of his or her wealth (including housing and other property assets) by the end of the life cycle. For homeowners, this means cashing in their housing wealth to fund consumption in old age. To address uncertainty about the length of life, one of the main sources of risk that an individual faces when planning for consumption in later life, the model suggests insuring through the purchase of a life annuity providing a constant flow of income until death at retirement (Yaari, 1965). The relative magnitudes of the individual’s time discount rate and the market interest rate determine whether consumption is expected to be constant, or monotonically decreasing or increasing as an individual ages. In the context of a simple life cycle model, Barro and Friedman (1977) demonstrate that when perfect insurance markets are allowed, life cycle consumption under uncertain lifetime is the same as under certainty. If an annuity market does not exist, this rationale is no longer valid although in many countries public social security schemes offer some insurance against uncertain lifetimes (and other life events), and may provide a substitute for non-performing annuity markets. In its simplest form the lifecycle hypothesis does not take housing wealth into account despite empirical evidence showing that for most retirees housing assets constitute the single most important component of their wealth. Yao and Zhang (2005) found that homeowners tend to have a higher proportion of risky-assets to liquid assets. Li and Yao (2007) suggest that housing wealth volatility impacts significantly individuals'
life-cycle consumption and welfare. Banks et al. (2010) find that transition from married to single, widowhood, children leaving home, transition from work to no work, higher price volatility, and higher home values positive trigger downsizing whereas high income discourages it. Davidoff (2010) suggests that home equity has a payout highly correlated with that of the demand for long-term care insurance (LTCI). Nakajima and Telyukova (2014) model the demand for reverse mortgages and conclude that the modest demand reflects the substantial risks that households face late in life and house price uncertainty, bequest motives and costs of the contract.
However, there is a growing body of literature and empirical evidence suggesting that the actual saving/dissaving behavior before and after retirement is often at odds with the lifecycle hypothesis and that there are three tiers of the population that exhibit well differentiated saving/dissaving behaviour (see, e.g., Holzmann, Ayuso, Alaminos & Bravo (2019) for an extensive review and discussion). The lowest income and wealth tier does little or even no saving and, consequently, arrives at retirement age with limited financial assets and housing wealth and barely dissaves after retirement. The top tier oversaves, does little or no dissaving and may even continue to accumulate financial and non-financial assets during retirement. Decumulation takes place only through public or private annuities which finance part of old-age consumption, in the event of a major financial shock (e.g., an uninsured health or long-term care shock, an expensive divorce, natural catastrophes or failed speculative investment) or through intergenerational inter-vivo transfers. Finally, the middle tier is the only one that seems to behave according to the lifecycle hypothesis, although the pattern of asset accumulation and decumulation is much more broken than predicted by theory as a result of multiple life events or shocks (e.g., family formation, divorce, children leaving or returning home, the actual or expected receipt of an inheritance during working life or after retirement, the need to provide care to a relative or to be cared by someone, expensive sickness, long-term care, long unemployment spells, widowhood. In addition to pension wealth accumulated through mandatory pension schemes, individuals acquire financial and non-financial (housing) assets that peak around the retirement age. With retirement their pension wealth decreases (the exception being those without life annuities) but their financial and real wealth stabilizes. Similar to the other income and wealth tiers, they are also vulnerable to financial shocks but still reluctant to use their major wealth component (the HMR) to supplement income and finance consumption in retirement.
A number of reasons may explain why in empirical studies households deviate from the lifecycle hypothesis, saving in some tiers more than expected and not decumulating their housing wealth. They include uncertainty regarding retirement income, precautionary behaviour to face major family shocks, uninsured future health care and long-term expenditures, evidence showing that individuals care about their descendants, behavioral and cultural biases, outdated social norms and psychological barriers, mental-accounting (precautionary) savings behaviour, the design and implementation of mandated earnings-related retirement schemes across countries including minimum income (and service) guarantees and related provisions, pensions taxation regimes and the heterogeneity in longevity by income levels (Holzmann et al., 2019).
The remainder of this paper is structured as follows. In Section 2 we examine household's asset allocation in the EU and the financial significance of housing equity over the life cycle. In Section 3 we discuss the many ways of managing and accessing housing wealth and provide a catalogue of Equity Release Mechanisms. In Section 4 we identify the main demand and supply obstacles to the development of equity release markets. Finally, in Section 5 concludes and draws some preliminary policy implications.
2. Households asset allocation and the financial significance of housing equity over the life cycle
In most countries, housing is the most significant asset held by families. Households accumulate real and financial assets for old age by building up an ownership stake in homes and by saving through personal pensions. Accumulating wealth through homeownership typically requires taking a loan on the mortgage market for buying private property. The asset has both a consumption (by offering a stream of housing services) and investment function (if needed, the asset may be released through several equity release mechanisms). Homeowners who live in their own home benefit from housing services without having to pay rent but need to spend money on maintenance costs to preserve the value of their investment over time. Accumulating wealth through private pensions implies that consumers lend money to financial intermediaries which invest them in the financial markets. The decumulation process of assets built up through private pensions and homeownership is, however, much different. In fact, while assets accumulated in private pensions can easily be liquidated in old age as a lump sum or as a periodic income stream, extracting value from home equity both in situ and through trading down is much more difficult since homeownership is a much more illiquid asset (Eckardt, 2018).
With the exception of those in the low-income and wealth tier that do little saving and are often excluded from credit markets and those in the upper part of the income distribution, who inherit properties or are able to save for and acquire a dwelling during their lifetime with no liquidity constraints, for those in the middle tier there is a direct link between the process of accumulating and decumulating home equity since they have to finance the acquisition of a home and have limited capacity to built up sufficient equity (net wealth, including financial assets) so that they also own it economically. Consequently, home equity should be analysed over the whole life cycle. In some countries (e.g., Singapore) there is even total integration between housing and pension policies since pension savings can be mobilized for housing, homeownership is actively promoted, housing has been made available to lower socio-economic groups and housing assets can be monetized when necessary.
In Figure 1 we use the second wave of data from the Household Finance and Consumption Survey (HFCS, ECB 2016) to outline the way households in the EU allocate their wealth between financial and real assets by.1 We can observe that real assets account for a large majority (82.2%) of household's gross wealth in
1 The HFCS is a survey that collects data on households’ finances and consumption for 18 euro area countries (all except
Lithuania), as well as Hungary and Poland. Currently, the survey accounts for two waves, taking place the second wave between 2013 and 2015. The total sample consists of more than 84,000 households.
the Euro Area, with maximum values observed in Poland, Slovenia, Slovakia and Latvia whereas in the Netherlands, Belgium, Germany, Finland or France households hold a higher share of financial assets. Moreover, across all net wealth quintiles, total assets are dominated by real assets, particularly the household's main residence (HMR).
The share of real assets on total assets has increased over the last years along with the increase in the average size of total assets. In the Euro Area, individual household portfolios are generally not diversified, but dominated by one main asset. In Figure 2 we decompose real assets by asset category. We can observe that the value of the HMR, which is the result of the initial acquisition price, accrued capital gains from increased property prices, depreciation or reinvestments, is the household's most valuable asset in all euro area countries.
Figure 1: Shares of real and financial assets on total assets in the EU
Source: Own composition based on Household Finance and Consumption Survey (2016), 2nd wave. Notes: Real assets include the value of
the household main residence for homeowners, other real estate property, vehicles, valuables (e.g., jewellery, works of art, antiques, etc.) and value of self-employment businesses. Financial assets include deposits (sight and saving accounts), mutual funds, bonds, shares, money owed to the households, value of voluntary pension plans and whole life insurance policies of household members and other financial assets item - which includes private non-self-employment businesses, assets in managed accounts and other types of financial assets.
82.2 76.7 77.6 89.8 87.5 93.4 85.1 81.1 88.6 91.3 91.9 84.7 83.2 86.2 75.1 86 95.4 88 93.5 92 83 17.8 23.3 22.4 10.2 12.5 6.6 14.9 18.9 11.4 8.7 8.1 15.3 16.8 13.8 24.9 14 4.6 12 6.5 8 17 0% 10% 20% 30% 40% 50% 60% 70% 80% 90% 100% euro area BE DE EE IE GR ES FR IT CY LV LU HU MT NL AT PL PT SI SK FI Real assets Financial assets
In the euro area, the average contribution of the HMR to total real wealth is 60.2% (49.5% of total assets), with top proportions observed in Slovakia, Italy and the Netherlands. In only two countries the share is below 50% (Cyprus (40%) and Portugal (49.8%). For almost nine out of ten homeowners, the HMR has the largest share in the total asset portfolio (ECB, 2016). Real estate property (HMR, other real estate property) dominate the asset holding in all countries.
Figure 2: Decomposition of real assets by asset category
Source: Own composition based on Household Finance and Consumption Survey (2016), 2nd wave. Notes: Shares of real assets types on
total real assets by euro area country. The HFCS classifies real assets into five categories: the HMR, other real estate property, vehicles, valuables (valuable jewellery, antiques or art) and self-employment businesses.
Irrespectively of housing wealth accumulation regimes, the increasing importance attributed to home equity has been driven by five main factors: (i) homeownership by age band has been steadily increasing with each successive generation, as a result of a change in the tenure structure with fewer renters overall; (ii) an increase in house prices, despite some volatility in recent years as a consequence of the crisis; (iii) increased longevity will bring about more homeowners; (iv) home purchase is frequently considered the
60.2 67 55.1 55.7 53.3 56.6 58.5 55.9 70.2 40 52.7 59.7 67.5 53.5 80.1 58.1 69.9 49.8 58 77.9 64 22.3 19.3 24.4 19.4 35.8 31.3 28.5 20.2 17.4 34.3 27.2 31.8 16.1 19.1 12.6 16.9 10.5 29.8 14.7 9.5 25.5 3.5 2.9 3.8 4.4 2.9 4.3 2.8 3.4 3.1 2.3 4.5 2.8 4.3 3.3 4.9 3.5 3.2 3.7 4.1 5.8 5 11.8 9.8 15.1 19.7 6.1 7.1 9.2 14.7 7.8 23 15.4 4.7 11.7 23.2 1.6 20.2 16.1 15.4 22.8 6.3 5.5 0% 10% 20% 30% 40% 50% 60% 70% 80% 90% 100% euro area BE DE EE IE GR ES FR IT CY LV LU HU MT NL AT PL PT SI SK FI Household's main residence Other real estate property Household's vehicles
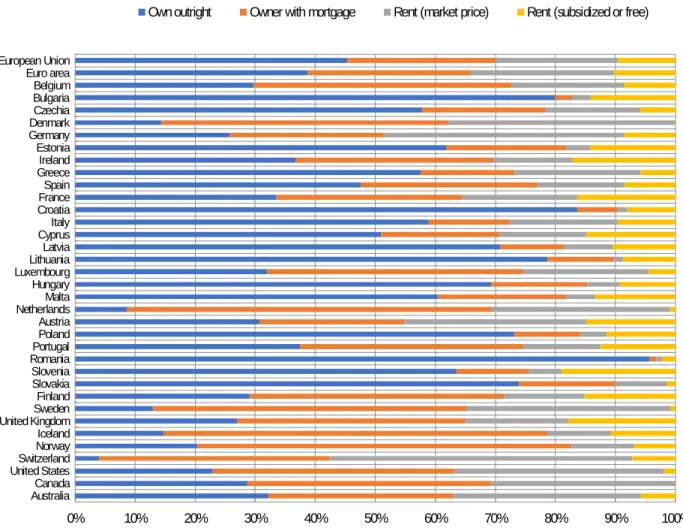
preferred investment vehicle for government supported saving, with substantial fiscal incentives targeted to support owner-occupied housing; (v) Housing market dynamics has provided multiple opportunities for individuals and companies to build their wealth through housing construction, through real estate trading or through investment in properties to rent out. Housing has become an increasingly marketable commodity. As each generation passes on, the next generation will inherit property and is expected to have more owners and fewer renters. In Figure 3 we show the housing tenure distribution in OECD countries using the 2017 or latest year available from the Eurostat, EU-SILC survey.2 The homeownership rate, debt balances
at retirement age and equity-to-value ratios are key indicators of home equity release feasibility and market potential. We can observe that 70% of EU households own their dwelling (with or without outstanding mortgage related to the dwelling), with homeownership rates exceeding 80% in many countries.
Figure 3: Housing tenure distribution in OECD countries, 2017 or latest year available
Source: Eurostat, EU-SILC survey; Notes: Share of households in different tenure types, in percent. Housing tenure types: Own outright: The
household owns the dwelling and has no outstanding mortgage related to the dwelling; Owner with mortgage: The household owns the dwelling but is currently paying off the mortgage; Rent at market price: The household rents the dwelling at market prices on the private rental market; Rent (subsidized or free): The household rents the dwelling at reduced market prices or the accommodation is provided for free.
2 See also Appendix 1 for details.
0% 10% 20% 30% 40% 50% 60% 70% 80% 90% 100% European Union Euro area Belgium Bulgaria Czechia Denmark Germany Estonia Ireland Greece Spain France Croatia Italy Cyprus Latvia Lithuania Luxembourg Hungary Malta Netherlands Austria Poland Portugal Romania Slovenia Slovakia Finland Sweden United Kingdom Iceland Norway Switzerland United States Canada Australia
The highest share is found in former communist countries of Central and Eastern Europe, due to the special acquisition conditions offered after the fall of the communist regimes (e.g., in Romania more than 95% of households own their dwelling outright), but in countries like Chile, Mexico, Norway, Iceland and Southern European countries the ownership rates (with or without mortgage) are also high (78% in Spain, 73.9% in Portugal). Note also that homeownership rates vary considerably across countries. The importance of the rental market is higher in countries like Switzerland, Denmark, Germany and Austria. Trends in homeownership rates and in real estate market indicators show that the amount of wealth parked in housing assets reached record high levels. The differential use of alternative homeownership promotion regimes in Europe (e.g., high state support for rental housing, social rental sectors, highly subsidized homeownership sectors, privatisation of social housing, mortgage finance liberalisation, and borrowing constraints) may explain the differences in homeownership rates and the distribution of housing wealth. In Table 1 we breakdown the homeownership rates of the HMR by income quintile. We can observe that homeownership in the euro area is strongly positively correlated to income: households in the lowest income quintile have an ownership rate of 47.6%, while for those in the top decile, it is 82.1%. For households in the lowest income quintile, the relation to income is weaker in Germany, France, Austria and the Netherlands and stronger in Southern (Spain, Portugal, Greece), Central and Eastern Europe countries. Table 1 shows that the correlation between homeownership and net wealth is even stronger than that reported for income. In the euro area, while only 8.1% of households in the lowest net wealth quintile are homeowners, 94.5% in the highest net wealth decile own their house.
Table 1: Ownership of households’ main residence (HMR) - breakdown by income and net wealth quintile euro area BE DE EE IE GR ES FR IT CY LV LU HU MT NL AT PL PT SI SK FI Total 61,2 70,3 44,3 76,5 70,5 72,1 83,1 58,7 68,2 73,5 76 67,6 84,2 80,2 57,5 47,7 77,4 74,7 73,7 85,4 67,7 Inc om e <20% 47,6 44,3 20,3 62 60,2 64,6 73 33 48 59,5 61,2 38,4 77,9 58,5 25,4 24,7 62,8 60,6 64,3 80,2 37,4 20-40% 51,8 59,3 33,7 73,1 56,9 68,6 79 45,1 59,9 71,1 70,6 61,6 82,1 79,7 45,2 37,6 71,5 66,8 66,3 83,1 55,8 40-60% 58,5 74,2 43,8 77,6 67,8 71,9 82,9 58,4 66 65,4 80,2 72,1 84,6 84,5 57,2 49,3 79,6 76,1 75,1 83 70,9 60-80% 68,9 87,2 54,1 82,5 78,9 75,9 88,6 73,1 78,7 80,1 84,3 80,7 86,3 88,5 79,4 57,2 84,8 78,7 81,2 86,8 81,6 80-90% 76,1 85,1 65,1 82,9 84,7 76,7 93,9 81,6 85,3 88,9 90,6 84,7 89,8 91,4 80,4 62 86,9 89 79,3 93,7 90,1 90-100% 82,1 88,1 75,3 91,6 92,9 81,9 90,3 86,9 92 94,1 77,8 86,3 90,6 88,5 80,2 77,1 90,1 93,7 84,6 94 95,5 Net w eal th <20% 8,1 4,9 6,4 22 44,3 11,4 38,2 2,3 1,3 25,3 21,7 4,8 42,5 14,7 26,4 1,4 7,5 18,9 4,8 35,1 8,1 20-40% 31 69 4,6 79 24,6 71,5 89,6 23,3 50,5 71 73,1 52,6 90 94,5 19,4 2,7 88,5 75,4 76,3 96,6 45 40-60% 80,4 91,4 41,6 91,9 89,3 91,2 95,4 79,8 94,3 88,3 94,7 91,9 94,8 96,7 55,4 49,2 97,2 91 95,5 97,2 91 60-80% 91,9 93,8 81 93,7 96,6 93,2 95,5 93 97 90,1 96,4 94,4 97,1 97,5 89,4 91,6 95,6 95,5 96,4 98,7 96 80-90% 94,3 95,4 86 97,9 98 92,4 97,2 94,4 97,7 94,1 94,9 95,5 96,9 97,1 96,9 93,5 97,6 93,6 96,4 99,8 98,4 90-100% 94,5 89,7 90,6 93,8 97,3 94,8 96,9 95,3 98,4 92,2 93,9 93,6 96,5 98,6 96,9 93,6 99 92 95 98,8 98,4
Source: Own composition based on Household Finance and Consumption Survey (2016), 2nd wave. Note: Percentage of households owning
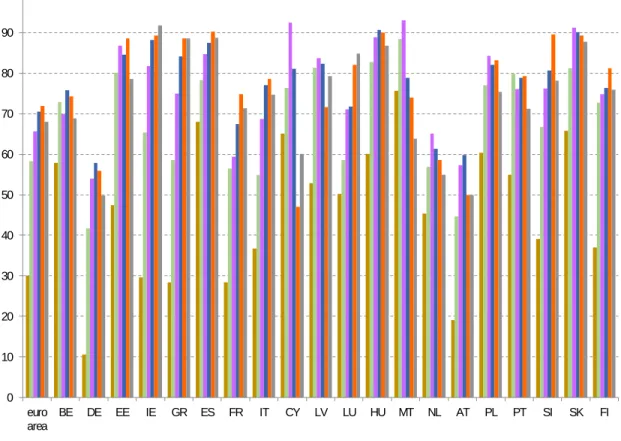
The distribution of housing wealth among households is quite skewed with household net wealth clearly linked to homeownership. Homeowners are on average and in the median considerably richer than their non-home owning counterparts in all countries. This applies regardless of the percentile in the net wealth distribution or the country concerned. Housing wealth is particularly significant for households in the fourth and fifth quintile. The comparison of wave 1 and wave 2 HFCS results highlights that the bottom quintiles of the net wealth distribution have significantly increased their homeownership rates, i.e., building up home equity through homeownership is increasingly the preferred option to accumulate assets over the life cycle. In Figure 4 we plot the breakdown the ownership of HMR by age group to better understand how households accumulate and decumulate home equity throughout the life cycle.
Figure 4: Ownership of households’ main residence (HMR) - breakdown by age group
Source: Own composition based on Household Finance and Consumption Survey (2017), 2nd wave. Note: Values in %.
We can observe that in the euro area homeownership rates are naturally much lower for the younger cohorts (aged 16-34), increase with age and peak for the age group 65–74 years old, decreasing then
0 10 20 30 40 50 60 70 80 90 100 euro area BE DE EE IE GR ES FR IT CY LV LU HU MT NL AT PL PT SI SK FI 16-34 35-44 45-54 55-64 65-74 75+
slightly for those over 75 years old. This pattern is observed across the majority of countries, with the exception of Greece and Ireland in which homeownership rates peak for oldest age group. In some countries (e.g., Spain, Portugal) the specificities of the housing market, particularly the lack of a competitive rental market and government policies to foster private homeownership, e.g., through fiscal incentives may explain the significant homeownership rates among the younger cohorts.
Possible fiscal incentives targeted to foster private homeownership include tax deductions or tax credits for mortgages, specific tax breaks for homeowners, real estate taxed at lower rates, no taxation on house-buying transactions, no taxation of imputed rents for homeowners, absence of inheritance taxes, particularly for HMR, subsidised mortgages (zero-interest loans for targeted households, long-term mortgages with subordinated repayment) and public guarantees (e.g., mandatory mortgage insurances at below market isk premium), fee-free early repayment, regulated interest rate, limits to to-value or loan-to income, mortgage equity withdrawal, property exemptions (Schelkle, 2012; Eckardt, 2018). The fiscal incentives adopted to encourage private homeownership are typically different and independent from those used to stimulate private pensions, which may generate potentially conflicting asset allocation strategies. High homeownership rates combined with house price appreciation signal high potential for equity release schemes. However, this potential is reduced by the existence of outstanding mortgages, particularly at the retirement age. For most households, accumulating home equity through homeownership involves borrowing money on the mortgage market. The extent to which owner-occupiers accumulate housing wealth towards retirement depends on the market value of HMR and on the outstanding balance of HMR (and other real estate) mortgages. To be able to quantify the size of the housing wealth, we use the concept of equity-to-value ratio (ETV) referring to the amount of housing equity that a household holds as a proportion of the value of the house. The housing equity or net value of the HMR is computed as the value of the HMR minus outstanding amount of mortgages collateralised on the HMR.3 Alternatively, the ETV is
defined as 1 minus the loan-to-value (LTV) ratio.
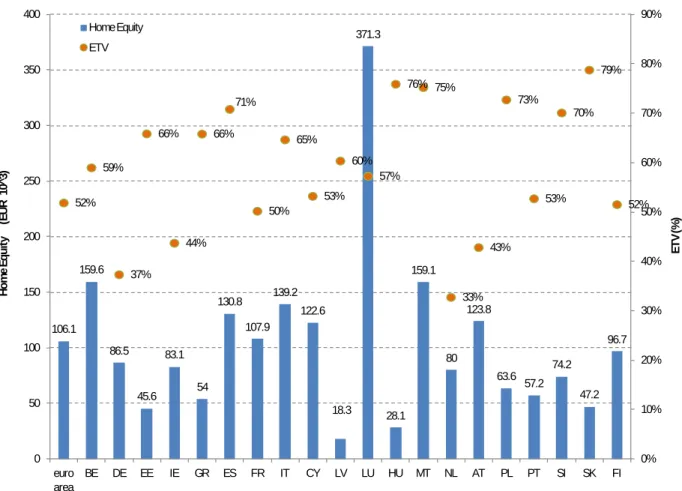
The mean home equity values and ETV ratios among all households of the euro area countries is shown in Figure 5. Differences among homeowners and countries in terms of housing wealth are a cumulative result of different initial investments in housing, housing capital gains and losses, the size of mortgage debts used to finance homeownership and the debt servicing burden. For the euro area as a whole, the mean home equity is EUR 106.1 thousand which corresponds to an ETV of 52%, i.e., the housing net wealth is nearly half of the value of the dwelling. Home equity differs significantly between countries, with the highest values recorded in Luxembourg (€ 371.3 thousand), Belgium (€ 159.6 thousand) and Malta (€ 159.1 thousand), and lowest values recorded in Latvia (€ 18.3 thousand), Hungary (€ 28.1 thousand) and Estonia (€ 45.6 thousand). The mean ETV ratios for the euro area countries ranged between a minimum of 33% in the Netherlands and a maximum of 79% in Slovakia, with ten countries showing an ETV ratio above 60%. In Spain and Portugal, home equity amounts to € 130.8 and € 57.2 thousand, corresponding to 71% and 53% of the value of the dwelling, respectively.
3 For outright owners without mortgages, the value corresponds to the value of the household main residence. For non-owners,
Figure 5: Home Equity and Equity-to-Value ratio in the euro area
Source: Own calculation based on Household Finance and Consumption Survey (2016), 2nd wave. Note: Home equity in EUR
thousands and ETV Values in percentage.
We considered the HFCS mean values for the flow of payments for HMR mortgages at time 𝑡𝑡, 𝑃𝑃𝑡𝑡, and the
outstanding balance of HMR mortgages at time 𝑡𝑡, 𝑉𝑉𝑡𝑡, to estimate the embedded mortgage annuity factor 𝑎𝑎𝑛𝑛|𝑦𝑦(𝑚𝑚). Assume equal monthly repayments (instalment + interest) during the loan period and recall that
𝑉𝑉𝑡𝑡 = 𝑃𝑃𝑡𝑡× 𝑎𝑎𝑛𝑛|𝑦𝑦(𝑚𝑚), 𝑎𝑎𝑛𝑛|𝑦𝑦(𝑚𝑚) =
�1−�1+𝑚𝑚𝑦𝑦�−𝑚𝑚×𝑛𝑛�
𝑦𝑦 𝑚𝑚
(1) where 𝑛𝑛 denotes the mortgage remaining maturity in years, 𝑚𝑚 is the instalment frequency (e.g., 𝑚𝑚 = 12 for monthly payments) and 𝑦𝑦 is the annual nominal loan interest rate. Next, without loss of generality, we assume that for all countries the annual nominal mortgage interest rate equals EURIBOR 12M (December 2016) plus a 2% spread and estimated the mean HMR mortgage remaining maturity by solving 𝑎𝑎𝑛𝑛|𝑦𝑦(𝑚𝑚) for 𝑛𝑛,
106.1 159.6 86.5 45.6 83.1 54 130.8 107.9 139.2 122.6 18.3 371.3 28.1 159.1 80 123.8 63.6 57.2 74.2 47.2 96.7 52% 59% 37% 66% 44% 66% 71% 50% 65% 53% 60% 57% 76% 75% 33% 43% 73% 53% 70% 79% 52% 0% 10% 20% 30% 40% 50% 60% 70% 80% 90% 0 50 100 150 200 250 300 350 400 euro area BE DE EE IE GR ES FR IT CY LV LU HU MT NL AT PL PT SI SK FI ET V ( % ) Ho m e E qu ity ( EU R 1 0^ 3) Home Equity ETV
𝑛𝑛 = −𝑙𝑙𝑛𝑛 �1 − 𝑎𝑎𝑛𝑛|𝑦𝑦
(𝑚𝑚)
� 𝑦𝑦𝑚𝑚��
𝑚𝑚 × 𝑙𝑙𝑛𝑛 �1 + 𝑦𝑦𝑚𝑚� (2)
Finally, we estimated the expected accumulated home equity release from mortgage monthly repayments for the next 𝑘𝑘 years, 𝑀𝑀𝑘𝑘, using
𝑀𝑀𝑘𝑘 = 𝑃𝑃𝑡𝑡�𝑎𝑎𝑛𝑛|𝑦𝑦(𝑚𝑚)− 𝑎𝑎𝑛𝑛−𝑘𝑘|𝑦𝑦(𝑚𝑚) � (3)
In those countries for which the estimated HMR mean mortgage remaining maturity was below 10 years we assumed the outstanding balance of HMR mortgages was fully repaid.
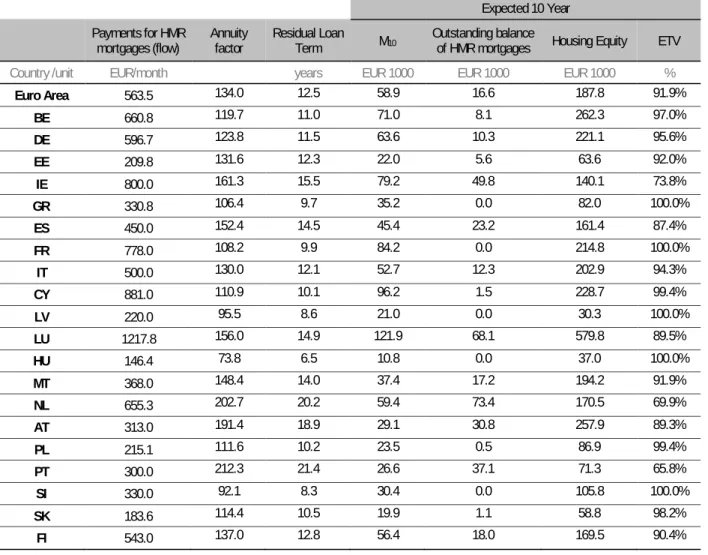
In Table 2 we report the monthly payments for HMR mortgages, the estimated annuity factor and HMR residual loan term together with the 10-year accumulated expected capital repayment from monthly instalments and the outstanding balance of HMR mortgages, housing equity and ETV ratio at the end of this period. The estimated mean residual loan term for euro area HMR mortgages was 12.5 years in 2016, with higher values observed in Portugal (21.4 years), the Netherlands (20.2 years) and Austria (18.9 years). The countries for which HMR mortgages were closest to maturity were Hungary (6.5 years), Slovenia (8.3 years) and Latvia (8.6 years).
The 10-year accumulated expected capital repayment is very significant and signals the extent to which households accumulate housing wealth towards retirement through debt repayment (regular and lump sum capital repayments). The alternative way of accumulating housing wealth is through house price increases. For all euro area households, the 10-year estimate of housing wealth accumulation amounts to € 58900, but in countries like Luxembourg it can peak to € 121900. The highest wealth accumulation is found in countries with high monthly debt burden and lower remaining time to mortgage maturity. In most countries, the amount of wealth accumulated towards retirement from debt repayment is much larger than that arising from savings and financial assets accumulation.
Depending on the remaining lifetime at retirement age, the potential for housing wealth accumulated through homeownership and mortgage loan servicing to increase monthly/annual retirement income can be significant. The magnitude of these additional income flows depends on group-specific cohort annuity factors since longevity is heterogeneous by socioeconomic group and traditional period life tables underestimate future longevity prospects (Ayuso, Bravo & Holzmann, 2017a,b, 2019).
Table 2: 10-year Expected Equity release, Housing Equity and ETV
Expected 10 Year Payments for HMR
mortgages (flow) Annuity factor Residual Loan Term M10 Outstanding balance of HMR mortgages Housing Equity ETV
Country /unit EUR/month years EUR 1000 EUR 1000 EUR 1000 %
Euro Area 563.5 134.0 12.5 58.9 16.6 187.8 91.9% BE 660.8 119.7 11.0 71.0 8.1 262.3 97.0% DE 596.7 123.8 11.5 63.6 10.3 221.1 95.6% EE 209.8 131.6 12.3 22.0 5.6 63.6 92.0% IE 800.0 161.3 15.5 79.2 49.8 140.1 73.8% GR 330.8 106.4 9.7 35.2 0.0 82.0 100.0% ES 450.0 152.4 14.5 45.4 23.2 161.4 87.4% FR 778.0 108.2 9.9 84.2 0.0 214.8 100.0% IT 500.0 130.0 12.1 52.7 12.3 202.9 94.3% CY 881.0 110.9 10.1 96.2 1.5 228.7 99.4% LV 220.0 95.5 8.6 21.0 0.0 30.3 100.0% LU 1217.8 156.0 14.9 121.9 68.1 579.8 89.5% HU 146.4 73.8 6.5 10.8 0.0 37.0 100.0% MT 368.0 148.4 14.0 37.4 17.2 194.2 91.9% NL 655.3 202.7 20.2 59.4 73.4 170.5 69.9% AT 313.0 191.4 18.9 29.1 30.8 257.9 89.3% PL 215.1 111.6 10.2 23.5 0.5 86.9 99.4% PT 300.0 212.3 21.4 26.6 37.1 71.3 65.8% SI 330.0 92.1 8.3 30.4 0.0 105.8 100.0% SK 183.6 114.4 10.5 19.9 1.1 58.8 98.2% FI 543.0 137.0 12.8 56.4 18.0 169.5 90.4%
Source: Own calculations based on Household Finance and Consumption Survey (2016), 2nd wave data.
3. Managing and accessing housing wealth: A typology of Equity Release Mechanisms
Reverse mortgage financing first appeared in the UK in the early 1930s in a form of Home-Equity Release plan (home income plan). In the USA, ERS began in the 1980s in the form of Reverse Mortgage Products and quickly expanded to other countries, particularly English-speaking countries (Canada, Australia, New Zealand and the UK) adopting alternative definitions and formats. Traditionally equity release mechanisms such as downsizing (trading-down, i.e., moving to property of a lower value) or trading-out (moving to non-owned property) required sale of the home to fund current and future financing needs or, in cases where a move was to be avoided, demanded restructuring by taking a second mortgage on the property.
Although relatively simple and still common in practice, such approaches are potentially inefficient and inappropriate ways of accessing housing wealth to pay for regular consumption expenditures or healthcare
expenses since they carry significant costs (e.g., property sales taxes, capital gains tax and conveyance tax on the purchase of new house), they release all of the available wealth in one hit, they force individuals to move to other property and are unfeasible for those individuals needing care in the home or home adaptation. Empirical evidence shows that older people generally prefer to stay in their family home as long as possible. In recent decades financial deregulation and financial innovation introduced new and more flexible forms of equity release that allowed individuals to withdraw from their housing equity while continuing to stay in their home, usually by adding to existing mortgage balances but continuing to use the home as collateral (Smith & Searle, 2008). These new forms offer new possibilities but carry new and different risks (e.g., interest rate risk, inflation risk, house price risk, negative equity risk) that have to be addressed.
In this section, we extend the analysis in Ong et al. (2013) and OECD (2013) and outline a typology for characterizing the different forms of equity release (Figure 6). We distinguish between two main forms of ERS based on whether the equity release is made possible while continuing to stay in their home or through a sale of the house but other differences in design could be used to differentiate among the many alternatives presented (e.g., time of release, owner of the property, amount of equity released).
An ERS transaction typically involves two counterparties: homeowners (equity extractor) and cash providers (banks, other mortgage lenders, reversion company, insurance companies, real estate companies). Under the sale model, the homeowner sells his or her home to release housing equity, while the cash provider is typically the property buyer. Under the in situ ERS mortgage, homeowners simply withdraw equity by borrowing money from a lending institution that originates the mortgage loan while remaining in situ (Ong et al., 2013).
In ERS involving selling the main family home and moving, the equity extractor typically moves into another dwelling releasing housing equity in at last one five main ways. First, homeowners extract cash by moving from an owner occupied house into a rental accommodation. In this case, the net amount of equity released equals the equity stored in the home (gross sale price of the home, net of outstanding debt, taxes and trading costs). Second, a homeowner may trade down homeownership by moving into a less expensive house, for instance a house that is spatially small or has that has less bedrooms, or moving to a less expensive residential area (e.g. countryside, moving abroad). This process of extracting home equity is usually called downsizing. The amount of equity released via downsizing equals the difference between the equity stored in the house sold and the equity stored in the new house (purchasing price net of debt secured against it).
Third, homeowners may use the equity stored in the home to purchase a more expensive home. In this case, equity release may exist if the homeowner engages in a new larger loan to finance the purchase of the more expensive home, i.e., if he prefers to holds less housing equity after the move. This process of extracting home equity is called over-mortgaging. The net amount of equity released via over-mortgaging equals the difference, if positive, between pre-move housing equity and post-move housing equity.
Fourth, homeowners may sell their homes and move into another (owner occupied or rental) accommodation as a result of divorce or emigration. In the case of divorce, the net amount of equity released can often be negative as a consequence of the household's assets splitting process.
Figure 6: Typology of Equity Release Mechanisms
Source: Own composition based on Ong et al. (2013), OECD (2013) and French et al. (2017), with author's additions. Equity Release
Schemes (ERS)
Sale of home
Sell and move
Rent Downsizing Emigrate, divorce over-mortgaging Moving to a third-party home Residential & nursing care homes home of another relative
Sell and stay (home reversion schemes) Property passes upon sale Sale and leaseback shared ownership shared ERS Property passes
upon death mortgageSale and
In situ mortgage ERS
Stay and not sell
Refinancing, additional loan Flexible mortgage,
HELOC, deferred loan
Stay and sell
Reverse mortgage
SAMs, Deferred mortgage
Finally, homeowners may sell their homes and move into a third-party home and opt not to purchase a new home. Two main options seem to emerge here. One involves transferring home equity by inheritance and moving into the home of a relative, for instance with their children or grandchildren. Another one, more likely at advanced ages, involves moving into a residential care home or to a nursing care home. The net amount of equity released via moving to a third-party home equals the value of pre-move housing equity. Alternative solutions involving moving children into their own home in a shared ownership set up are also possible but more likely to fall into the category of 'sell and stay' equity release schemes and will generate lower equity release.
In ERS involving selling the main family home and staying the equity extractor sells all or part of their home, cashing in an amount which is typically less than 100% of the market value of the dwelling, but are granted the right to continue to live there after the sale has occurred or voluntarily vacates the home. The “security of tenure” gives the seller the right to live in the home for life. The price at which the property is sold takes into account a number of variables including the homeowner’s (individual or joint) life expectancy, a discount rate, expected house price appreciation and volatility, maintenance and insurance costs, among others. The equity extractor may receive an annuity, a lump-sum, or a mix of the two through programmed withdrawals, often with preferential tax treatment. Although the home reversion company owns your home, you don’t pay rent and since it is not a loan so there are no capital repayments or interest charges.
Sell and stay’ options are typically executed through home reversion schemes (Ong et al., 2013). Two main types of products typically fall under the home reversion scheme: (i) those under which property passes to the cash provider upon sale of the property and (ii) those under which property passes to the cash provider upon death of the homeowner or he voluntarily vacates the home. Under the sale and leaseback model, a homeowner typically sells all of his property in exchange for a lifetime lease. The ownership of the property thus passes totally to the cash provider upon sale of the property.
Under the shared ERS model, a homeowner typically sells part of his property in exchange for a lifetime lease, which can be incremental. The property title passes partially to the cash provider upon sale. Known as staircasing down in shared equity schemes, these mechanisms imply that the original owner rents increasing portions of the dwelling as time passes (Monk & Whitehead, 2010). If the homeowner originally sold less than 100% of the house, he is entitled to receive the remaining value when he moves on from the property. Under the shared ownership model, a homeowner transfer's part of his home equity by inheritance to a relative but continues to live there after the sale has occurred, eventually with relatives. Under the sale and mortgage model, the owner sells a percentage of the property to a reversion company and takes out a mortgage (in the sense of collateral) secured on the property, retaining the title of the property.
In home reversion schemes, the new owner (or co-owner) can be the reversion company itself or an investor (a company or a private individual), in which case the reversion company acts as a middleman. The net amount of equity released via home reversion schemes is normally higher under the sale and leaseback model than under the shared ERS or shared ownership models.
In situ mortgage ERS products emerged at the beginning of this century supported by historically low interest rates and increasing house prices. Two main types of products typically fall under this category: (i) those in which property is not transferred to the cash provider and (ii) those under which property passes to the cash provider late in the contracts life. Under the 'Stay and not sell' model, a number of ERS structures exist, some involving refinancing an existing mortgage to release additional housing equity, others executed for instance through a second mortgage against the primary collateral (home). Contrary to home reversion schemes, in these loans regular repayment starts at contract initiation (OECD, 2013).
More recently, innovative structures like flexible mortgages, secured loans that operates like an overdraft facility allowing the borrower to add to his or her mortgage without having to undergo a new application process with the possibility of flexible reimbursement (e.g., through early repayment of the loan, overpayments, lump sum injections, underpayments, taking payment holidays) and provide the homeowner-borrower access his or her housing equity up to some agreed limit, gained popularity in countries like as Australia and UK (Smith et al., 2002).
Other options include the home equity line of credit (HELOC), under which homeowners can use a line of credit to borrow funds up to some maximum amount within an agreed period using the primary home as collateral, and several types of deferred loans, which permit the release of equity housing by deferring the loan repayment (interest and/or capital) till a later date, adding to the outstanding mortgage loan balance. Under the 'Stay and sell' model, the main type of equity release scheme is called reverse mortgage (also called lifetime mortgage, annuity reverse mortgages or home income plans). Under reverse mortgages the provider lends the homeowner cash and takes a mortgage charge over their property. Payments can be made as a lump sum (to meet retirees) financial needs, as an income stream (for life or a fixed term) to supplement other pension benefits or, less frequently, as a line of credit. The borrower has normally to be above a certain age and the loan-to-value ratio (maximum amount that can be borrowed) increases with age. Typically, reverse mortgages do not require any repayments during the contract, i.e., during the homeowner's lifetime. The loan is repaid from the property sale proceeds when the owner-occupier dies or if he move out of it (for instance into a care home), although the customer can repay earlier for other reasons. In this case, early repayment charges are charged by the cash provider.
Reverse mortgages typically provide four guarantees for the borrower (Philips & Gwin, 1993): (i) Residency Guarantee: The homeowner may remain in the property until death, regardless of the loan balance; (ii) Repayment Guarantee: there is no repayment obligation until the homeowner dies or sells the home; (iii) Nonrecourse Guarantee: The homeowner`s other assets cannot be used to re-pay the loan, i.e., the final borrowers repayment capped at the realized value of the mortgaged property; (iv) Income Guarantee: The income support continues as long as the homeowner lives in the home.
The mortgage may come in many forms depending on the way interest payments are made and when they are paid (FSA, 2005): (i) a home income plan; (ii) an interest-only mortgage; (iii) a roll-up mortgage (interest is added to the loan periodically); (iv) a fixed repayment mortgage, or (v) enhanced lifetime mortgages.
• Under home income plans, homeowners take out a loan secured against the value of the home in exchange for a cash lump sum. They can borrow a sum of money up to a maximum loan to value (MLTV) ratio defined by the cash provider depending on their age (and partner's age if applicable). The lump sum is then used to buy a traditional flat annuity from an insurance company or an annuity provider. Annuity benefits are used to pay the interest on the mortgage and regular retirement expenditures. The amount originally borrowed is repaid only when the house is sold; • Contrary to home income plans that are hybrid equity release schemes using a combination of
lifetime mortgage and an annuity, interest-only mortgages requires only the interest charged by the lender to be paid back on a monthly basis. The loan is secured against the value of the home and repaid eventually only when the house is sold;
• In Roll-up mortgages homeowners take out a loan secured against the value of the home as regular income or a cash lump sum but are not required to pay the interest on the loan until the house is sold. As a result, interest is added to the loan outstanding debt. Because of this, the amount of equity released via this option tends to be relatively small, and the smaller the younger the homeowner is. A variant of this roll-up mortgage is called drawdown mortgage and differs in that instead of taking the amount borrowed as a single lump sum, borrowers withdraw smaller amounts on a regular basis (e.g., monthly) based on their age(s) and their property's value at the outset of the scheme. Some types of scheme offer extra flexibility by providing a cash reserve facility which can be used when needed to pay for unexpected expenses. Compared to the case where the lender takes a lump sum at contract inception, in this case the outstanding debt grows slowly since the lender withdraws smaller amounts on a regular basis, eventually generating higher retirement income compared to home income plans.
• Fixed repayment lifetime mortgages differ from the previous options in that instead of being
charged interest on your loan, the borrower agrees to pay the lender a fixed higher sum than the amount borrowed when the house is sold.
• Enhanced lifetime mortgages (also known as ‘impaired’ lifetime mortgages) differ from standard
lifetime mortgages in that if the health and lifestyle of the homeowner are assessed to be relatively poor the equity release terms are enhanced by offering reduced interest rates or by increasing the maximum lump sum that can be released.
For most reverse mortgages the interest rate is fixed for life at the beginning of the loan. The same applies to home income schemes. For the particular case of drawdown schemes, the fixed rate prevailing at the time of each advance is taken. Variable interest reverse mortgages are usually linked to the lender's standard variable rate. Most equity release schemes include a "No Negative Equity Guarantee" (NNEG) feature through which the cash provider guarantees the borrower that the redemption amount of the mortgage will be capped at the lesser of the face amount of the mortgage and the net sale proceeds of the
home, meaning you will never owe more than the value of your property (Hosty et al., 2008). The likelihood of negative equity claims arising increases if borrowers systematically live longer than predicted at the contract outset.
Alternative products include home reversion schemes with Shared Appreciation Mortgage (SAM), under which the cash provider (lender) agrees to accept some or all loan repayments in the form of a share of the increase in value (the appreciation) of the property. Lender and borrower agree on the contingent interest amount, i.e., the percentage amount of appreciated value which will be due on the sale of the property. In return for this added compensation, the cash provider agrees to charge on the loan an interest rate below the prevailing market interest rate. SAMs share house price risk between the borrower and the cash provider and in a market appreciation scenario have the potential to release additional housing relative to standard reverse mortgages. The amount of equity withdrawn before application of taxes or other costs in reverse mortgages is typically less than 100% of the value of the property. Finally, in some cases it is possible to charge the home to allow costs and expenses to be accumulated against the value of the property.
Although there are different ways in which homeowners may release their housing wealth, the most common arrangements in the market are reverse mortgages and home reversion schemes. Table 3 summarizes the key design differences, advantages and drawbacks of these two arrangements.
We can observe that reverse mortgages and home reversion schemes involves alternative forms of property deployment and ownership, the likely transfer of the responsibility for property maintenance, the exchange of cash flows in different time periods, common and divergent approaches to longevity, inflation, bequest, liquidity, moral hazard, adverse selection and litigation risks. There are a number of alternative (and sometimes complementary) routes by which households may release their housing wealth over the lifecycle. The preferred option depends on the personal situation of the homeowner (e.g., age-specific needs, the health situation, the psychological attachment to the house, the consumption and control use of the home, bequest motives, security and safety net motives, inter vivos transfers) and the context (e.g., the market value of the home, the housing market situation and the accrued capital gains, the significance of the investment motive, the availability of suitable financial products). Family life cycles are nowadays much more complex than in the past, with often broken patterns of asset accumulation (e.g., due to divorce, property inheritance, fraud/theft, the need to help a relative or spending shocks) that demand higher flexibility in accessing housing wealth over the lifecycle.
From the above discussion it is also clear that unlocking housing equity does not automatically involve the existence of a financial product like a reverse mortgage or a home reversion plan. For instance, for those living in a large house, trading down the house and moving to a smaller owner-occupied dwelling is a clear option offering individuals the possibility to live rent-free in an owner-occupied house without being dependent on a financial institution. A number of different stakeholders are involved in ERS, including households, providers, regulatory authorities responsible for supervising financial markets, financial institutions and financial intermediaries and the State.
Table 3: Main ERS design differences and risk characteristics
Reverse mortgages Home reversion schemes
Time of home Sale End of contract Onset of contractual
Owner of the property Consumer Provider only (for total sale); Consumer and Provider (for partial sale)
Maintenance of the property Consumer Provider (where not transferable and transferred to the tenant)
Crossover (NNEG) Risk Yes No
Profit from increased house
prices Consumer Provider only (for total sale); Consumer and Provider (for partial sale)
Loss from fall in house prices Consumer but also the Provider if NNEG is activated Provider only (for total sale); Consumer and Provider (for partial sale)
Repayment of Principal Possible with penalties None
Interest Payments due Possible in home income plans and interest-only mortgages No
Capital Payments due No No
Cash Provider Banks and some other mortgage lenders Insurance, reversion company, other provider
Percentage of equity released Typically less than 100% Typically 100%
Obligation to carry out repairs
and maintenance Typically yes Typically yes
Consequences of payment
default and insolvency Foreclosure, loss of the property and personal bankruptcy Possible
Reasons for termination
inadequate property insurance, vacancy of property, fraud or misrepresentation, unauthorised occupation, overdue payment, unauthorised sale and bankruptcy
inadequate property insurance, vacancy of property, fraud or misrepresentation, unauthorised occupation, overdue payment, unauthorised sale and bankruptcy
Portability of products Possible Possible
Entitlement to the surplus
following repayment Consumer designated beneficiary Provider only (for total sale); Consumer and Provider (for partial sale)
Longevity risk protection Yes Yes
Investment risk protection No No
Inflation risk protection No No
Provision of bequest Possible Possible
Provision of liquidity Limited No
Tax Incentives Yes No
Property fitted to old-age needs Not necessarily Not necessarily
Dependency risk protection No No
Antiselection risk Yes Yes
Moral Hazard risk Yes Yes
Litigation risk Yes No
Source: Own composition based on Reifner et al. (2009), with author's additions. Notes: NNEG = Non-Negative Equity
4. Obstacles and challenges to Equity Release Mechanisms development
As outlined earlier in this paper, the feasibility and potential of home equity release mechanisms to complement retirement income is high but unequally distributed across EU Member States. The market for equity release schemes is well developed in some countries (e.g., UK, US, Australia) but inexistent in the most countries around the world (Reifner, 2009). The actual and potential role equity release schemes in supplementing retirement income depend not only on both demand and supply market factors but also on regulatory efforts and public policy interventions. In this section we briefly highlight the main barriers that need to be defeated to build a fair, efficient, transparent and competitive market for ERS.
4.1. Demand-side barriers and challenges
On the demand side, for the key middle income tier the main challenges to the development of ERS schemes include (i) normative attitudes towards inheritance; (ii) towards making financial provisions for retirement; (iii) towards the responsibility for financial provision in retirement; (iv) cultural and psychological barriers; (v) aspirations relating to HMR property; (vi) low financial literacy levels, the role of property and debt in households wealth and, (vii) risk aversion and poor value-for-money perception and incentives and disincentives presented by means-tested benefits:
(i) Normative attitudes towards inheritance: In many European countries there are strong
normative orientations towards considering the HMR as a family asset to passed-down through generations. As a result of bequest motives, there is some reluctance to consider ERS as a valid option since in both loan and sale models of equity release schemes it reduces the inheritance amount households can leave to their descendents. The importance of the inheritance motive as demand constraint to ERS is likely to be weaker for families that do not have children or heirs, or that do not have a close relationship with them. In those cases in which children/grandchildren do not need a substantial inheritance since they are financially well off, or in ERS that give heirs the option to repay the mortgage. In other cases, children would prefer an early inheritance, i.e., to have some of their inherited wealth in the present rather than waiting for the ascendants' death, something that may determine the type of ERS chosen.
(ii) Normative attitudes towards making financial provisions for retirement: households may
envisage differently housing property as an appropriate way of making financial provision for retirement given its risks, expected return and illiquidity), particularly when compared to other (financial) pension assets. The deeper the aspirations towards acquiring and owning the HMR during working live the higher the feasibility of ERS.
(iii) Normative attitudes towards the responsibility for financial provision in retirement: The
way households consider their role in guaranteeing financial independence in retirement has a significant impact on the demand for ERS. If homeowners consider they should not have to use the equity in their homes to augment retirement income and pay for, e.g., health-care or
long-term care expenditures, if they believe that releasing home equity is a last-resort solution or if there are reluctant to spend their own money (compared, for instance, to use government subsidies or allowances) the demand for ERS is expected to be low. Contrarily, if individuals believe the responsibility for financial security in retirement should lie mainly with the individual, or that they should profit from the money, time and effort invested for decades into their homes, there is a potential demand for ERS.
(iv) Cultural preferences: Preferences with respect to the provision of housing services
(renting/owning/sharing), mobility (staying/moving), equity release (selling/leveraging), and inter-generational disposals (lifetime, on death, in full, partial, not at all) have an impact on the potential household appetite for ERS solutions and overall market attractiveness (Hoekstra et al., 2018).
(v) Normative attitudes towards the role of property and debt: To the extent that households
envisage and hold residential property as a consumption good, a place to live and enjoy housing services, and minimize the investment function of housing, there is little room for ERS. Similarly, homeowners spend a significant part of their working lives servicing a mortgage negotiated to become homeowner. For them, paying off the mortgage is a key milestone. Equity release schemes may thus be seen as bringing the household back into a mortgaged contract (Williams, 2012). The higher the reluctance to acquire any kind of debt, the lower the market potential for ERS development.
(vi) Financial literacy issues: In many countries, there is still a lack of knowledge and significant
misconceptions and fallacies about ERS products. To the extent that these problems persist and there are no public and private campaigns to increase the awareness of ERS, the market demand will be low. Given the complexity of the financial products involved which demand a considerable level of financial literacy from consumers, there is a need for more transparent and objective information on ERS, a significant room for independent regulated financial advice and appropriate micro-prudential and behavioural regulatory intervention but also for public initiatives, in particular tailored to the needs of elderly people.
(vii) Value-for-money and risk considerations: In many markets there is a common perception
that ERS are not good value-for-money deals, that significantly reduce the market value of the home by offering low loan-to-value (LTV) contracts, that ERS products and providers are not trusted, that there no suitable consumer protection. The low LTV ratios are a consequence of the contract nature (in home reversion schemes, they discount the absence of any rent to the provider; for lifetime mortgages, they reflect the interest being compounded over the life of the loan and the non-negative equity guarantee) and transaction costs. The magnitude of the transaction costs involved and taxation considerations also reduce the attractiveness of ERS products. Finally, risk aversion considerations (ERS are unfamiliar and deep forward looking contracts) and concerns over losing the control of their house to the ERS provider if households fail to meet the terms and conditions of the contract or as a result of fraudulent operations are also important.