A Work Project, presented as part of the requirements for the Award of a Masters Degree in Management from the NOVA – School of Business and Economics.
WP STRATEGY
InovCity – Structure of Trials Evaluation
Inês Almeida Campos Moreira
Nr. 734
A Project carried out on the Management course, with the supervision of:
Professor Luís Catela Nunes
2
Contents
1. Introduction ... 3
2. Portuguese and British Cases ... 5
2.1 Portuguese Case – InovCity ... 5
2.2. The British Case ... 9
3. Evaluation Structure – Master Guideline ... 11
4. Great Britain: Results and Conclusions... 20
5. Suggestions to InovCity ... 23
6. Conclusion ... 24
7. References ... 25
Abstract and Keywords
In 2007, the UK government commissioned the Energy Demand Research Project to conduct a large scale experiment of smart metering technologies to test the impacts from many different forms of feedback to residential consumers. A full evaluation of the results was completed in 2011.
In Portugal, EDP is also conducting smart meter trials in a project called InovCity in the city of Évora whose results will be evaluated during 2012. In this work, the case of Great Britain is studied as a reference on how an evaluation of trial results should be conducted. I also discuss potential limitations of the experiments, implications for national roll-out decisions, and finally draw some lessons that can be applied to the Portuguese case.
Key Words: Smart Meters, Electricity Consumption, Household Demand Trials, Evaluation
3
1. Introduction
On a global scale, one of the big challenges faced in this century is to contribute to a more sustainable economy protecting the environment. The world population is steadily growing, the consumption of water and electricity is increasing, we are running out of fossil fuels, and the concern about the environment is becoming more significant due to significant climate change. Some countries are already aware of this problem and have realized that their ability to produce energy is compromised; the appearance of Smart Grids is a response to these challenges. Smart grids are designed to provide the information grid and smart equipment capable of automating the management of energy, thus improving the quality of service, lower costs, increase of energy efficiency and also the grow of environmental sustainability. Smart grids also integrate the actions of all users connected to it in order to efficiently deliver sustainable supplies. Its main objectives are the following:
Adding value through active management and efficiency of consumers’ consumption;
Contributing to household savings;
Reducing carbon emissions;
Encouraging energy efficiency.
The main aim of these projects is to give people enough information about their consumption, like historic feedback, making use of various devices, special tariffs, among other interventions, with the goal of encouraging them to manage their consumption effectively. A variety of trials have been or are being tested around the world, to analyse the different solutions and the different impacts of energy equipment such as smart meters and different displays, as well as the impact of different
4 interventions. After these tests, the evaluation of those results is essential for a decision on a national roll-out which should be preceded by a cost-benefit analysis.
Italy was the first country to replace already existing old meters by smart meters. The trials began in 2000 and lasted until 2005 with an investment of €2,000 million. Enel Spa, the company that was in charge of the deployment, started the national roll-out in 2006, installing 32 million smart meters. It is classified as the world’s largest smart meter deployment. Other developed countries have also joined the Smart Metering Implementation Programme, like Japan, China, Canada, Great Britain, United States, Australia and New Zealand, Nordic Countries and Spain.
My Work Project will focus mainly on Great Britain’s case to draw a parallelism with the Portuguese one. Between 2007 and 2010 four energy suppliers conducted the trials in Great Britain in over 60,000 households. This recent case has been chosen due to the fact that this pilot test has passed through several phases of evaluations/audits which are publicly available for analysis, therefore making it a good case to my Work Project.
Based on the documents available about Great Britain’s case, my contribution with this work will be to define a master guideline of how to produce an independent evaluation of trials, point out critical points, which factors have to be evaluated and how. The evaluation will be focused on the residential/domestic consumers, since they are the key to the success of such a project. The British case will also contribute at the end to draw conclusions and make recommendations for the Portuguese case since in Portugal, the trials are still running in Évora and only afterwards a decision about a national roll-out will be taken.
5
2. Portuguese and British Cases
2.1 Portuguese Case – InovCity
Like other developed countries, Portugal has decided to implement smart grids and has chosen Évora to carry out several pilot tests. The Portuguese company EDP (Energias de Portugal) has called it the first InovCity. The trials began in early 2011 and smart meters have been installed in 31,000 households with an investment of €15 million. EDP-Distribuição is in charge of this project and carries out the function of Distribution Network Operator (Operador de Rede de Distribuição), whose activity is regulated by
Entidade Reguladora dos Serviços Energéticos (ERSE).
Smart grids, known as InovGrid in Portugal, are growing at a significant rate due to the increasing consumption of energy worldwide and the increase of CO2 emissions, which
pose a threat to environmental sustainability. The InovGrid in Évora consists of four main features:
Giving consumers the ability to manage their energy efficiently;
Encouraging them to become microgenerators, i.e. encourage them to produce and sell energy at home with implementation of photovoltaic solar panels;
Introducing electric vehicles with the creation of public supply points;
And also replacing traditional public lightning by LEDs in some central areas and installing light regulators and presence sensors.
By embracing this huge project, InovGrid, Portugal becomes more attractive to possible investments, more sustainable through the lowering of CO2 emissions and fossil fuels
consumption, and more efficient by optimising energy systems. The distribution of energy becomes more innovative with the automation of grids management, more
6 dynamic since the direct relations between customers and energy suppliers gets closer, more efficient due to the reduction of operating costs, and also more sustainable relying on a reduction of energy consumption and CO2 emissions.
As we know the development of a new product or service can only be successful if the product or service brings benefits to all stakeholders. Smart Grids bring advantages for everyone, from consumers, who can also now be generators, to the market and the country as a whole. The different stakeholders present in this project are:
EDP, EDP-Distribuição;
Domestic and non-domestic consumers;
Energy suppliers;
Inhabitants of Évora;
ERSE (Entidade Reguladora dos Serviços Energéticos);
Environmental groups.
As I explained before, my work will focus on Domestic Consumers. This project is the solution to solve two big problems faced by EDP-Distribuição: firstly, the low-voltage grid didn´t allow the gathering of information about customer consumption, and secondly, problems in the grids were only detected when the customers informed the operators about the faults. Now, the information has two-ways of communication: the domestic consumers can check their consumption and operations every 15 minutes and the operator can prevent faults from occurring or even solve problems without going to consumers’ place. The Energy Box (EB) was provided to all domestic consumers in Évora and the In-Home Display (IHD) was just distributed to a small test group.
7 The existing meters were replaced by Energy Boxes (EB) shown in Figure 1, which is the device that does the consumption reading on which consumers can access detailed information concerning Kilowatt (kWh) already spent. This information will transform estimated bills into actual consumption bills which will be read automatically every month. To do an assessment of quality of any equipment or service, there is always the need to have trial groups and control groups, whose consumptions are being monitored to detect discrepancies between these two groups. EDP is comparing the consumption of Évora’s consumers who have received those Energy Boxes, and the consumption of a control group in Montemor-o-Novo who does not possess any equipment, does not even know about the project and that they are being part of the trial. The control group of Montemor-o-Novo was chosen for being the nearest town to Évora, with similar climatic and socioeconomic characteristics, which allows the comparisons between both groups.
The Figure 2 shows the In-Home Display (IHD), which is connected to the EB and has a lot of features, it gives the consumers direct feedback: it allows consumers to monitor and control their consumption throughout the day and to find out exactly when, how and where they are consuming energy. The IHD also shows when the electricity is at a more favourable price, giving consumers the opportunity to program their appliances accordingly. Consumers will be able to compare historical consumptions, check if they
Figure 2 - In-Home Display Figure 1 - Energy Box
8 are using more or less energy comparing to past months or years. With this project, the profile of each consumer will be analysed and new services and new tariffs will be suggested in order to make them benefit as much as possible. It will be possible to change tariffs and change energy suppliers without leaving home. All the services mentioned above can also be accessed online anywhere.
Under the InovCity, several services with different degrees of complexity and need regarding customer involvement have been tested. Instantaneous direct feedback in combination with indirect feedback is the basis to reach a reduction in energy demand. Direct Feedback is supplied in real time: this includes information provided by In-Home Displays and by useful and easy readable information taken from computer softwares. Indirect Feedback will be provided after the consumption: SMS (Short Message Service) will be sent to consumers with the details about consumption levels, summary reports about the most relevant information to the client, frequent bills based on readings plus historical feedback, which allow comparison with previous periods, as well as different types of tariffs. There are three different types of tariffs:
Tri-horária Simulada – offers a simulation of a three-hourly rate (horas de ponta, cheias e vazio)1
Escalões de consumo – defines levels of consumption with rising energy prices to encourage customers to avoid the higher echelons;
Objectivo de kWh – Sets a “kWh package” regarding the contracted power in order to encourage customers not to exceed the indicated consumption.
1
9 Domestic consumers can also become generators/suppliers selling energy to the grid by installing photovoltaic solar panels or mini turbines in their homes. In addition to selling energy being profitable to consumers, if a fault occurs in a residential area, the energy generated by a neighbour can guarantee the supply of electrical energy to several other houses in the neighbourhood. In short, the implementation of this program will bring to EDP-Distribuição four positive aspects:
Better quality of service;
Better operational efficiency;
Fewer energy losses;
Greater integration of renewables.
The trials in Évora just started in early 2011 and the European Union forecasts point out that by 2020 approximately 80% of Europeans will have access to smart meters.
2.2. The British Case
The British case has been chosen to make a comparison with the Portuguese one, due to the fact that trials have been made recently, the documents about evaluations and audits available, and also given the decision for a national roll-out. Another important factor for this choice was the complexity of entities involved in one of the hugest project ever made in Great Britain. The organizations with responsibilities in the project are: the government, more specifically the Department of Energy and Climate Change (DECC); Ofgem, a non-ministerial department; several energy suppliers; National Audit Office and the consultant AECOM. The trials that cost £9.75 million were half funded by Ofgem and DECC and half funded by the four energy companies that ran the trials:
10 EDF Energy Customers Plc, (EDF); E.ON UK Plc, (E.ON); Scottish Power Energy Retail Ltd, (Scottish Power) and SSE Energy Supply Ltd, (SSE).
In three years, from 2007 to 2010, trials were made by these four energy suppliers, substituting the old meters by smart ones and applying various and different types of intervention in over 60,000 households. The main purpose of these trials was to measure the impact of the different tested equipment, tariffs and services on the consumption of domestic consumers. The different types of intervention tested in Great Britain were: self-reading of smart meter2, Real Time Displays3 (RTD), accurate billing, monthly bill with additional data to allow comparisons with previous periods, energy efficiency advice, information through TV, incentives to reduce consumption with reward of 5% off the bill, usage reduction alert with audible alarm if consumption exceeds predefined daily level, heating controller integrated with RTD and the Time-of-Use tariff that encourages shift from peak period consumption. All these interventions, some considered direct feedback and others indirect feedback, have contributed to measure the impact on consumer behaviour and find out the reduction of energy consumption. These results will be presented below in the section of “Great Britain: Results and Conclusions” after the section on how to structure an evaluation of trials and what conclusions can be drawn from it.
In 2010, after evaluating the trials, DECC announced its intention to have smart meters in all homes by 2020 with the official roll-out starting date in 2012. The National rollout involves visits to more than 27 million homes to install smart meters. Analysing such a different project in another country, it must be recognized that direct comparisons may not be totally correct due to different cultures, the different nature of energy markets
2
Smart Meter, known in Portugal as Energy Box
3
11 and the different policy and commercial drivers for a smart meter roll-out. But there are always some points and aspects that we can take advantage of and learn from.
3. Evaluation Structure – Master Guideline
As mentioned before, EDP already has some values about possible reduction in customers’ consumptions. Values alone are difficult to understand, it is necessary to explain all the criteria and methodology used to reach these values. Therefore, with this section I intend to explain how to structure an evaluation of trials, explaining all steps and points that need to be mentioned. It may serve as a guide for EDP in the future when they will have to present and explain the obtained results to ERSE (Entidade Reguladora do Sector Energético). To present this independent evaluation of trials, I will follow the line of the British report Energy Demand Research Project Final Analysis produced by AECOM in June 2011. The main objectives of this kind of report is to describe the interventions made by the energy supplier(s), the methods and criteria used to identify limitations and implications of the obtained results for a possible national roll-out, i.e., to what extent the results can be extrapolated to all the population.
In general, the structure of the report referred above should contain the following sections:
1. Introduction 2. Trial Design
3. Analysis of Energy supplier Data
4. Findings in the Context of the Literature 5. Practical and Technical Issues
12 1. As regards the introduction, it is essential to explain the importance of the report and to state who has produced it, since it will present the findings obtained in the whole project, which are one of the major inputs to decide whether or not on a national roll-out. The report should explain the complexity of the pilot-test project, how it was carried out and the entities involved in it. The years in which the trials were performed must be enlightened, the different interventions made by the energy supplier and the organization(s) that funded the trials should also be explained. The variables that will be evaluated and their nature should also be mentioned. In the case of InovCity, the evaluation will have a quantitative component based on the variation of the customers’ consumptions, as well as data obtained through surveys that will constitute a more qualitative information.
2. In the section of trial design it should be explained how the trials were prearranged. A well prearranged trial design will contribute to minimize bias and maximize the precision of the results. This section will be divided into two distinct parts: Trial Groups and Recruitment.
A credible evaluation of trials needs to have Trial Groups and Control Groups whose variables, in this case their respective levels of consumption, will be compared. The trial group is a group of individuals that should be chosen randomly to be representative of a certain population that will receive a treatment or an intervention while the control group is chosen in the same way but does not receive any treatment or intervention. This ensures that any differences in the variation of consumptions, as well as the degree of consumer satisfaction, can be found between the groups are only due to the interventions in test. These control groups are not warned that they are being part of a trial, thus preventing them from changing their behaviour and compromise the test results. The type of sample should also be necessary to mention, i.e., the type of
13 population studied in the trials and if it was a random sampling or a stratified sampling. Having explained the type of population used, it is required to describe how the groups were assembled and stratified, the different interventions tested in each of the groups and their dimension.
As regards the Recruitment, the method of how it is accomplished is vital to avoid biasing the data. The recruitment method must be thoroughly described, the arguments used to persuade them to take part in the trial and the way they were approached, either by a phone call, through direct approach, by an email, or any other way. It is important to mention if the individuals had the choice of participate in the trials or not, if there was any pressure; and in this case there must be a reference to the success rate of recruitment. It should also be explained if there were any contractual conditions to participate, what information was passed, if there was any financial or any other incentive to take part in the trials, in order to understand if there was sample selection bias. For this purpose, it is necessary to implement statistical techniques to correct the possible bias.
At this stage it would be useful to divide the trial groups and mention the dates in which the recruitment of each group was made, the date of installation of equipment and provided services, and at least to mention the date in which the trials were conducted, i.e., the date in which the consumptions were observed. It is important to control of the timing, because there may always be some learning curve in using the equipment or service.
3. About the Analysis of Energy Supplier Data, two types of data will be evaluated, the data of consumptions variation, and data from surveys made to consumers.
14 By analyzing the changes in energy consumption, two variables will be evaluated: the total consumption and the time-of-use. For a complete analysis of data it is not enough to assess just the variation of the total consumption, it is also necessary to do a Time-of- Use analysis. For instance, with Time-of-Use tariffs consumers have an incentive to adjust consumption on other time of the day or even to different days of the week when the energy is at a more affordable price. It is necessary to understand if the consumers have reduced their total energy consumption but also if they have saved money by shifting from the peak period. How the reduction of consumption is represented should be explained, i.e., if it is as percentage or in kWh. It should also be clear if the data analysis were based on daily consumptions, on data retrieved every 15 minutes, or any other period of time.
To test if there was in fact a significant impact of the tested interventions, it is necessary to compare the variation of each variable of interest between the trial and the control groups. By analysing these values, attention falls on unusually very high or very low consumption levels, usually errors due to the nature of the pilot test, which may bias the calculation of summary statistics. For this purpose, there are two possible solutions. The first one it is to use statistical tests that are less sensitive to outliers and use the median as the parameter. The other solution is to use statistical tests that have a method of removing the outliers using the average as parameter. In the case of using the average as parameter, it just has to be multiplied by the number of customers to reach the total savings; on the other hand, when using the median it is not possible to extrapolate to the total savings. Therefore it may be preferable to use averages after the elimination of outliers. Problems with data should be reported in this section.
For the comparison of data and any conclusion drawn from the analysis to be reliable, data from over two years of trials should be available in order to access the evolution of
15 a certain year to the subsequent year. Therefore, before starting the trials, households’ consumption should be analyzed. It will be called “Pre-trial” and it will serve as the base year, to detect and correct any differences that may exist from the outset in the average consumption of both trial and control groups. The common way to treat these differences is to consider how the variable of interest changes in consumption from one year to another as it is shown below in Table 1:
Hence it is important to have several in-trial years to have more than one term of comparison to reach accurate results since this is important for a cost-benefit analysis of a possible national roll-out which is always done for a time span of several years. For this purpose, the factor observed is known as: Persistence of Effects. The variation in consumption may have occurred at the beginning of the trials, with initial enthusiasm from consumers. It should be taken into account whether the effect of reduction on consumptions is still persistent and sustainable with the development of new habits, or if it was temporary with a huge reduction at the beginning. The change in electricity consumption should be compared from pre-trial to the first in-trial year, second in-trial year, third in-trial year and so on, as it is shown in Table 2, in order to get the percentage of change in the consumption from one year to another. This kind of table can be very useful to draw any conclusion about the evolution of each intervention over the years.
Table 2 - Changes in Consumption from Pre-trial to In-Trial Table 1 - Electricity consumption of the Trials Groups
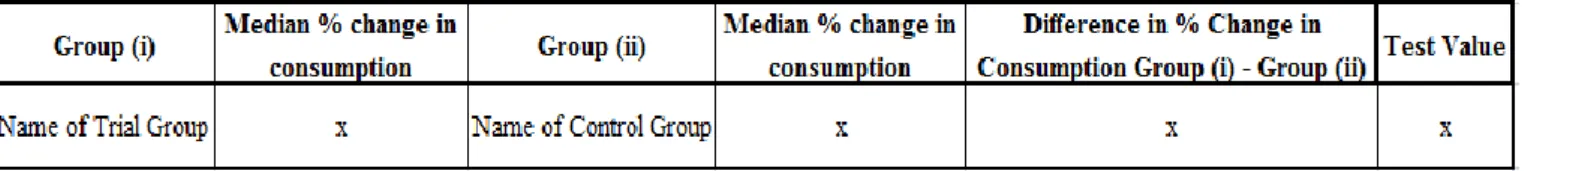
16 The median/average percentage change in energy consumption is the parameter used to make a posteriori comparisons between trial and control groups and watch the efficiency measured. With this analysis through the test value, whether it is significant or not, it is possible to access the impact of each intervention made. Normally, these statistic tests are worked at a level of significance of 5%. The Table 3 below shows an example of making such comparisons between groups: scientifically tested values allow drawing conclusions about the impact of each intervention made in each trial group. Tables like the one is represented here only refer to comparisons made between pre-trial and just one in-trial year. It must be made as many tables as the existing in-trial years in order to have comparisons of all years and assess the evolution.
At the end of this detailed analysis, the most significant values should be summed up in order to find out which interventions and services had more impact throughout the trial.
This was just one example of how to evaluate changes in energy consumption; it doesn’t mean that it should be done exactly the same way. The important aspect to retain from this structure is to understand that all the phases and steps, as well as the parameters and criteria used to represent the evaluation must be explained.
The second part of the data analysis should consist of the consumers’ feedback given from the Surveys conducted. All kind of surveys carried out during the trial are very
17 important to understand their position and cooperation within the pilot-test. Consumers’ feedback gives the ability to perceive their degree of satisfaction with the pilot-test and also with their new devices or services. Before the customers took part in this trial, their energy consumption was based on very incomplete information about the true cost paid by each electrical appliance used at home. Now, with the new equipments and services that give feedback on electricity consumption, customers have better information and thus can efficiently manage their consumption with results in behaviour changes. One of the objectives of these surveys is to identify precisely what kind of behavioural changes occur when people have more feedback. When information about consumers is incomplete, these surveys allow the acquisition of socioeconomic information about them. These socioeconomic characteristics are important because they allow the extrapolation of trials results to a national level that may have different characteristics, and also to assess which type of consumers may have benefit the most or the least. S may be done in various ways, through phone calls, email, among others. It may include questions like:
How useful do you find your display?
In the last year, has your concern about energy consumption has increased, decreased or stayed the same?
How often do you check your display?
Have you changed the time when you turn on your washing machine/dish washer?
It will be important to mention if the control group was targeted by any survey or interview. In case it was, it should be taken into account that the survey/interview can be considered as an intervention and it can affect their behaviour turning them from a
18 control into a trial group which can result in skewed conclusions. In case control groups are wanted to be interviewed, then that should only be done at the end of the tests or alternatively simply have two control groups, one with intervention and another without it. All feedback provided from the surveys will contribute to the final conclusion.
4. Findings in the Context of the Literature – In this section, the results obtained should be placed in the broader context of other trials and you should conclude if the overall findings are in accordance with other trial results. There are already results of lots of studies of many years in several countries so the comparison of results can be made. Attention should be paid both to changes that may occur over time, for example in terms of technology, and also to possible socio-economic divergences, such as cultural and climate differences, when comparing those results and conclusion with other studies.
5. The last point of the report before the conclusion is to identify Practical and Technical Issues that may affect the overall findings. This section should provide information in three sub-sections:
Customer feedback – consumers’ doubts and complaints that may affect the roll-out of smart meters;
Issues regarding development installation and operation of the smart metering equipment – Issues like: inadequate HAN4 and WAN5 signal; inadequate space to install meter and general equipment problems;
Issues with data management – incorrect manual entry of data into the databases; data processing due to high volume of data.
4
WAN (Wide Area Network) – Connects the information systems
5
19 6. The last part of the report, namely the Conclusion, should contain a summary of the overall findings and it would be useful to divide it into two distinct parts:
The impact of the interventions on consumer behaviour and energy consumption;
Key practical and technical issues identified.
Regarding the first point, it is recommended to give a brief summary of the interventions made that took the most significant reduction in energy consumption, i.e., the interventions that have had the most impact. The reduction of consumption should be presented as a percentage and a brief description of the most and least successful interventions should be carried out with possible equipment association. If during the trials evidences were detected of how population segments were affected by the interventions, this should also be mentioned in the conclusion.
It should be noted that the evaluation of trials is one of the major inputs to decide whether or not to launch a national roll-out. Based on the British case, in general, the reductions of energy consumption were quite small (0-8%), but the absolute savings scaled up to national level may be very significant. It is very important at this point to find out if consumers’ savings will be sufficient for this project to be profitable.
As regards the second part, conclusions about key practical and technical issues identified are necessary to be explained. All conclusions taken from these issues will be helpful in the case of deciding on a national roll-out. Examples of issues that should be taken into consideration for further improvements are the following:
Different geographical locations experience different signal strengths;
20 Large volume of energy data: it is easy to become swamped by faults in the data
when they occur;
Equipment installation: for instance, if technicians had enough training/engagement to be able to install the devices properly;
Possible problems/difficulties of customer interaction with all the equipment provided;
Unless you give these issues due importance, this may lead to the failure of the project. The overall findings should include a discussion on the implications of the obtained results for other tests to be performed in the future and the implications for a possible national roll-out.
4. Great Britain: Results and Conclusions
As mentioned before, after three years of trials, namely from end of 2007 to 2010, the assessment of trials was carried out and it was decided to move towards a national rollout. My main goal at this stage is to summarize the results obtained after the evaluation of the trials. The trials were conducted by four energy suppliers who provided smart electricity and gas meters and each of them obtained similar results even making a different combination of interventions. The interventions made by those four energy suppliers included the following:
21 Considering that it would be very extensive to describe all the results and conclusions drawn by the four suppliers, and that, as explained above, the results obtained were similar, I will focus mainly on one energy supplier, namely EDF Energy Customers Plc, (EDF). EDF divided their costumers into seven different trial groups offering different services and attributing a name to each of them:
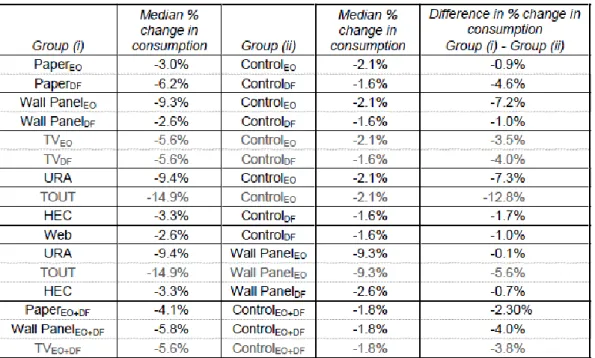
As it was stated in the previous section, in order to analyze possible reductions in the consumption, the comparison should be make between pre-trial and first in-trial year results, between pre-trial and second in-trial year results and so on, and the comparison should be carried between both trial and control groups. The Table 4 shows with whom the trial groups were compared, the reduction of consumption from one year to another of each group, and the difference found between both groups.
Table 4 - Comparisons of changes in consumption from pretrial to first in-trial year EO – Electricity Only, DF – Dual Fuel
22 There are significant reductions in all interventions made when comparing trial groups with control groups. As shown, the interventions with the most impact were the Wall Panel, the URA (Usage Reduction Alert) and the TOUT (Time-of-use Tariff). Therefore it can be concluded that the Real-Time Display, whose effects persisted until the end of the trial, was the equipment causing the most effective savings.
Some survey data show that customers complain about low engagement during the installation of smart meters and RTDs. Survey data also show that customers give much more importance to cost information rather than to kWh information, and that the unit of CO2 emissions has hardly been used. Electricity information is also much more
required than gas information.
After the evaluation of trials, it was generally concluded that providing consumers with smart meters and additional interventions leads to a significant level of consumption savings. On the other hand, it is very important to note that only providing equipment and services is not enough to achieve significant savings; it is essential to do a good approach to customers so that they know exactly what to do. Useful information should be provided before, during and after the installation of equipment to obtain customer engagement. All in all, the equipment provided worked well, but due to the pilot nature of this project, some problems appeared like equipment faults, data communication losses between household and supplier, difficulty on processing large volume of data, among others.
However, there are critical aspects that may have affected these trials results in terms of energy savings and consumer satisfaction, in other words, features that if improved could bring higher savings. For example, as mentioned before, consumers complained about lack of support and little engagement by suppliers during installation of equipments. If more support had been given with the use of displays or any other
23 equipment, or simply a greater awareness of the importance of the project had been given before the trials so that a greater collaboration of consumers was achieved, these results could have been much more significant. It is also noteworthy that these results may not be very accurate due to the way the recruitment was done. Giving the consumers the opportunity to refuse to be part of the trial, as well as failures of data may have biased statistics and may have affected the validity of the study.
5. Suggestions to InovCity
After describing each step to structure an independent evaluation of trials and after analysing the results of Great Britain’s case, this section points out some implications and suggestions for the future of InovCity turning it into an example of sustainability for the whole country.
Considering that the consumer is the key of the project and based on my visit to Évora, I have to point out a failure committed by EDP that was also committed in Great Britain, which can compromise the whole project. The lack of awareness and information provided to Évora’s inhabitants before and during joining the trial in order to make them understand what should really be done, and the little done to unleash their enthusiasm, can compromise the results in the future. Évora’s inhabitants only received a letter informing them they would be part of an environmentally friendly project. I suppose most of them might have skimmed it over without assimilating. If Portugal proceeds to a national scale, another method, but accessible in terms of resources, should be carried out to achieve the engagement of the whole population.
Two types of problems can occur with data security. It is necessary to guarantee the security of the metering data that is stored, transmitted and retrieved, and the privacy of the customer. Since this project allows the understanding of consumers’ lifestyles, to
24 avoid complaints of lack of privacy in the future, consumers have to be given the right to choose how their consumption data will be used and by whom. It is also important to facilitate a change of supplier, to move or change their contract, and to deliver appropriate and secure technological solutions adaptable to change.
To decide on a national roll-out, a cost benefit analysis should be carried out. It should contain all long-term costs and benefits to the market and to the individual customer. If assessed positively and a roll-out is decided, all customers have the right to obtain a smart meter and discriminatory behaviour should be avoided. Vulnerable groups, like consumers with lower income, or no internet access, single mothers and disabled people are more likely to make inappropriate decisions regarding suppliers or tariffs, and miss out opportunities to reduce energy consumption. Measures must be taken to protect those vulnerable groups. At least, it will be important to define precisely the critical paths to avoid delays and to ensure the success of the implementation.
6. Conclusion
Moving towards a low carbon economy is probably the greatest environmental challenge of our times. The climatic change has made developed countries opt for smart grids with the aim of contributing to the reduction of CO2 emissions and also help
families save money, since the crisis is still an issue. Portugal is no exception, implementing the innovative pilot test in Évora in early 2011. When reporting the pilot test results to the regulator entity, EDP should have in mind that numbers alone don’t mean anything: all the methodology and steps taken to achieve them has to be explained. In Great Britain, some equipment and services had more impact than others regarding the change in consumer behaviour, but just providing it is not enough, consumers must be aware of what their function consists of.
25 This work could be very useful and serve as a guide to EDP at the time they have to analyze the data; it shows how an evaluation of trial should be structured, which criteria should be used and also which steps should be followed. Hopefully, if the decision is made for a national roll-out, it will be based on a cost-benefit analysis supported by a rigorous evaluation of the intervention trials, as it occurred in Great Britain. This would mean that Portugal is on a par with other developed countries contributing to the environmental sustainability.
7. References
1. AECOM. 2011. “Energy Demand Research Project: Final Analysis”. http://www.ofgem.gov.uk/sustainability/edrp/Documents1/Energy%20Demand%20Research%20Pro ject%20Final%20Analysis.pdf
2. AECOM. 2011. “Energy Demand Research Project: Final Analysis Appendix A: Findings Reported
by the Energy Supplier”.
http://www.ofgem.gov.uk/sustainability/edrp/Documents1/EDRP%20Appendix%20A%20Findings% 20reported%20by%20the%20energy%20suppliers.pdf
3. Department of Energy and Climate Change (DECC) & Gas and Electricity Markets Authority (GEMA). 2010. “Smart Metering Implementation Programme: Prospectus”.
http://www.ofgem.gov.uk/eserve/sm/Documentation/Documents1/Smart%20metering%20-%20Prospectus.pdf
4. Department of Energy and Climate Change (DECC) & Office of Gas and Electricity Markets (Ofgem). 2011. “Smart Metering Implementation Programme: Response to Prospectus
Consultation”
http://www.ofgem.gov.uk/e-serve/sm/Documentation/Documents1/SM%20prospectus%20reponse%20overview.pdf
5. EDP Energias de Portugal. 2010. “Évora InovCity”. http://www.inovcity.pt
6. National Audit Office. 2011. “Preparations for the roll-out of smart meters”.
http://www.nao.org.uk/publications/1012/smart_meters.aspx
7. Office of Gas and Electricity Markets (Ofgem). 2010. “Smart Metering Implementation
Programme: Data Privacy and Security”.
http://www.ofgem.gov.uk/e-serve/sm/Documentation/Documents1/Smart%20metering%20%20Data%20Privacy%20and%20Sec urity.pdf
8. Office of Gas and Electricity Markets (Ofgem). 2010. “Smart Metering Implementation
Programme: Rollout Strategy”.
http://www.ofgem.gov.uk/e-serve/sm/Documentation/Documents1/Smart%20metering%20-%20Rollout%20Strategy.pdf
9. Smart Meters. 2010. “What is a Smart Grid?”. http://www.smartmeters.com/faqs/1245-what-is-a-smart-grid.html