1 2 3 4
University Student Engagement Inventory (USEI): Psychometric properties
56
Jorge Sinval1, Joana R. Casanova2, João Marôco1, & Leandro S. Almeida2 7
1 William James Center for Research, ISPA – Instituto Universitário
8
2 Research Centre in Education (CIEd), Institute of Education, University of Minho
9 10 11 12 Acknowledgments 13
Jorge Sinval received funding from the William James Center for Research, Portuguese Science Foundation (FCT UID/PSI/04810
14
/2013). Leandro S. Almeida and Joana R. Casanova received funding from CIEd – Research Centre on Education, projects
15
UID/CED/1661/2013 and UID/CED/1661/2016, Institute of Education, University of Minho, through national funds of FCT/MCTES-PT.
16
Joana R. Casanova received funding from the Portuguese Science Foundation (FCT) as a Doctoral Grant, under grant agreement number
17 SFRH/BD/117902/2016. 18 19 Contact author 20 E-mail: [email protected] 21 22
The final publication is available at link.springer.com (
http://dx.doi.org/10.1007/s12144-23
018-0082-6). 24
University Student Engagement Inventory (USEI): Psychometric properties 25
26
Abstract 27
Academic engagement describes students’ investment in academic learning and achievement 28
and is an important indicator of students’ adjustment to university life, particularly in the first 29
year. A tridimensional conceptualization of academic engagement has been accepted 30
(behavioral, emotional and cognitive dimensions). This paper tests the dimensionality, 31
internal consistency reliability and invariance of the University Student Engagement 32
Inventory (USEI) taking into consideration both gender and the scientific area of graduation. 33
A sample of 908 Portuguese first-year university students was considered. Good evidence of 34
reliability has been obtained with ordinal alpha and omega values. Confirmatory factor 35
analysis substantiates the theoretical dimensionality proposed (second-order latent factor), 36
internal consistency reliability evidence indicates good values and the results suggest 37
measurement invariance across gender and the area of graduation. The present study 38
enhances the role of the USEI regarding the lack of consensus on the dimensionality and 39
constructs delimitation of academic engagement. 40
Keywords: academic engagement, higher education, first-year students, assessment, 41
measurement invariance 42
Introduction 43
Research on engagement emerged from professional and occupational contexts. In 44
these contexts, engagement is defined as a positive psychological state that is characterized 45
by vigor, dedication and absorption associated with work-related well-being (Bakker et al. 46
2008; Hirschi 2012; Schaufeli and Bakker 2010). In recent years engagement has also been 47
studied in educational contexts, namely in higher education (Bresó et al. 2011; Christenson 48
and Reschly 2010; Kuh 2009; Vasalampi et al. 2009). These studies are often present in 49
international research concerning academic learning and achievement (Krause and Coates 50
2008; Schaufeli, Martinez, Marques Pinto, et al. 2002). 51
Students’ academic engagement can be defined as the time, intention and energy 52
students devote to educationally sound activities. Academic engagement is related to the 53
policies and practices that institutions use to induce students to take part in those activities 54
(Hodson and Thomas 2003; Kuh 2005; Wierstra et al. 2003). Research has established that 55
engaged students invest more in their performance, participate more and tend to develop 56
mechanisms to help them persist and self-regulate their learning and achievement (Klem and 57
Connell 2004; National Research Council and Institute of Medicine 2004). 58
Academic engagement is associated with a positive way of experiencing academic 59
activities and contexts, since it is related to positive academic and social outcomes (Klem 60
and Connell 2004; Wonglorsaichon et al. 2014), to satisfaction and self-efficacy (Coetzee 61
and Oosthuizen 2012), and to a reduction of achievement problems, burnout and dropout 62
(Chapman et al. 2011; Christenson et al. 2012; Christenson and Reschly 2010; Eccles and 63
Wang 2012; Elmore and Huebner 2010; Finn and Zimmer 2012; Fredricks et al. 2004, 2011; 64
Gilardi and Guglielmetti 2011; Reschly and Christenson 2012a). 65
As engagement is a broad meta-construct it can be problematic because various 66
definitions exist both within and across the different types of engagement (Fredricks et al. 67
2016). Two dominant conceptualizations of academic engagement have emerged in the 68
literature (for a recent debate on academic engagement see Senior and Howard 2015). 69
Schaufeli, Martinez, Marques-Pinto, Salanova and Bakker (2002) adapted the Utrecht Work 70
Engagement Scale (UWES) from the business organizations’ perspective to measure student 71
engagement in university settings. The adapted scale, the UWES – Student version (UWES-72
S), uses the same three work engagement dimensions (vigor, absorption and dedication) 73
adapted to the university context by rephrasing some of the original UWES items. The other 74
predominant student academic engagement conceptualization by Fredricks et al. (2004) 75
defines academic engagement as a multidimensional construct, integrating behavioral, 76
emotional and cognitive dimensions, which is usually in line with the notion that the 77
behavioral component corresponds to vigor, the emotional one to dedication and the 78
cognitive one to absorption (Christensen 2017). However, criticisms have been raised 79
regarding Salanova et al.’s (2002) and Fredricks et al.’s (2004) student academic engagement 80
conceptualizations. The former was a simple adaptation of the workplace to the university 81
context; the latter was derived mainly for high school students (Marôco et al. 82
2016).Theorizing academic engagement as a multidimensional construct allows for the better 83
generalization and understanding of academic engagement as a combination of its several 84
factors. Also, analysis of the engagement first-order factors (behavioral, emotional and 85
cognitive) allows for pinpointing the different contribution to overall engagement and direct 86
interventions. 87
Clarification is needed since some theoretical frameworks almost overlap with 88
previous literature (Fredricks 2015). In the academic engagement literature, there is a need 89
for clear definitions with differentiation between the dimensions within the adopted 90
framework (Fredricks et al. 2004). Raising the importance of having measures that take this 91
into consideration without crossing the content of different dimensions of different factors 92
increases the utility of analyzing the validity evidence of multidimensional psychometric 93
instruments. Marôco, Marôco, Campos and Fredricks (2016) reviewed the main criticisms of 94
both approaches and developed the University Student Engagement Inventory (USEI). This 95
inventory includes the behavioral, cognitive and emotional dimensions of academic 96
engagement, which is the definition and division of dimensions adopted by most research 97
(Fredricks 2015). The behavioral dimension is related to behaviors such as attending classes, 98
arriving on time, doing prescribed tasks/homework in scheduled time, participating in 99
activities in and out of the classroom, and respecting the social and institutional rules. The 100
cognitive dimension refers to all the students’ thoughts, perceptions and strategies related 101
with the acquisition of knowledge or development of competencies to academic activities, 102
for example their study methods, learning approaches and academic self-regulation. The 103
emotional dimension refers to positive and negative feelings and emotions related to the 104
learning process, class activities, peers and teachers, for example a sense of belonging, 105
enthusiasm, and motivation (Antúnez et al. 2017; Carter et al. 2012; Marôco et al. 2016; 106
Sheppard 2011). Validity evidence based on response processes (i.e. face validity) of the 107
behavioral, cognitive and emotional as dimensions of academic engagement was evaluated 108
by a focus group of university students and psychologists in the original proposal of Mâroco 109
et al. (2016). In this study, we focus on the validity evidence based on the USEI’s internal 110
structure. 111
Although there is a consensus about the relevance of this construct to the explanation 112
of academic behavior and learning, there is not a precise delimitation of the construct and its 113
dimensionality (Christenson et al. 2012; Fredricks and McColskey 2012; Kahu 2013; 114
Reschly and Christenson 2012; Wolf-Wendel et al. 2009). A debate is still ongoing 115
concerning the definition and internal structure of the academic engagement construct. This 116
conceptual haziness (Appleton et al. 2008) extends to the dimensionality of the construct’s 117
instruments: Some authors assume it to be a unidimensional primary factor or a second-order 118
factor as it is a general motivational trait or state, while other authors defend its 119
multidimensionality, but without consensus regarding the number of dimensions (Fredricks 120
et al. 2004; Handelsman et al. 2005; Lin and Huang 2018; Reschly and Christenson 2012b). 121
In this paper, we focus on the USEI for the university context and evaluate one of the 122
sources of evidence proposed in the Standards for Educational and Psychological Testing 123
(American Educational Research Association et al. 2014) regarding the validity evidence 124
based on the internal structure. Specifically, we aim to find good validity evidence regarding 125
the dimensionality of the first-order three-factor model (H1) of a possible second-order latent 126
factor model (H2), measurement invariance for gender (H3) and for the scientific area of 127
college graduation (H4), and good evidence of reliability of the scores through internal 128
consistency using several estimates (H5). This type of validity indicators intends to 129
demonstrate the relevance of an instrument that simultaneously can be useful to investigation 130
and practice. Namely, shown evidence of a meta-construct (academic engagement) which is 131
useful for research, demonstrating the utility of its specific domains for interventions with 132
specific students´ subgroups. 133
134
Method 135
Validity is a vital issue when it refers to the quality of psychometric scales, and it 136
refers to the extent to which the evidence supports the interpretation of scale scores (Crutzen 137
and Peters 2017). Validity concerns the understanding of scale scores in a specific study; it 138
isn’t a characteristic of a scale in itself (American Educational Research Association et al. 139
2014). Consequently, evidence from other studies must be used to justify the choice of a 140
specific scale, although in a strict sense it doesn’t guarantee the same validity evidence in a 141
new study (Crutzen and Peters 2017). Nevertheless, every study that uses psychometric 142
scales must pay attention to the validity evidence brought by each scale in each study. 143
Historically, different types of validity have been approached; the current Standards for 144
Educational and Psychological Testing evolved after the first version, more than 60 years 145
ago (American Psychological Association 1954). The current Standards approach validity as 146
a unitary concept, with five sources of validity recognized (Sireci and Padilla 2014): based 147
on internal structure, based on test content, based on the relation to other variables, based on 148
response processes and based on the consequences of testing. Although these are not 149
considered to present distinct types of validity, an inclusive evaluation of the instrument 150
includes these different sources of evidence in a coherent account (American Educational 151
Research Association et al. 2014). 152
Validity evidence based on the internal structure includes three basic aspects: 153
dimensionality, measurement invariance and reliability (Rios and Wells 2014). To assess 154
dimensionality, one can opt for several factor analytic methods; however, confirmatory factor 155
analysis (Brown 2015) is the most comprehensive approach for comparing observed and 156
hypothesized test structures, as it evaluates the relationships between items and the latent 157
variables (theoretical constructs) and which items should be measured (Bollen 1989). 158
Measurement invariance assesses whether an instrument is fair for different 159
subgroups from a psychometric perspective (van de Schoot et al. 2012), such as occupations 160
(Sinval et al. 2018), countries (Reis et al. 2015), genders (Marsh et al. 2010) and other groups. 161
It can also be evaluated using different statistical approaches, with multigroup confirmatory 162
factor analysis being the most popular (Davidov et al. 2014). This approach consists of setting 163
increasingly constrained sets of structural equation models, and comparing the more 164
restricted models with the less restricted models (van de Schoot et al. 2015). 165
Since the validity of scores depends on their reliability (American Educational 166
Research Association et al. 2014), without reliability we can’t have appropriate validity 167
evidence (Kaplan and Saccuzzo 2013). It can be evaluated with different techniques, 168
although the most usual is through internal consistency estimates, such as Cronbach’s α, 169
Revelle’s β or McDonald’s ωh (Zinbarg et al. 2005). It provides evidence about the
170
consistency of the test scores across repeated administrations (American Educational 171
Research Association et al. 2014). 172
173
Participants 174
A sample of 908 Portuguese first-year university students (ages ranging from 17 to 175
58 years; M = 19.41; SD = 4.79; Mdn = 18) from a public university in the north of Portugal 176
was used to evaluate the psychometric properties of the USEI. These students commonly 177
took courses in three main areas: 40.18% were from technology or engineering courses; 178
29.52% from economics or law courses; and 30.30% from languages or humanities. Most 179
students were women (64.58%) and only 8.57% had a part-time or full-time occupation. With 180
respect to parents’ level of education, 50.65% of mothers had a basic education level, 30.27% 181
a high school level and 19.08% a higher education level; meanwhile, 58.99% of fathers had 182
a basic education level, 24.64% had a secondary level and 16.38% a higher education level. 183
Measures and procedures 185
The USEI (Marôco et al. 2016) is a self-report Likert-type (1 = “never” to 5 = 186
“always”) scale with 15 items organized in three academic engagement dimensions: 187
behavioral (BE; e.g. I usually participate actively in group assignments), cognitive (CE; e.g. 188
I like being at school) and emotional (EE; e.g. I try to integrate the acquired knowledge in 189
solving new problems). This instrument presented good evidence of reliability and factorial, 190
convergent and discriminant validity evidence in a previous research study (Marôco et al. 191
2016). Exploratory and confirmatory factor analyses confirm systematically specific items 192
for each dimension. Reliability coefficients in terms of the consistency of items are above .63 193
(ordinal omega values) and above .69 (ordinal alpha values) for three dimensions. 194
A non-probabilistic convenience sample was considered, with the inclusion criterion 195
being students entering university. Data were collected in the classroom context with the 196
permission and collaboration of teachers. The aims of the study were presented, and 197
confidentiality was ensured. The participants provided informed consent stating their 198
voluntary agreement to participate in the study. Ten minutes were enough to fill in the 199
inventory and give some personal information for sample characterization. 200
201
Data analysis 202
All statistical analysis was performed with R (R Core Team 2018) and RStudio 203
(RStudio Team 2017). The descriptive statistics were obtained using the skimr package 204
(Rubia et al. 2017). Confirmatory factor analysis (CFA) was conducted to evaluate the 205
psychometric properties of the data gathered with the USEI, namely its internal structure 206
validity evidence. CFA was performed with the lavaan package (Rosseel 2012) using the 207
weighted least squares means and variances (WLSMV) estimation method, which is 208
indicated for nonlinear response scales. Internal consistency reliability estimates for ordinal 209
variables, average variance extracted (AVE) and heterotrait-monotrait (HTMT) were 210
calculated using the semTools package (semTools Contributors 2016), while Mardia’s 211
Kurtosis (Mardia 1970) was assessed using the psych package (Revelle 2017). 212
The CFA was conducted to verify whether the proposed three-factor structure presented 213
an adequate fit for the study sample data. We used as goodness-of-fit indices the TLI (Tucker-214
Lewis Index), χ2/df (ratio of chi-square to degrees of freedom), the NFI (Normed Fit Index),
215
the CFI (Comparative Fit Index) and the RMSEA (Root Mean Square Error of 216
Approximation). The fit of the model was considered good for CFI, NFI and TLI values 217
above .95 and RMSEA values below .06 (Hu and Bentler 1999; Marôco 2014). 218
To analyze convergent validity evidence, the AVE was estimated as described in Fornell 219
and Larcker (1981). Values of AVE ≥ .5 were considered acceptable indicators of convergent 220
validity evidence. To determine whether the items that are manifestations of a factor were 221
not strongly correlated with other factors, discriminant validity evidence was assessed. 222
Acceptable discriminant validity evidence was assumed when for two factors x and y, AVEx
223
and AVEy ≥ ρ2xy (squared correlation between the factors x and y), or when the HTMT
224
(Henseler et al. 2015) ratio of correlations is higher than .85 (Kline 2016). 225
The reliability of the internal scores evidence was assessed through internal consistency 226
measures. The ordinal Cronbach’s alpha coefficient (α) and composite reliability (CR) were 227
calculated. Since alpha has been shown to present evidence of a measure’s internal 228
consistency only when the assumptions of the essentially tau-equivalent model are obtained 229
(Revelle and Zinbarg 2009), the ordinal coefficient omega (ω) for each factor (Raykov 2001; 230
Zumbo et al. 2007) and the hierarchical omega (ωh) coefficient (Green and Yang 2009; Kelley
231
and Pornprasertmanit 2016; McDonald 1999) were also calculated. Higher alpha values are 232
desirable, although excessively high values of alpha aren’t recommended, as this reveals 233
unnecessary repetition and overlap (Streiner 2003). Values of CR ≥ .7 were considered to be 234
satisfactory indicators of internal consistency (Marôco 2014). Omega values show evidence 235
of how much of the overall variance of a factor in the data that is due to that specific factor, 236
ω, was calculated for each of the three factors. As regards the ωh, a higher value will indicate
237
a stronger influence of the latent variable common to all of the factors, and that the observed 238
scale scores generalize to scores for the common latent variable (Zinbarg et al. 2007). The 239
second-order factor reliability was also calculated using the omega coefficient (Jorgensen et 240
al. 2018). 241
The measurement invariance of the second-order model was assessed with the lavaan 242
package (Rosseel 2012), and we established a set of comparisons within a group of seven 243
different models based on the recommendations for ordinal variables (Millsap and Yun-Tein 244
2004) and for second-order models (Chen et al. 2005). An initial configural model was set, 245
which served as a baseline (configural invariance) for further equivalence testing (Edwards 246
et al. 2017). Next, metric invariance of the first-order factor loadings was tested with the 247
items’ loadings forced to be equal across groups; this assessed whether the subgroups 248
attribute the same meaning to the different instrument items. The next step consisted in 249
forcing the second-order factor loadings to be equal across groups; this checked whether the 250
subgroups give the same meaning to the factors that compose the second-order latent factor. 251
Afterwards, scalar invariance of the first-order factors was tested, where thresholds were 252
added to be equal across groups (Millsap and Yun-Tein 2004). If scalar invariance was 253
obtained, it meant that the means or the thresholds of the items are also equal across the 254
subgroups, enabling comparisons between the different subgroups. Next, scalar invariance 255
of the second-order latent factor was tested, where the intercepts of the first-order latent 256
variables were forced to be equal across groups. This checked whether the first-order latent 257
levels were equal across groups. Usually, this was enough for measurement invariance, since 258
the next levels are too restrictive (Marôco 2014). After, the disturbances of first-order factors 259
were established as being equal across groups, to verify if the explained variances for the 260
first-order latent factors were equal across groups. Finally, if residual variances were also 261
added to be equal across groups without statistically significant differences, full uniqueness 262
measurement invariance was obtained, which means that the explained variance for all items 263
didn’t change in regard to the subgroup (van de Schoot et al. 2012). Invariance across the 264
different levels can be assessed using two different criteria: the ΔCFI < .01 between 265
constrained and free models(Cheung and Rensvold 2002), and the Δχ2 test comparing the fit
266
of the constrained vs. free models is not statistically significant (Satorra and Bentler 2001). 267
268
Results 269
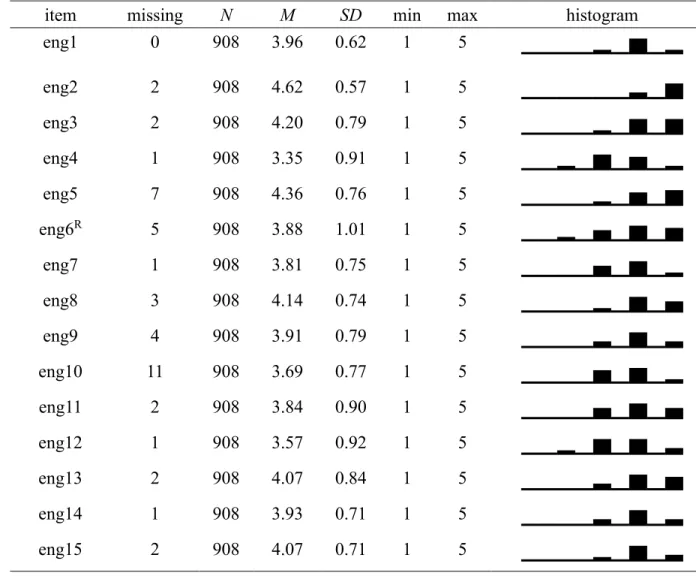
Items’ distributional properties 270
Summary measures, skewness (sk), kurtosis (ku) and a histogram for each of the 15 271
items are presented (Table 1) and were used to judge distributional properties and 272
psychometric sensitivity. Absolute values of ku smaller than 7 and sk smaller than 3 were 273
considered an indication of not strong deviations from the normal distribution (Finney and 274
DiStefano 2013). Mardia’s multivariate kurtosis for the 15 items of the USEI was 37.5; p 275
< .001. All possible answer values for each item are also present, and no outliers were deleted. 276
Also interesting is the reduced number of missing answers from the 15 items (11 omissions 277
from item 10 “My classroom is an interesting place to be”). 278
The items’ distributional coefficients are indicative of appropriate psychometric 279
sensitivity, as it would be expected that these items would follow an approximately normal 280
distribution in the population under study. Despite these univariate and multivariate 281
normality indicators, the WLSMV estimator was used to account for the ordinal level of 282
measurement of the items, which can be done without concerns about this estimate. 283 284 --- 285 Insert Table 1 286 --- 287 288
Factorial validity evidence 289
In light of the previous researches on the USEI structure confirming the existence of 290
three dimensions, a confirmatory factor analysis was performed. The hypothesized three-291
factor model’s fit with the data was good (Figure 1; correlations between latent variables, and 292
factor loadings for each item are shown), since CFI, NFI and TLI values were greater 293
than .95, and RMSEA values were less than .06. It is also important that the factor loadings 294
of all items are greater than .50, except for item 6 (the only reversed coded item in the 295
instrument). 296
Figure 1 – Confirmatory factor analysis of the University Students Engagement Inventory 297
(15 items) with first-year Portuguese university students (χ2(87) = 286.665, p < .001, n =
298
871, CFI = .987, TLI = .985, NFI = .982, RMSEA = .051, P(RMSEA ≤ .05) = .356, IC90 299 ].045; .058[. R – Reversed. 300 301 --- 302
Insert Figure 1 here 303
304
--- 305
Convergent validity evidence 307
The average variance extracted (AVE) was acceptable for EE (.54), nearly acceptable 308
for CE (.49) and low for BE (.31). The convergent validity evidence was acceptable for the 309
CE and EE factors and unsatisfactory for the BE factor. 310
311
Discriminant validity evidence 312
Comparing data from these three dimensions, the AVE for EE (AVEEE = .54) was greater
313
than r2BE.EE (.36), but the AVEBE = .31 was lower, the AVECE = .49 and AVEEE = .54 were both
314
greater than r2EE.CE = .24, and the AVEBE = .31 and AVECE = .49 were both less than r2BE.CE
315
= .52. The discriminant validity evidence was good for CE and EE, insufficient for BE and 316
EE, and poor for BE and CE. With regard to the HTMT criterion, the HTMTBE.EE = .60,
317
HTMTBE.CE = .73 and HTMTEE.CE = .51, with all being below the recommended threshold.
318
Together, these findings detect strong correlations/overlap among the three latent constructs. 319
This points to a possible higher-order latent factor. 320
321
Second-order construct 322
We tested the possible existence of a higher-order latent variable, the meta-construct 323
academic engagement, which was hypothesized by the original authors (Marôco et al. 2016), 324
and suggested also by our lack of discriminant validity evidence findings. In regard to the 325
USEI with a second-order latent factor, overall the goodness-of-fit indices were good (Figure 326
2; gamma between the second-order latent factor and the first-order latent factors, and factor 327
loadings for each item are shown). The structural weights for the academic engagement 328
second-order factor model were medium/high: behavioral engagement (γ = 0.93; p < .001); 329
emotional engagement (γ = 0.64; p < .001); and cognitive engagement (γ = 0.77; p < .001). 330
Figure 2 – Confirmatory factor analysis of the University Students Engagement Inventory 331
(second-order model – 15 items) with first-year Portuguese university students (χ2(87) = 332
286.665, p < .001, n = 871, CFI = .987, TLI = .985, NFI = .982, RMSEA = .051, P(RMSEA 333 ≤ .05) = .356, IC90 ].045; .058[. R – Reversed. 334 335 --- 336
Insert Figure 2 here 337
338
--- 339
340
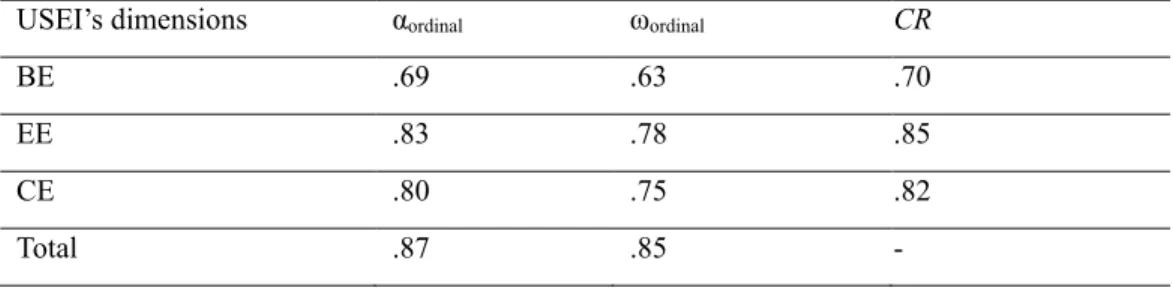
Reliability: Internal consistency evidence 341
In terms of the hypothesized reliability evidence, the results suggest good evidence of 342
internal consistency reliability (Table 2). The alpha values were higher than the omega values 343
for all factors and for the total scale. The hierarchical omega for the total scale was good (ωh
344
= .85), which suggests a well-defined latent variable, thereby evidencing that this latent 345
variable is more likely to be stable across studies, which also suggests that the general factor 346
academic engagement is the dominant source of systematic variance (Rodriguez et al. 2016). 347 --- 348 Insert Table 2 349 --- 350
The internal consistency reliability of the second-order latent variable was good. The 351
proportion of observed variance explained by the second-order factor after controlling for the 352
uniqueness of the first-order factor (ωpartial L1) was .87, the proportion of the second-order
353
factor explaining the variance of the first-order factor level (ωL2) was .87 and the proportion
354
of the second-order factor explaining the total score (ωL1) was .72.
356
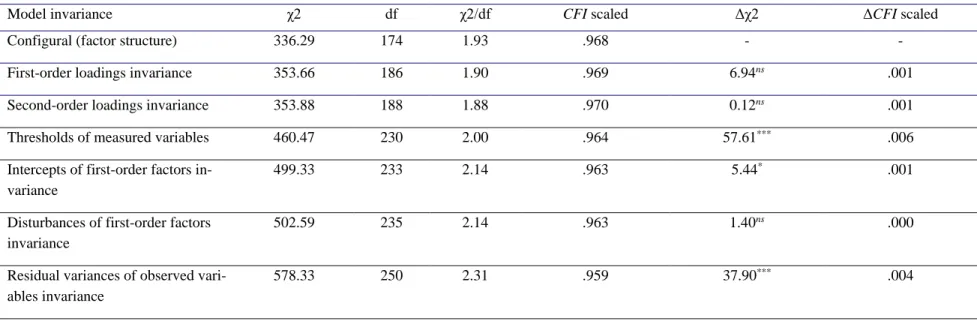
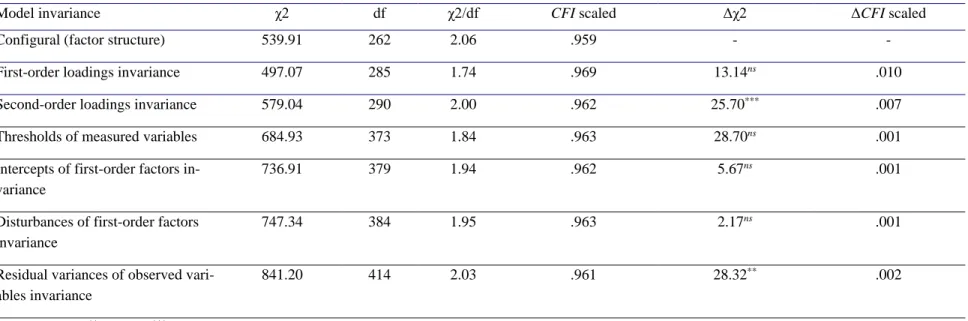
Measurement invariance by gender and scientific area of graduation 357
Finally, to detect whether the same second-order latent model holds in different 358
scientific areas of graduation and genders, a group of nested models with indications of 359
equivalence is needed. The hypothesized full-scale invariance was supported for gender 360
(Table 3) using the Cheung and Rensvold (2002) ΔCFI criterion, while the Δχ2 criterion
361
supported only the second-order metric invariance. In regard to the hypothesized structural 362
invariance among different areas of study, full-scale invariance was supported by the ΔCFI 363
criterion, nevertheless the ΔCFI value for the first comparison was marginal at .010, although 364
the Δχ2 supported it, after we continued with the comparisons; the Δχ2 criterion allowed only
365
the first-order metric invariance (see Table 4). In both cases, the ΔCFI criterion was 366
preferable, since the Δχ2 is too restrictive (Marôco 2014).
367 --- 368 Insert Table 3 369 --- 370 371 --- 372 Insert Table 4 373 --- 374 375 Discussion 376 Hypotheses findings 377
This study obtained findings that allow our H1 to be confirmed, since the data 378
gathered with the USEI presented good psychometric properties in terms of validity evidence 379
based on the internal structure, something that was observed in other studies with this 380
instrument, which obtained acceptable/good overall goodness of fit (Costa et al. 2014) and 381
good overall goodness of fit (Marôco et al. 2016). The confirmatory factor analysis presented 382
good evidence about factorial validity, since goodness-of-fit indices values ranged from very 383
good to good, and only item 6 had a lambda of less than .50. Analyzing its content, item 6 is 384
the only one reverse coded, which suggests that it should be presented in the same direction 385
as the other items in the future. Marôco, Marôco and Campos (2014) report this kind of 386
improvement in the items’ correlations in student burnout (an opposite construct to academic 387
engagement). The USEI’s convergent validity evidence is acceptable and the AVE values 388
were good for the EE dimension, marginally acceptable for CE and less than acceptable for 389
BE. These values show that the items of each dimension were good manifestations of the 390
factors they load onto. The discriminant validity evidence of the instrument was acceptable 391
for two of the three factors. The lack of discriminant validity evidence for BE may be due to 392
our sample being composed only of freshmen; in the original USEI study (Marôco et al. 393
2016) with students from other academic years, this lack of discriminant validity evidence 394
was not observed. 395
Our H2 was confirmed, something that has been tested by the original authors, with 396
whom our results were aligned in terms of structural weights, with behavioral engagement 397
having the highest gamma, followed by cognitive engagement and finally emotional 398
engagement (Marôco et al. 2016). 399
With regard to H3 and H4, our results brought evidence that allows comparisons to 400
be established between male and female genders using the USEI, and between first-year 401
students from technology or engineering courses, from economics or law courses, and from 402
languages or humanities. This finding was a novelty of our study, and is useful since previous 403
studies only assessed engineering students (Costa et al. 2014; Costa and Marôco 2017) or – 404
even with a sample from different courses – didn’t test measurement invariance for the 405
scientific area of graduation (Marôco et al. 2016). Another novelty of this study was the test 406
of the second-order measurement invariance, since the only study that has tested 407
measurement invariance using this instrument (Marôco et al. 2016) did so only to compare 408
the structure between two independent samples without comparing specific scientific areas 409
of graduation, and regarding the first-order model. This finding will enable future 410
comparisons among these different groups to verify possible differences and their impact on 411
academic adjustment and achievement. 412
With regard to the evidence obtained about reliability, it was good for CR, ordinal α, 413
ordinal ω and ωh, suggesting adequate reliability of the data measured with the USEI. Our
414
results confirm our H5, and – nevertheless – are aligned with what was found in other studies, 415
where BE obtained lower reliability estimates than EE and CE (Costa et al. 2014; Marôco et 416
al. 2016). 417
Academic engagement is a relevant construct for describing student adaptation and 418
achievement in higher education. Engaged students tend to invest more in their performance 419
and develop strategies to persist in and to self-regulate their learning (Christenson and 420
Reschly 2010; Dılekmen 2007; Fredricks et al. 2011; Klem and Connell 2004). Consequently, 421
better academic success is expected (Lee 2014). In the literature, some consensus exists 422
defining academic engagement as a multidimensional construct, integrating behavioral, 423
emotional and cognitive dimensions (Fredricks et al. 2004). Our data from the USEI confirm 424
these three dimensions for describing students’ academic engagement. Albite the second-425
order construct (academic engagement) presents higher path loadings in the behavioral 426
dimension (γ = .93) than emotional and cognitive engagement, respectively γ = .64 and γ 427
= .77. The differences are pertinent and are in line with the expected, since our sample was 428
constituted by freshmen. The literature suggests that the first-years students have less 429
maturity and autonomy to cope with the challenges of higher education (Bernardo et al. 2017; 430
Pascarella and Terenzini 2005). The first-year college students have their academic 431
engagement more expressed on behavioral terms, which can be seen on the academic routines 432
and tasks (e.g. attend to classes, group assignments). 433
Based on the foregoing discussion, we conclude that the USEI presents good validity 434
evidence about its internal structure, presenting promising results for future studies related to 435
other sources of validity and different university students’ samples. This instrument can 436
become an interesting tool for education and psychology researchers for analyzing the 437
relationship between the different types of academic engagement and other personal and 438
academic variables important for students’ adjustment and academic achievement. 439
Although domain-specific subject areas aren’t included in the instrument, they may 440
contribute to understanding the extent to which engagement is content-specific, and to what 441
extent it represents a general engagement tendency (Fredricks et al. 2004). Since this was a 442
study carried out with a sample of university students from different courses, it wasn’t 443
desirable to have a different version for each course, and it wasn’t practical either because of 444
time and resource constraints. If one wants to understand and study a specific academic 445
engagement dimension, this kind of more inclusive instrument might be insufficient, 446
although if the goal of the study is to obtain a single measure for each of the three types of 447
academic engagement, this instrument may be a good choice, since it addresses each 448
construct with few items, and the last word is given to the researcher. 449
450
Theoretical Implications 451
This study presents some theoretical findings that can enable a better understanding 452
of academic engagement as a multidimensional construct. USEI revealed a three-factor 453
structure that appears to be indicative of a higher-order construct, academic engagement. This 454
makes USEI unique regarding the potential of its conceptualization of academic engagement 455
as a meta-construct (Fredricks and McColskey 2012b), which is important to define well in 456
terms of its subdimensions (Fredricks et al. 2016). The results emphasize that this conception 457
of academic engagement works well in different scientific areas of college graduation 458
courses. There are some other subject specific instruments (Kong et al. 2003; Wigfield et al. 459
2008), but USEI has the particularity of being a general measure of academic engagement 460
for university students. 461
This is the first report addressing the USEI validity for students majoring different 462
study areas. The behavioral and emotional components of academic engagement in this 463
instrument didn’t present the desired discriminant validity evidence, appearing to be 464
somehow related to their content. Our validity evidence supports a consistent alignment with 465
the academic engagement construct definition, showing good psychometric properties for the 466
study sample. As a convergence or product of motivation and active learning behaviors, 467
academic engagement works as a relevant variable with a strong impact in predicting the 468
student's permanence and success in completing his or her course in higher education 469
(Alrashidi et al. 2016; Barkley 2010; Kuh 2001). 470
471
Practical Implications 472
As for practical implications, USEI can be considered a tool with good psychometric 473
properties that can measure the perceptions of academic engagement behaviors, emotions 474
and internal cognitions in first-year university students. It is an instrument that was 475
specifically designed for university students and it is available for free. This can be done 476
across groups of different scientific areas of graduation and genders, without losing the 477
desirable measurement invariance that enables direct comparisons of scores between those 478
groups. This is something that hasn’t been done before across gender or the scientific area of 479
graduation. These findings together can bring confidence to the measures obtained using the 480
USEI, knowing the academic engagement predictive relation with other variables. For 481
example, Costa and Marôco (2017) found that the emotional subdimension of academic 482
engagement had a statistically significant relation with students’ dropout thoughts. 483
Consequently, this is an important implication, since USEI can be useful to assess 484
interventions for specific dimensions of students’ engagement. USEI is particularly useful 485
for measuring cognitive engagement and emotional engagement, that are not directly 486
observed (Fredricks and McColskey 2012b). With USEI these subdimensions don’t need to 487
be inferred from behavioral indicators or teacher rating scales, avoiding potential inferences 488
through those other methods (Appleton et al. 2006). 489
Self-report instruments have several advantages over other methods, they are 490
practical and relatively low cost tools for group or large-scale assessments (Mandernach 491
2015). This allows to obtain data over several waves and establish different types of 492
comparisons (e.g. universities, courses). The large-scale assessment of academic engagement 493
enables teachers, policymakers and administrative boards to assess students' learning status 494
and their academic life experiences (Coates 2005), making it possible to obtain relevant 495
instructional feedback to the institution's decision-makers and to the students themselves 496
regarding the measured constructs (Banta et al. 2009; Kember and Leung 2009). In this sense, 497
due to its psychological, contextual nature and complexity, academic engagement assessment 498
should take a multidimensional approach considering the behavioral, emotional and 499
cognitive aspects (Alrashidi et al. 2016; Mandernach 2015). This multidimensional approach 500
allows for differential analysis. For example, on the levels and types of investment in relation 501
to the scientific areas and to differentiated subgroups of students according to their socio-502
cultural origin or their vocational career projects. With the Bologna Declaration (1999), 503
governments in European countries advocated for higher education to value and be based on 504
the active participation of students in their skills development and learning. This perspective 505
benefits from brief and multidimensional instruments that ensure a large-scale assessment of 506
the students' levels of academic engagement as related to their behavioral, cognitive and 507 emotional aspects. 508 509 Conclusions 510
All the research hypotheses were confirmed, pointing to the validity evidence of the 511
obtained findings, something that goes in line with other previous studies (Costa et al. 2014; 512
Costa and Marôco 2017; Marôco et al. 2016). There seems to be evidence that the USEI is 513
an appropriate psychometric instrument for the academic engagement framework adopted, 514
which is multidimensional and comprised of observable behaviors, emotions and internal 515
cognitions. Thus, it can help to capitalize on the potential of academic engagement as a 516
multidimensional construct (Fredricks 2015), with a higher-order dimension, academic 517
engagement. Our findings bring clarity regarding the psychometric properties of this 518
promising instrument, which can successfully measure the three different kinds of academic 519
engagement from the most adopted theoretical framework. This is the first instrument that 520
enables Portuguese university students to do so. Due to its reduced number of items this 521
instrument can be adequate to research proposes in large scale related with academic 522
engagement, and to practical purposes at the intervention levels can allow to identify 523
dimensions where teachers and university staff can design interventions based on the 524
specificities of each scientific areas or students’ subgroups. 525
Future studies should address longitudinal research designs, such as longitudinal 526
measurement invariance and measurement invariance for public/private universities, with 527
students from different graduation years, something that isn’t often implemented as it should 528
be, since it is a condition for making proper comparisons between different groups (Davidov 529
et al. 2014). Future studies should also look at transcultural validity of the USEI in different 530
languages, other than the European/Brazilian Portuguese for which the USEI was initially 531
developed. 532
Also, other kinds of validity evidence should be addressed, such as evidence of 533
validity based on relationships with measures of other variables like student achievement, 534
drop-out, burnout and well-being (McCoach et al. 2013). Our sample only included first-year 535
students from a Portuguese public university, and it is desirable that other and more diverse 536
scientific areas of graduation should be included, such as students from private universities 537
and different grades, and also students with another status (such as a student worker). 538
539
Funding This work received no grants or assistance from a funding body. 540
Compliance with Ethical Standards 541
Conflict of Interest On behalf of all authors, the corresponding author states that there 542
is no conflict of interest. 543
Ethical Approval All procedures performed in studies involving human participants 544
were in accordance with the ethical standards of the Institutional Ethics Research 545
Committee and with the 1964 Helsinki declaration and its later amendments or 546
comparable ethical standards. 547
Informed Consent Informed consent was obtained from all individual participants 548
included in the study. 549
References 551
Alrashidi, O., Phan, H. P., & Ngu, B. H. (2016). Academic engagement: An overview of its 552
definitions, dimensions, and major conceptualisations. International Education 553
Studies, 9(12), 41–52. doi:10.5539/ies.v9n12p41 554
American Educational Research Association, American Psychological Association, & 555
National Council on Measurement in Education. (2014). Standards for Educational 556
and Psychological Testing. Washington, DC, USA: American Psychological 557
Association. 558
American Psychological Association. (1954). Technical recommendations for 559
psychological tests and diagnostic techniques. Psychological Bulletin, 51(2), 201–238. 560
doi:10.1037/h0053479 561
Antúnez, Á., Cervero, A., Solano, P., Bernardo, I., & Carbajal, R. (2017). Engagement: A 562
new perspective for reducing dropout through self-regulation. In J. A. González-563
Pienda, A. Bernardo, J. C. Núñez, & C. Rodríguez (Eds.), Factors affecting academic 564
performance (pp. 25–46). New York, NY, USA: Nova Science Publishers. 565
Appleton, J. J., Christenson, S. L., & Furlong, M. J. (2008). Student engagement with 566
school: Critical conceptual and methodological issues of the construct. Psychology in 567
the Schools, 45(5), 369–386. doi:10.1002/pits.20303 568
Appleton, J. J., Christenson, S. L., Kim, D., & Reschly, A. L. (2006). Measuring cognitive 569
and psychological engagement: Validation of the Student Engagement Instrument. 570
Journal of School Psychology, 44(5), 427–445. doi:10.1016/j.jsp.2006.04.002 571
Bakker, A. B., Schaufeli, W. B., Leiter, M. P., & Taris, T. W. (2008). Work engagement: 572
An emerging concept in occupational health psychology. Work & Stress, 22(3), 187– 573
200. doi:10.1080/02678370802393649 574
Banta, T. W., Pike, G. R., & Hansen, M. J. (2009). The use of engagement data in 575
accreditation, planning, and assessment. New Directions for Institutional Research, 576
2009(141), 21–34. doi:10.1002/ir.284 577
Barkley, E. F. (2010). Student engagement techniques: A handbook for college faculty. San 578
Francisco, CA, USA: John Wiley & Sons. 579
Bernardo, A., Cervero, A., Esteban, M., Tuero, E., Casanova, J. R., & Almeida, L. S. 580
(2017). Freshmen program withdrawal: Types and recommendations. Frontiers in 581
Psychology, 8, 1–11. doi:10.3389/fpsyg.2017.01544 582
Bollen, K. A. (1989). Structural equations with latent variables. New York, NY, USA: 583
Wiley. doi:10.1002/9781118619179 584
Bologna Declaration. The European higher education area. Joint Declaration of the 585
European Ministers of Education, June 19, Bologna. (1999). 586
https://www.eurashe.eu/library/bologna_1999_bologna-declaration-pdf/ 587
Bresó, E., Schaufeli, W. B., & Salanova, M. (2011). Can a self-efficacy-based intervention 588
decrease burnout, increase engagement, and enhance performance? A quasi-589
experimental study. Higher Education, 61(4), 339–355. doi:10.1007/s10734-010-590
9334-6 591
Brown, T. A. (2015). Confirmatory factor analysis for applied research (2nd ed.). New 592
York, NY, USA: The Guildford Press. 593
Carter, C. P., Reschly, A. L., Lovelace, M. D., Appleton, J. J., & Thompson, D. (2012). 594
Measuring student engagement among elementary students: Pilot of the Student 595
Engagement Instrument— Elementary version. School Psychology Quarterly, 27(2), 596
61–73. doi:10.1037/a0029229 597
Chapman, C., Laird, J., Ifill, N., & KewalRamani, A. (2011). Trends in high school dropout 598
and completion rates in the United States: 1972 – 2009 (No. compendium report 599
2012-006). National Center for Education Statistics. http://nces.ed.gov/pubsearch 600
Chen, F. F., Sousa, K. H., & West, S. G. (2005). Teacher’s corner: Testing measurement 601
invariance of second-order factor models. Structural Equation Modeling: A 602
Multidisciplinary Journal, 12(3), 471–492. doi:10.1207/s15328007sem1203_7 603
Cheung, G. W., & Rensvold, R. B. (2002). Evaluating goodness-of-fit indexes for testing 604
measurement invariance. Structural Equation Modeling: A Multidisciplinary Journal, 605
9(2), 233–255. doi:10.1207/S15328007SEM0902_5 606
Christensen, M. (2017). Work engagement and job crafting. In M. Christensen, P. Ø. 607
Saksvik, & M. Karanika-Murray (Eds.), The positive side of occupational health 608
psychology (pp. 79–90). Cham, Switzerland: Springer. doi:10.1007/978-3-319-66781-609
2_7 610
Christenson, S. L., & Reschly, A. L. (2010). Check & connect: Enhancing school 611
completion through student engagement. In B. Doll, W. Pfohl, & J. Yoon (Eds.), 612
Handbook of youth prevention science (pp. 327–334). New York, NY, USA: 613
Routledge. 614
Christenson, S. L., Reschly, A. L., & Wylie, C. (Eds.). (2012). Handbook of research on 615
student engagement. New York, NY, USA: Springer. doi:10.1007/978-1-4614-2018-7 616
Coates, H. (2005). The value of student engagement for higher education quality assurance. 617
Quality in Higher Education, 11(1), 25–36. doi:10.1080/13538320500074915 618
Coetzee, M., & Oosthuizen, R. M. (2012). Students’ sense of coherence, study engagement 619
and self-efficacy in relation to their study and employability satisfaction. Journal of 620
Psychology in Africa, 22(3), 315–322. doi:10.1080/14330237.2012.10820536 621
Costa, A. R., Araújo, A. M., & Almeida, L. S. (2014). Envolvimento académico de 622
estudantes de engenharia: Contributos para a validação interna e externa de uma escala 623
de avaliação. Revista Eletrónica de Psicologia, Educação e Saúde, 4(1), 142–155. 624
http://www.revistaepsi.com 625
Costa, A. R., & Marôco, J. (2017). Inventário de envolvimento académico dos estudantes 626
do Ensino Superior (USEI). In L. S. Almeida, M. R. Simões, & M. M. Gonçalves 627
(Eds.), Adaptação, desenvolvimento e sucesso académico dos estudantes do ensino 628
superior: Instrumentos de avaliação (pp. 33–44). Braga, Portugal: ADIPSIEDUC. 629
Crutzen, R., & Peters, G.-J. Y. (2017). Scale quality: Alpha is an inadequate estimate and 630
factor-analytic evidence is needed first of all. Health Psychology Review, 11(3), 242– 631
247. doi:10.1080/17437199.2015.1124240 632
Davidov, E., Meuleman, B., Cieciuch, J., Schmidt, P., & Billiet, J. (2014). Measurement 633
equivalence in cross-national research. Annual Review of Sociology, 40(1), 55–75. 634
doi:10.1146/annurev-soc-071913-043137 635
Dılekmen, M. (2007). Orientation program and adaptation of university students. 636
Psychological Reports, 101(7), 1141–1144. doi:10.2466/PR0.101.7.1141-1144 637
Eccles, J., & Wang, M.-T. (2012). So what is student engagement anyway? In S. L. 638
Christenson, A. L. Reschly, & C. Wylie (Eds.), Handbook of research on student 639
engagement (pp. 133–145). Boston, MA, USA: Springer. doi:10.1007/978-1-4614-640
2018-7_6 641
Edwards, M. C., Houts, C. R., & Wirth, R. J. (2017). Measurement invariance, the lack 642
thereof, and modeling change. Quality of Life Research, 1–9. doi:10.1007/s11136-643
017-1673-7 644
Elmore, G. M., & Huebner, E. S. (2010). Adolescents’ satisfaction with school experiences: 645
Relationships with demographics, attachment relationships, and school engagement 646
behavior. Psychology in the Schools, 47(6), 525–537. doi:10.1002/pits.20488 647
Finn, J. D., & Zimmer, K. S. (2012). Student engagement: What is it? Why does it matter? 648
In S. L. Christenson, A. L. Reschly, & C. Wylie (Eds.), Handbook of research on 649
student engagement (pp. 97–131). Boston, MA, USA: Springer. doi:10.1007/978-1-650
4614-2018-7_5 651
Finney, S. J., & DiStefano, C. (2013). Non-normal and categorical data in structural 652
equation modeling. In G. R. Hancock & R. O. Mueller (Eds.), Structural equation 653
modeling: A second course (2nd ed., pp. 439–492). Charlotte, NC, USA: Information 654
Age Publishing. 655
Fredricks, J. A. (2015). Academic engagement. In J. D. Wright (Ed.), International 656
encyclopedia of the social & behavioral sciences (2nd ed., Vol. 1, pp. 31–36). San 657
Diego, CA, USA: Elsevier. doi:10.1016/B978-0-08-097086-8.26085-6 658
Fredricks, J. A., Blumenfeld, P. C., & Paris, A. H. (2004). School engagement: Potential of 659
the concept, state of the evidence. Review of Educational Research, 74(1), 59–109. 660
doi:10.3102/00346543074001059 661
Fredricks, J. A., Filsecker, M., & Lawson, M. A. (2016). Student engagement, context, and 662
adjustment: Addressing definitional, measurement, and methodological issues. 663
Learning and Instruction, 43, 1–4. doi:10.1016/j.learninstruc.2016.02.002 664
Fredricks, J. A., & McColskey, W. (2012a). The measurement of student engagement: A 665
comparative analysis of various methods and student self-report instruments. In S. L. 666
Christenson, A. L. Reschly, & C. Wylie (Eds.), Handbook of research on student 667
engagement (pp. 763–782). Boston, MA, USA: Springer. doi:10.1007/978-1-4614-668
2018-7_37 669
Fredricks, J. A., & McColskey, W. (2012b). The measurement of student engagement: A 670
comparative analysis of various methods and student self-report instruments. In S. L. 671
Christenson, A. L. Reschly, & C. Wylie (Eds.), Handbook of research on student 672
engagement (pp. 763–782). Boston, MA, USA: Springer. doi:10.1007/978-1-4614-673
2018-7_37 674
Fredricks, J. A., McColskey, W., Meli, J., Mordica, J., Montrosse, B., & Mooney, K. 675
(2011). Measuring student engagement in upper elementary through high school: A 676
description of 21 instruments (No. Issues & Answers report, REL 2011–No. 098). 677
Washington, DC, USA: Department of Education, Institute of Education Sciences, 678
National Center for Education Evaluation and Regional Assistance, Regional 679
Educational Laboratory Southeast. http://ies.ed.gov/ncee/edlabs 680
Gilardi, S., & Guglielmetti, C. (2011). University life of non-traditional students: 681
Engagement styles and impact on attrition engagement styles and impact on attrition. 682
The Journal of Higher Education, 82(1), 33–53. 683
doi:10.1080/00221546.2011.11779084 684
Green, S. B., & Yang, Y. (2009). Reliability of summed item scores using structural 685
equation modeling: An alternative to coefficient alpha. Psychometrika, 74(1), 155– 686
167. doi:10.1007/s11336-008-9099-3 687
Handelsman, M. M., Briggs, W. L., Sullivan, N., & Towler, A. (2005). A measure of 688
college student course engagement. The Journal of Educational Research, 98(3), 184– 689
192. doi:10.3200/JOER.98.3.184-192 690
Henseler, J., Ringle, C. M., & Sarstedt, M. (2015). A new criterion for assessing 691
discriminant validity in variance-based structural equation modeling. Journal of the 692
Academy of Marketing Science, 43(1), 115–135. doi:10.1007/s11747-014-0403-8 693
Hirschi, A. (2012). Callings and work engagement: Moderated mediation model of work 694
meaningfulness, occupational identity, and occupational self-efficacy. Journal of 695
Counseling Psychology, 59(3), 479–485. doi:10.1037/a0028949 696
Hodson, P., & Thomas, H. (2003). Quality assurance in Higher Education: Fit for the new 697
millennium or simply year 2000 compliant? Higher Education, 45(3), 375–387. 698
doi:10.1023/A:1022665818216 699
Hu, L., & Bentler, P. M. (1999). Cutoff criteria for fit indexes in covariance structure 700
analysis: Conventional criteria versus new alternatives. Structural Equation Modeling: 701
A Multidisciplinary Journal, 6(1), 1–55. doi:10.1080/10705519909540118 702
Jorgensen, T. D., Pornprasertmanit, S., Schoemann, A. M., & Rosseel, Y. (2018). 703
semTools: Useful tools for structural equation modeling (R package version 0.4-704
15.930) [Computer software]. https://cran.r-project.org/package=semTools 705
Kahu, E. R. (2013). Framing student engagement in higher education. Studies in Higher 706
Education, 38(5), 758–773. doi:10.1080/03075079.2011.598505 707
Kaplan, R. M., & Saccuzzo, D. P. (2013). Psychological testing: Principles, applications & 708
issues (8th ed.). Belmont, CA, USA: Wadsworth. 709
Kelley, K., & Pornprasertmanit, S. (2016). Confidence intervals for population reliability 710
coefficients: Evaluation of methods, recommendations, and software for composite 711
measures. Psychological Methods, 21(1), 69–92. doi:10.1037/a0040086 712
Kember, D., & Leung, D. Y. P. (2009). Development of a questionnaire for assessing 713
students’ perceptions of the teaching and learning environment and its use in quality 714
assurance. Learning Environments Research, 12(1), 15–29. doi:10.1007/s10984-008-715
9050-7 716
Klem, A. M., & Connell, J. P. (2004). Relationships matter: Linking teacher support to 717
student engagement and achievement. Journal of School Health, 74(7), 262–273. 718
doi:10.1111/j.1746-1561.2004.tb08283.x 719
Kline, R. B. (2016). Principles and practice of structural equation modeling (4th ed.). New 720
York, NY, USA: The Guildford Press. 721
Kong, Q., Wong, N.-Y., & Lam, C.-C. (2003). Student engagement in mathematics: 722
Development of instrument and validation of construct. Mathematics Education 723
Research Journal, 15(1), 4–21. doi:10.1007/BF03217366 724
Krause, K.-L., & Coates, H. (2008). Students’ engagement in first-year university. 725
Assessment & Evaluation in Higher Education, 33(5), 493–505. 726
doi:10.1080/02602930701698892 727
Kuh, G. D. (2001). Assessing what really matters to student learning: Inside The National 728
Survey of Student Engagement. Change: The Magazine of Higher Learning, 33(3), 729
10–17. doi:10.1080/00091380109601795 730
Kuh, G. D. (2005). Student engagement in the first year of college. In M. L. Upcraft, J. N. 731
Gardner, & B. O. Barefoot (Eds.), Challenging and supporting the first-year student: 732
A handbook for improving the first year of college (pp. 86–107). San Francisco, CA, 733 USA: Jossey-Bass. 734 http://www.ncsu.edu/uap/transition_taskforce/documents/documents/ReferenceMateri 735 alPart3.pdf 736
Kuh, G. D. (2009). The National Survey of Student Engagement: Conceptual and empirical 737
foundations. New Directions for Institutional Research, 2009(141), 5–20. 738
doi:10.1002/ir.283 739
Lee, J.-S. (2014). The relationship between student engagement and academic performance: 740
Is it a myth or reality? The Journal of Educational Research, 107(3), 177–185. 741
doi:10.1080/00220671.2013.807491 742
Lin, S.-H., & Huang, Y.-C. (2018). Assessing college student engagement: Development 743
and validation of the student course engagement scale. Journal of Psychoeducational 744
Assessment, 36(7), 694–708. doi:10.1177/0734282917697618 745
Mandernach, B. J. (2015). Assessment of student engagement in higher education: A 746
synthesis of literature and assessment tools. International Journal of Learning, 747
Teaching and Educational Research, 12(2), 1–14. doi:10.1073/pnas.94.17.9499 748
Mardia, K. V. (1970). Measures of multivariate skewness and kurtosis with applications. 749
Biometrika, 57(3), 519–530. doi:10.1093/biomet/57.3.519 750
Marôco, J. (2014). Análise de equações estruturais: Fundamentos teóricos, software & 751
aplicações (2nd ed.). Pêro Pinheiro, Portugal: ReportNumber. 752
Maroco, J., Maroco, A. L., & Campos, J. A. D. B. (2014). Student’s Academic Efficacy or 753
Inefficacy? An Example on How to Evaluate the Psychometric Properties of a 754
Measuring Instrument and Evaluate the Effects of Item Wording. Open Journal of 755
Statistics, 04(06), 484–493. doi:10.4236/ojs.2014.46046 756
Marôco, J., Marôco, A. L., Campos, J. A. D. B., & Fredricks, J. A. (2016). University 757
student’s engagement: Development of the University Student Engagement Inventory 758
(USEI). Psicologia: Reflexão e Crítica, 29(21), 1–12. doi:10.1186/s41155-016-0042-8 759
Marsh, H. W., Lüdtke, O., Muthén, B. O., Asparouhov, T., Morin, A. J. S., Trautwein, U., 760
& Nagengast, B. (2010). A new look at the big five factor structure through 761
exploratory structural equation modeling. Psychological assessment, 22(3), 471–491. 762
doi:10.1037/a0019227 763
McCoach, D. B., Gable, R. K., & Madura, J. P. (Eds.). (2013). Evidence based on relations 764
to other variables: Bolstering the empirical validity arguments for constructs. In 765
Instrument development in the affective domain (3rd ed., pp. 209–248). New York, 766
NY, USA: Springer. doi:10.1007/978-1-4614-7135-6_6 767
McDonald, R. P. (1999). Test theory: A unified treatment. Mahwah, NJ, USA: Routledge. 768
doi:10.4324/9781410601087 769
Millsap, R. E., & Yun-Tein, J. (2004). Assessing factorial invariance in ordered-categorical 770
measures. Multivariate Behavioral Research, 39(3), 479–515. 771
doi:10.1207/S15327906MBR3903_4 772
National Research Council, & Institute of Medicine. (2004). Engaging schools: Fostering 773
school students’ motivation to learn. Washington, DC, USA: National Academies 774
Press. doi:10.17226/10421 775
Pascarella, E. T., & Terenzini, P. T. (2005). How college affects students: A third decade of 776
research (Vol. 2). San Francisco, CA, USA: Jossey-Bass. 777
R Core Team. (2018). R: A language and environment for statistical computing (version 778
3.5.1) [Computer software]. Vienna, Austria: R Foundation for Statistical Computing. 779
https://www.r-project.org/ 780
Raykov, T. (2001). Estimation of congeneric scale reliability using covariance structure 781
analysis with nonlinear constraints. The British Journal of Mathematical and 782
Statistical Psychology, 54, 315–323. doi:10.1348/000711001159582 783
Reis, D., Xanthopoulou, D., & Tsaousis, I. (2015). Measuring job and academic burnout 784
with the Oldenburg Burnout Inventory (OLBI): Factorial invariance across samples 785
and countries. Burnout Research, 2(1), 8–18. doi:10.1016/j.burn.2014.11.001 786
Reschly, A. L., & Christenson, S. L. (2012a). Jingle, jangle, and conceptual haziness: 787
Evolution and future directions of the engagement construct. In S. L. Christenson, A. 788
L. Reschly, & C. Wylie (Eds.), Handbook of research on student engagement (pp. 3– 789
19). Boston, MA, USA: Springer. doi:10.1007/978-1-4614-2018-7_1 790
Reschly, A. L., & Christenson, S. L. (2012b). Jingle, jangle, and conceptual haziness: 791
Evolution and future directions of the engagement construct. In S. L. Christenson, A. 792
L. Reschly, & C. Wylie (Eds.), Handbook of research on student engagement (pp. 3– 793
19). Boston, MA, USA: Springer. doi:10.1007/978-1-4614-2018-7_1 794
Revelle, W. (2017). psych: Procedures for psychological, psychometric, and personality 795
research (R package version 1.7.8) [Computer software]. Evanston, IL: Northwestern 796
University. https://cran.r-project.org/package=psych 797
Revelle, W., & Zinbarg, R. E. (2009). Coefficients alpha, beta, omega, and the glb: 798
Comments on sijtsma. Psychometrika, 74(1), 145–154. doi:10.1007/s11336-008-9102-799
z 800
Rios, J., & Wells, C. (2014). Validity evidence based on internal structure. Psicothema, 801
26(1), 108–16. doi:10.7334/psicothema2013.260 802
Rodriguez, A., Reise, S. P., & Haviland, M. G. (2016). Applying bifactor statistical indices 803
in the evaluation of psychological measures. Journal of Personality Assessment, 98(3), 804
223–237. doi:10.1080/00223891.2015.1089249 805
Rosseel, Y. (2012). lavaan: An R package for structural equation modeling. Journal of 806
Statistical Software, 48(2), 1–21. http://www.jstatsoft.org/v48/i02/paper 807
RStudio Team. (2017). RStudio: Integrated development for R (version 1.1.345) [Computer 808
software]. Boston, MA, USA: RStudio, Inc. http://www.rstudio.com/ 809
Rubia, E. A. de la, Zhu, H., Ellis, S., Waring, E., & Quinn, M. (2017). skimr: skimr (R 810
package version 0.9000) [Computer software]. 811
Satorra, A., & Bentler, P. M. (2001). A scaled difference chi-square test statistic for 812
moment structure analysis. Psychometrika, 66(4), 507–514. doi:10.1007/BF02296192 813
Schaufeli, W. B., & Bakker, A. B. (2010). Defining and measuring work engagement: 814
Bringing clarity to the concept. In A. B. Bakker & M. P. Leiter (Eds.), Work 815
engagement: A handbook of essential theory and research (pp. 10–24). New York, 816
NY: Psychology Press. http://psycnet.apa.org/psycinfo/2010-06187-002 817
Schaufeli, W. B., Martinez, I. M., Marques-Pinto, A., Salanova, M., & Bakker, A. B. 818
(2002). Burnout and engagement in university students: A cross-national study. 819
Journal of Cross-Cultural Psychology, 33(5), 464–481. 820
doi:10.1177/0022022102033005003 821
Schaufeli, W. B., Martinez, I. M., Marques Pinto, A., Salanova, M., & Bakker, A. B. 822
(2002). Burnout and engagement in university students: A cross-national study. 823
Journal of Cross-Cultural Psychology, 33(5), 464–481. 824
doi:10.1177/0022022102033005003 825
semTools Contributors. (2016). semTools: Useful tools for structural equation modeling (R 826
package version 0.4-14) [Computer software]. https://cran.r-827
project.org/package=semTools 828
Senior, C., & Howard, C. (2015). Editorial: The state of the art in student engagement. 829
Frontiers in Psychology, 6, 1–2. doi:10.3389/fpsyg.2015.00355 830
Sheppard, S. L. (2011). School engagement: A ‘danse macabre’? Journal of Philosophy of 831