R E S E A R C H A R T I C L E
Open Access
Using discrete event simulation to compare the
performance of family health unit and primary
health care centre organizational models in
Portugal
André S Fialho
1, Mónica D Oliveira
2*and Armando B Sá
3Abstract
Background: Recent reforms in Portugal aimed at strengthening the role of the primary care system, in order to improve the quality of the health care system. Since 2006 new policies aiming to change the organization, incentive structures and funding of the primary health care sector were designed, promoting the evolution of traditional primary health care centres (PHCCs) into a new type of organizational unit - family health units (FHUs). This study aimed to compare performances of PHCC and FHU organizational models and to assess the potential gains from converting PHCCs into FHUs.
Methods: Stochastic discrete event simulation models for the two types of organizational models were designed and implemented using Simul8 software. These models were applied to data from nineteen primary care units in three municipalities of the Greater Lisbon area.
Results: The conversion of PHCCs into FHUs seems to have the potential to generate substantial improvements in productivity and accessibility, while not having a significant impact on costs. This conversion might entail a 45% reduction in the average number of days required to obtain a medical appointment and a 7% and 9% increase in the average number of medical and nursing consultations, respectively.
Conclusions: Reorganization of PHCC into FHUs might increase accessibility of patients to services and efficiency in the provision of primary care services.
Keywords: Family health units, primary care reforms, discrete event simulation, performance indicators, Portugal
Background
General information
Primary health care services of good quality are widely recognized as critical for the improvement of health care systems [1-3], in particular when health care sys-tems are being challenged by aging populations, an increased prevalence of chronic diseases, complexities of team-based contemporary practice and limited funding. Policy makers have been experimenting with different models of primary care delivery in order to enhance comprehensiveness, integration and accessibility [4]. In
Portugal a major reform of primary health care was started in 2006 in order to address those challenges.
The Portuguese National Health Service (NHS) is defined as universal, nearly free at the point of use and funded by general taxation [5]. Although there are over-lapping health systems (health insurance schemes from employer organizations and private health insurance plans) and a high use of private services in some special-ties, most primary care services are provided by the NHS [6]. Primary care represents the first level of con-tact with the health system: general practitioners/family doctors (GPs) act both as care providers and gatekeepers to secondary care. Patients must register with a GP from a health centre, preferably in their area of residence, so they can be entitled to home visits if the need arises.
* Correspondence: [email protected]
2
CEG-IST, Centre for Management Studies of Instituto Superior Técnico, Technical University of Lisbon, Av. Rovisco Pais, Lisbon 1049-001, Portugal Full list of author information is available at the end of the article
© 2011 Fialho et al; licensee BioMed Central Ltd. This is an Open Access article distributed under the terms of the Creative Commons Attribution License (http://creativecommons.org/licenses/by/2.0), which permits unrestricted use, distribution, and reproduction in any medium, provided the original work is properly cited.
In 2005, primary care services were provided in 351 Primary Health Care Centers (PHCCs) and most of these (254) provided 12 or 24-hour health services for acute illness and some emergency care [7]. In the same year, on average, each PHCC had 30388 registered patients, employed 20 GPs and 20 nurses, and provided 75000 consultations, with an average of 1497 registered patients per GP. An additional amount of non-registered patients (on average 3376, approximately 10% of the total number of patients) sought care in PHCCs. An average of 15000 urgent or emergency consultations per PHCC was performed in that same year [7].
Until 2005, PHCCs had little autonomy and were depending on Regional Health Administrations for rele-vant management decisions [8]. At the time several pro-blems in the primary care system were acknowledged. These problems included (i) small and inadequate num-bers of GPs in some regions, together with the retire-ment of a growing number of GPs; (ii) high number of people not registered with a GP (10.6% according to [7]); (iii) high dissatisfaction of patients and doctors with primary care provision; and (iv) unnecessary over-use of hospital emergency services related to difficult access to primary care services [9]. In 1998 an experi-mental organizational model was launched by the Health Ministry, and 20 groups of GPs organized them-selves in small autonomous functional units inside the existing health centres. The payment system included a capitation fraction. The evolution of these groups was closely monitored by the Ministry of Health, and rele-vant efficiency gains were identified [9,10]. This observa-tion led to the development, in 2006, of a new organizational model for primary health care units, which were designated family health units (FHUs) [11]. These new units loosely resemble family health net-works in Canada [12] and British practices. In PHCCs, health care centres operate under a rigid chain of com-mand and control, and professionals are employed as civil servants through a complicated bureaucratic pro-cess. FHUs, on the other hand, are self-organized multi-professional teams formed by GPs, nurses, managers and other professionals. These teams have the autonomy to define their own working processes and to negotiate goals to be met with local health authorities [13]. A new payment system was set for these units.
Some differences between the PHCC and FHU organi-zational models should be highlighted for a better understanding of the changes involved. In some PHCCs acute cases are treated in separate facilities, staffed by the GPs of the PHCC, with opening hours varying between 3 and 24 hours, depending on the location of the PHCC; in FHUs acute cases are treated by GPs dur-ing their normal workdur-ing hours. In most PHCCs only medical consultations are scheduled; in FHUs regular
nursing appointments must also be scheduled. In PHCCs a fixed salary is the norm; in some FHUs (known as model B FHUs) remuneration is compounded by a smaller fixed salary fraction plus a series of supple-ments: (i) capitation (up to a defined ceiling); (ii) a com-plement for the provision of specific services under contract beyond the basic job description; (iii) a pre-mium for achieving negotiated goals; and (iv) fee-for-service payments for house calls [14]. Many FHUs adopted model B as their remuneration system. In this paper, we focus on the FHU with a model B remunera-tion system.
By the end of 2010 299 FHUs were in place and in 2011 78 new ones are opening [15]. FHUs are expected to (i) increase motivation and satisfaction of both patients and health care professionals, (ii) outperform PHCCs in terms of quality, access and efficiency [8,11], and (iii) implicitly confirm the importance of team building and collaboration in the delivery of primary care services [16]. The FHU organizational model brought major changes in appointment scheduling, acute care delivery and staff payment system [17,18].
FHUs show a positive impact in preliminary evalua-tions of the reform process. According to Campos [9], these positive signs started to become visible at the end of 2007, with decreased demand of out-of-hours appointments, better doctor-patient relationship and higher degrees of satisfaction and motivation both from patients and professionals. In two complementary stu-dies, Gouveia et al. [19,10] analysed the cost differences between PHCCs and FHUs, using econometric analysis. Results from those two studies show that, in spite of a higher level of GPs’ remuneration in FHUs, global costs were lower in FHUs due to comparatively lower costs in key components of health care, such as on the spending of diagnostic tests, drugs and other procedures. How-ever, and as far as we know, no studies compared the impact of FHUs on accessibility and efficiency. Also, the effect of converting PHCCs into FHUs has not been quantified. Most studies evaluating health care reforms in other countries did not quantify the impact of new organizational models and, when they did, they mostly analysed the impact on a narrow range of indicators.
Simulation modelling in health care
Health care simulation models typically attempt to pro-vide support for better operational decision making and planning [20]. Several health care administrators used discrete event simulation (DES) models as effective tools for allocating resources in the improvement of patient flow, while reducing health care delivery costs and increasing patient satisfaction [21]. The choice of a DES model to model PHCCs and FHUs is justified by its capacity for reproducing a systems’ behaviour through
the modelling of the relation between the inputs of a primary care delivery system (including patients, doc-tors, nurses, patient scheduling and patient routing) and various outputs measures (e.g. waiting times, patient throughput, staff utilization) [22]. Systems simulated with DES models consist of discrete entities which occupy discrete states that will change over time. Adapt-ing examples from Pidd [23], a primary care centre will include individual patients who are entities and whose states may include ‘being admitted’, ‘waiting for a con-sultation’, ‘being in a consultation with doctor’, and so on. An entity is thus an object whose behaviour within the model will be explicitly tracked as the simulation proceeds. Similarly, doctors and nurses who treat the patients may themselves be regarded as entities that change state. Hence, a DES model aims to capture the important features of the system in terms of entities and states. DES models have a time dimension as entities change state through time; have activities (e.g. consulta-tions) that may require the co-operation of more than a single class of entity (e.g. between doctors and patients); and contain processes in the form of a chronological sequence of activities through which an entity must or may pass (e.g. patients pathways). Each class of entity (e. g. patients of types A and B) will have one or more pro-cesses associated with it (e.g. will have associated differ-ent pathway(s)), and when an differ-entity that is a member of a specific class (e.g. a single patient A) appears in the simulation, each process becomes a route through which the entity will pass (e.g. single patient A will pass through its associated pathway(s)). Thus, building a DES model needs a set of logical statements, expressed in a computable form, describing how the entities change state. Another feature of DES models, being stochastic simulation models, is that they allow the accounting for uncertainty in the demand and delivery of health care (e.g. in the time a patient spends in a consultation). A detailed explanation of DES models can be found else-where [23,24].
Despite the potential of DES models to analyse quality and efficiency improvements in health care systems [25], we did not find any studies using DES to evaluate orga-nizational reforms in the primary care sector. Most simulation and DES studies were developed at the micro level, mainly focusing on the problems of scheduling and capacity planning (available reviews of DES models can be consulted in [21,20,25]). These studies seldom modelled whole health care units [25].
Few studies compared the performance of PHCCs and FHUs and, to the best of our knowledge, no study assessed the impact of converting PHCCs into FHUs. In this work, we used DES to model PHCC and FHU orga-nizational models and to analyse the impact of expand-ing current primary care reforms in Portugal. We
developed DES models to compare the impacts of adopting the PHCC or FHU organizational models on accessibility, productivity and costs and assessed the gains that could potentially be achieved with FHU adop-tion. This paper brings attention to the usefulness of DES models in the evaluation of organizational models and to the potential impacts of expanding the present Portuguese primary care reform.
Methods
Two templates of DES models, for PHCCs and FHUs, were designed and implemented in the Simul8 computer software package (version 13.0) [26]. These two tem-plates were applied and validated to a sample of PHCCs and FHUs from the Greater Lisbon area. Finally, the conversion of PHCCs into FHUs was modelled.
Conceptual models
We started by representing two conceptual models that included the processes and flows displayed in Figure 1. Flows are shown by five different sets of arrows that represent: (i) patients entering the health care unit, (ii) internal flows of patients inside the unit, (iii) patients re-entering the system for follow-up consultations, (iv) exit of patients from the unit and (v) the model’s speci-fic remuneration type.
Four types of consultations were modelled in both types of organizational units - medical, emergency/acute and nursing type 1 and type 2 consultations (with nur-sing type 1 covering diabetes, child or maternal consul-tations, and type 2 covering consultations for vaccination and for other types of nursing treatments). Key differences between PHCCs and FHUs are summar-ized in Table 1. Each of these features was specifically taken into account when building the DES models.
Case study and computational implementation
The conceptual models for the PHCCs and FHUs were implemented using the Simul8 DES software [26]. The Simul8 software is a visual interactive modelling system for DES [23] that enables the creation of a computer model that replicates a process containing discrete enti-ties and events occurring at discrete times. Figure 2 pro-vides a screenshot of the Simul8 software showing, for a PHCC, patients’ pathways, waiting rooms, doctors’ cabi-nets, entry and exit points. The Simul8 software includes the Visual Logic programming language that was used to program the multiple features of PHCCs and FHUs. These features included units’ opening times, doctors’ working hours, and the routes to be followed by patients requiring different types of care.
The models were applied to a real case study includ-ing a convenience sample of nineteen primary health care units (thirteen PHCCs and six FHUs) from the
Figure 1 Top: Conceptual model of a PHCC; Bottom: Conceptual model of an FHU. (1) Patients entering the health care unit, (2) internal flows of patients inside the unit, (3) patients re-entering the system for follow-up consultations, (4) exit of patients from the unit and (5) the model’s specific remuneration type.
Table 1 Key differences between PHCCs and FHUs programmed in the DES model
PHCC FHU
Timetable Working days (8am - 8pm)
Weekend (10am - 8pm)
Working days (8am - 8pm) Appointment
scheduling
Medical Medical and nursing
Medical consultations
There are patients who are not registered with a GP All patients are registered with a GP Emergency/acute
consultations
Specific timetable to attend these patients, and physicians exclusively allocated to the permanent health unit
Patients are seen by their own GP during FHU normal working hours
Remuneration 42 hours/week-based salary 35 hours/week-based salary plus variable
Greater Lisbon area. This area comprises nine munici-palities, and our work included units from three of these municipalities - Lisboa, Oeiras and Cascais. This is an urban and densely populated area, with a population growth rate above the national average [9], which places increased pressure on health care provision.
An individual DES model was implemented for each of the nineteen primary health care units. Public data from multiple sources was used to build the model for
each FHU and PHCC, namely: (i) reports of the guese Ministry of Health [7,17]; (ii) data from the Portu-guese National Statistical Institute [27,28]; (iii) two reports commissioned by the Portuguese Health Eco-nomics Association [10,19], and (iv) specific information from local FHU reports [29-33]. In a few cases, where data was missing, data were obtained through direct contact with the units. In Tables 2 and 3 we show infor-mation on key parameters and probability distributions
Figure 2 Computational implementation for a single PHCC.
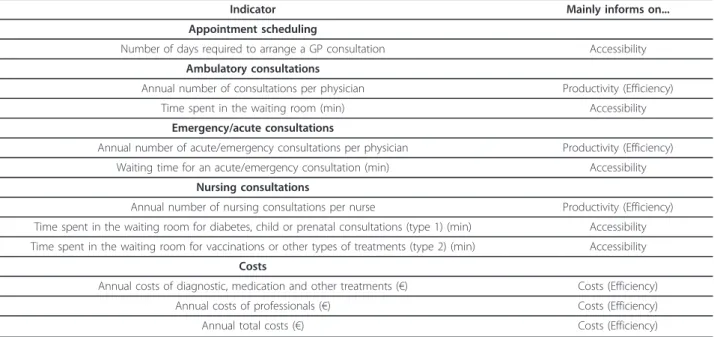
Table 2 List of key performance indicators used in the model
Indicator Mainly informs on...
Appointment scheduling
Number of days required to arrange a GP consultation Accessibility
Ambulatory consultations
Annual number of consultations per physician Productivity (Efficiency)
Time spent in the waiting room (min) Accessibility
Emergency/acute consultations
Annual number of acute/emergency consultations per physician Productivity (Efficiency)
Waiting time for an acute/emergency consultation (min) Accessibility
Nursing consultations
Annual number of nursing consultations per nurse Productivity (Efficiency) Time spent in the waiting room for diabetes, child or prenatal consultations (type 1) (min) Accessibility Time spent in the waiting room for vaccinations or other types of treatments (type 2) (min) Accessibility
Costs
Annual costs of diagnostic, medication and other treatments (€) Costs (Efficiency)
Annual costs of professionals (€) Costs (Efficiency)
used in the models and on the performance indicators (PI) used to compare the FHUs with the PHCCs.
The PIs described in Table 2 are process indicators related to the provision of primary care services that, using the taxonomy of Donabedian [34], capture two dimensions of quality in health care delivery: the ease with which persons can obtain care, i.e. accessibility; and the ability to lower the cost of care without dimin-ishing attainable improvements in health, i.e. efficiency. Efficiency was further decomposed into productivity indicators - on the production per unit of input (for example, consultations per GP) -, and on the costs incurred to produce that amount (for example, total costs for delivering those consultations). One should note, however, that given the structure of the DES model, indicators of accessibility and productivity in Table 2 are related - for example, if each GP provides a higher level of consultations, not only his/her productiv-ity increases, but also accessibilproductiv-ity as measured by wait-ing times for consultations is expected to decrease.
The key parameters of the model (Table 3) were cali-brated with real data from the year 2007 and included information regarding resources, production and opera-tional costs for each unit. Given the variability and uncertainty associated with some parameters of the model, as shown in Table 3 several parameters are asso-ciated with a probability distribution. As a result, the outputs/PIs of the model are not point estimates but probability distributions. While some PIs produced by the DES model could be compared with real data, the model also generated new information for which real data was not available (for example, on waiting times).
Because of difficulties in obtaining costs from FHUs, fol-lowing the assumptions used by Gouveia et al. [10], we used cost data from the experimental units previously described, and that were in operation in 2005, to simu-late FHU costs.
Each of the nineteen implemented models was inde-pendently run using a trial of five runs (i.e. using differ-ent sets of random numbers). As the number of runs directly affects the accuracy and the time required to run the model [35], a compromise was needed so as to run the models with good accuracy and within a reason-able amount of time, leading to the choice of five runs. Each trial of five runs for each primary care unit required, on average, two hours of processing, using an Intel® CPU 1.60 GHz with 2.00 GB of RAM together with Simul8 13.0 and Microsoft Excel 2003 software. Each run included two time periods. First, a warm-up period was used so that demand, supply, queues and other parameters of the models could reach similar values to the real system. Following literature guidelines [35], a warm-up period of 52 weeks (one complete year) was found to be adequate. The remaining period was the results collection period that entailed a working year period of 50 weeks. Using the information from five runs, the results were returned in the form of 95% con-fidence intervals (CIs). According to Hauge and Paige [35], by ensuring that the 95% CIs returned by the mod-els would enclose the real data relative to the year 2007, it was possible to confirm their validity and conse-quently use the models to simulate new cases (e.g. the conversion of a PHCC into a FHU). PIs presented in the form of CI should be interpreted as the result of
Table 3 List of the key parameters and probabilistic distributions used in the model
Parameter Value Source of information
Entry Inter-arrival time Average distribution Activity reports of each health care unit
Type of consultation Probability profile
Number of GPs Predefined according to each unit Days for the consultation Predefined according to each unit GP’s schedule Predefined according to each unit
and respective GP Internal flows Nurse’s schedule Predefined according to each unit
and respective nurse
&
Duration of adult consultations Log normal distribution data provided by health care units through their direct contact Duration of other consultations Log normal distribution
Duration of nursing type 1 consultations Average distribution Duration of nursing type 2 consultations Average distribution Remuneration Cost per consultation with professionals PHCC (€13.25)
FHU (€16.32)
[10] Cost per consultation of diagnostic exams,
drugs and other treatments
PHCC (€39.20) FHU (€29.20)
[10]
variability and uncertainty in several inputs of the model, displayed in Table 3. The validation results for the total number of ambulatory consultations performed in a year are presented as an example in Table 4 (results per health care unit).
Modelling the conversion of a PHCC into a FHU
Converting thirteen PHCCs into FHUs demanded for the outline of a set of assumptions regarding the legisla-tion that defined FHUs features and the guidelines for FHUs creation (resources, composition, size, operating mode and financing rules) [36,37]. The following proce-dure was adopted: first, depending on its dimension, each PHCC was divided into smaller subunits with six to nine physicians, six to nine nurses and, on average, five administrative staff; each of these smaller subunits corresponded to an independent FHU. Second, in each of these subunits the permanent acute care unit was dis-continued and GPs working in that unit were assigned exclusively for medical consultations in the FHU. In this way, as previously explained, acute cases started to be treated in the FHU regular working hours. Third, nur-sing care started to be scheduled, instead of patients showing up (randomly) for unscheduled nursing consul-tations. Fourth, remuneration of the health care profes-sionals was changed from the salary without incentives to the model B remuneration system previously described. Finally, the demand from each PHCC was
split between the corresponding FHUs, as a proportion of the GP resources allocated to each FHU.
Results
Tables 5 and 6 present the PI values obtained for the PHCC and FHU organizational models, and changes in the PI values due to the conversion of the thirteen PHCCs into FHUs, respectively. Given the uncertainty and variability related with the estimation of several parameters of the DES model that lead to the use of the probability distributions described in Table 2 the PIs/ outputs of the model (shown in Tables 5 and 6) are pre-sented in the form of CIs.
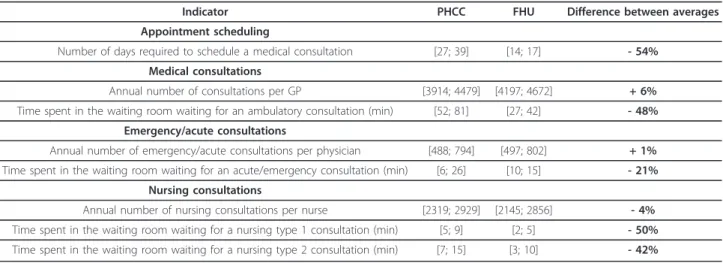
Results displayed in Table 5 show that the average number of days a patient had to wait for an appoint-ment with a GP was 54% lower in the FHUs (33 vs. 15 days on average). The number of consultations by GP was 6% higher in FHUs, while a similar number of emergency/acute consultations were performed by GPs in each organizational model per year. Waiting times for emergency/acute consultations were on average shorter in FHUs, and the annual number of nursing consulta-tions was slightly lower in FHUs. Finally, the average time spent in the waiting room for a nursing appoint-ment was substantially lower in FHUs.
Changes in the PIs resulting from the conversion of the thirteen PHCCs into FHUs are shown in Table 6. We found a 45% reduction in the average number of
Table 4 Key data used for model validation (95% confidence intervals reported in brackets)
Total number of medical consultations
Real Model Variation (%)
Benfica PHCC Benfica 38464 [38356; 39579] [-0.28; 2.90]
PHCC Marchal Carmona 56609 [56948; 58011] [0.6; 2.48]
PHCC Carnide 26417 [25912; 26200] [-1.91; -0.82]
FHU Rodrigues Migueis 30065 [29676; 30238] [-1.29; 0.58]
Sete Rios PHCC Sete Rios 141671 [139235; 140607] [-1.71; 0.75]
FHU Tílias 26425 [24188; 25189] [-8.47; -4.61] Carnaxide PHCC Linda-a-Velha 86720 [83899; 84913] [-3.25; -2.08] PHCC Algés 54141 [53724; 54591] [-1.27; 0.33] FHU Dafundo 33237 [33208; 33637] [-0.08; 1.20] Oeiras PHCC Oeiras 83480 [78246; 79901] [-6.27; -4.29] PHCC Paço de Arcos 70853 [67808; 69567] [-4.30; -1.82] PHCC Barcarena 21783 [21696; 22109] [-0.40; 1.47] FHU Delta 34042 [34135; 34574] [0.27; 1.56]
FHU São Julião 41186 [40538; 41164] [-1.57; -0.05]
Cascais PHCC Cascais 76881 [78160; 80415] [1.66; 4.60]
PHCC Estoril 61556 [61758; 63117] [0.33; 2.54]
PHCC Alvide 34636 [33785; 35599] [-2.46; 2.78]
PHCC Alcabideche 30631 [30883; 31094] [0.81; 1.51]
days required to wait for a GP appointment (from an average of 29 to 16 days); a 36% reduction in the aver-age time spent in the waiting room for medical consul-tations (from an average of 59 to 38 minutes); a 7% increase in the average number of medical consultations performed (from an average of 4250 to 4539 annual consultations per GP); a 9% increase in nursing ments (from an average of 2638 to 2876 annual appoint-ments per nurse); no significant changes in the average number of emergency/acute consultations; and a 25% increase in the costs of professionals, together with a 16% reduction in the costs of diagnostic exams, drugs and other procedures, leading to a 5% average reduction
in total costs (from an average of €57 million to €54 million per year). When the costs of professional and the costs of diagnostic exams, drugs and other treat-ments per consultation are increased by 10% during the conversion from PHCCs into FHUs, total costs increase by 5%.
Discussion
Limitations and assumptions used must be taken into account. All models are simplifications and are not able to represent the complexities of entire systems. The simulation models for PHCCs and FHUs do not inform about the impact of organizational reforms on several
Table 6 Results obtained after converting the PHCC into the FHU, for the whole sample of units (point estimates for costs and 95% confidence intervals for the remaining PIs, and percentage differences of averages)
Indicator Before Conversion After Conversion Difference between averages Accessibility
Number of days required to schedule a medical consultation [24; 34] [14; 17] -45% Time spent in the waiting room waiting for a medical consultation (min.) [48; 70] [33; 43] -36% Time spent in the waiting room waiting for an acute/emergency consultation (min.) [9; 21] [12; 15] -12% Time spent in the waiting room waiting for a nursing type 1 consultation (min.) [4; 8] [3; 5] -38% Time spent in the waiting room waiting for a nursing type 2 consultation (min.) [7; 13] [5; 8] -38%
Productivity
Annual number of medical consultations per physician [4037; 4463] [4390; 4688] 7% Annual number of nursing consultations per nurse [2581; 2695] [2589; 3169] 9% Annual number of emergency/acute consultations per physician [567; 799] [616; 772] 2%
Costs
Annual costs with professionals (1000000€) (and with 10% increase in each type of cost, after the conversion, in italic) 15 (15) 19 (19) 25% 38% Annual costs with means of diagnostic, medication and other treatments per primary care unit
(1000000€) (and with 10% increase in each type of cost, after the conversion, in italic)
41 (41) 35 (34) -16% -7% Annual total costs (1000000€) (and with 10% increase in each type of cost, after the conversion, in
italic) 57 (57) 54 (53) -5% 5%
Table 5 95% confidence intervals for the PIs for the PHCCs and the FHUs, and percentage differences of averages
Indicator PHCC FHU Difference between averages
Appointment scheduling
Number of days required to schedule a medical consultation [27; 39] [14; 17] - 54% Medical consultations
Annual number of consultations per GP [3914; 4479] [4197; 4672] + 6%
Time spent in the waiting room waiting for an ambulatory consultation (min) [52; 81] [27; 42] - 48% Emergency/acute consultations
Annual number of emergency/acute consultations per physician [488; 794] [497; 802] + 1% Time spent in the waiting room waiting for an acute/emergency consultation (min) [6; 26] [10; 15] - 21%
Nursing consultations
Annual number of nursing consultations per nurse [2319; 2929] [2145; 2856] - 4% Time spent in the waiting room waiting for a nursing type 1 consultation (min) [5; 9] [2; 5] - 50% Time spent in the waiting room waiting for a nursing type 2 consultation (min) [7; 15] [3; 10] - 42%
policy dimensions, such as implications on equity and responsiveness. Because of the complexity and time required to run each PHCC and FHU model, it was not possible to run all the PHCC and FHU models within an integrated and interacting multi-facility system, a fea-ture strongly recommended for fufea-ture models. Such a system would allow for modelling interactions between the activity of PHCCs and FHUs located in the same area - for instance, it could be tested the impact in the whole system of moving unregistered patients from a PHCC to GP lists from another FHU; and the impact of converting one PHCC into several FHUs when demand for the services provided in these units is jointly mod-elled. While this would be expected to change accessi-bility results, productivity results would be expected to maintain given the high use of available resources. Another limitation was the use of past data to simulate behaviour: some of the data from the FHUs used the first operational FHUs as a reference. However, these units were run by highly motivated GPs who embraced the FHU project and were not afraid of organizational changes. Our results might thus overestimate the gains because of these motivational effects, and the future conversion of PHCCs into FHUs may generate compara-tively lower gains. Although motivational effects were clear during the implementation of the first FHUs, it can be argued that these effects will become less evident with time. In future studies self-selection issues in the creation of FHUs as time passes and more health care professionals become involved in FHUs should be evalu-ated. FHUs were assumed to have the same costs as the primary care units funded by the experimental system that operated in 2005 (following the assumptions used in [10]), and thus there might be an underestimation of costs for FHUs, in particular of costs with personnel. Sensitivity analysis shows that results on costs are very much dependent on the net effect of increased costs with professionals and decreased costs with diagnostic exams, drugs and other procedures, for which there is a margin for savings [6]. Finally, the study focused on urban PHCCs and FHUs. A similar study in rural areas could arguably produce different results because of dif-ferent demographics, health care needs, level of health care resources [38], as well as because of lower geo-graphic access to hospital services (it is hard to hypothe-size how these aspects could possibly change our results).
Our results suggest that there are significant potential gains in converting PHCCs into FHUs in terms of acces-sibility and productivity. Regarding the scheduling of consultations, a 45% difference in the waiting time for a consultation in a FHU was found. The number of medi-cal consultations performed by a GP per year was higher, on average, in FHUs, suggesting that, with the
same resources, the FHU organizational model entails a higher productivity. This conversion might also result in a 7% increase in the number of medical consultations (from 4250 to 4539 annual consultations per GP), potentially contributing to an increase in the number of consultations delivered to registered patients and to a decrease in the number of patients not registered with a GP (for instance, through an increase in the number of registered patients per GP), which, according to the Institute of Informatics and Financial Management in Health [7], amounts to 16% of the population in the Greater Lisbon area. Potential gains to be achieved by converting PHCCs into FHUs are partly explained by: (i) contrarily to PHCCs, in FHUs almost all medical time is dedicated to clinical activity, as opposed to PHCCs, where six hours a week on average are allocated to administrative and/or management tasks, thus leading to less time for clinical work; (ii) in FHUs each GP sees mainly patients from his/her patient’s list, and only for acute unscheduled consultations they see patients regis-tered with other GPs from the same FHU; whereas GPs in PHCCs provide a much higher proportion of consul-tations to patients not belonging to their own list or for patients that are not registered with a GP; and (iii) the transfer of GP from acute care in PHCC to a normal working schedule in FHUs. However, one should note that these productivity gains may be attenuated in the future if differences in weekly working hours disappear, giving place to similar weekly schedule for every GP, regardless of the type of primary care organization. These results also may suggest that, despite well-known difficulties with group practice work in primary care [39], teamwork in FHUs contributes to higher produc-tivity. These results are in line with previous studies which reported that there is scope for improving pro-ductivity and access of PHCCs [2].
No significant differences regarding emergency or acute cases were found between FHUs and PHCCs, meaning that the capacity for dealing with emergency situations was not compromised in an FHU-based model. Resources savings and improvements in accessi-bility can thus be expected in the FHU model regarding acute and emergency cases.
The results also show that the nursing appointments were 9% higher on average in a FHU. Setting up nursing appointments instead of the usual ‘first comes first served’ criterion seemed to allow nurses to carry out a higher number of consultations in the same time, thus contributing to gains in productivity.
Despite an increase in the number of medical consul-tations performed in FHUs, the results suggest that the time patients spend in the waiting room might, in fact, decrease. This may be explained by the use of empty slots between consultations, which, without loss in
quality, allow emergency and acute situations to be dealt with, and also enable the system to accommodate varia-bility in the duration of medical consultations. The results equally suggest that by having the nursing appointments previously set up, the waiting time of patients decreases, despite an increase in the number of appointments. It should be borne in mind that, despite gains in accessibility and productivity, adequacy and necessity of care were not addressed in this model.
The results on costs are in agreement with those pre-viously described [10]. Although when converting PHCCs into FHUs there is an increase in the cost with professionals, spending on diagnostic exams, drugs and other procedures decreases, leading to a decrease in total costs. It is important to mention that the costs analysed in this work (salaries, diagnostic exams, drugs and other treatments) accounted, on average, for 90% of the total costs in these units [18,19] and, given limita-tions of the cost data in use, should be interpreted as rough approximations.
Gains from creating FHUs in Portugal are in line with the evaluation of primary care reforms in other coun-tries. For example, in some provinces of Canada groups of physicians have been forming family health networks since 1998 [12], having contributed to improve accessi-bility of care to citizens [40]; successive reforms over the last 15 years in the English NHS that adopted new organizational forms (e.g. GP fundholding, Primary Care Trusts) and developed new pay-for-performance incen-tives, were shown to improve equity and quality of care [41].
Conclusions
In summary, the FHU organization model has the potential to generate gains in productivity and accessi-bility in the Portuguese primary care sector, while not having a significant impact on costs. This study shows that DES models may be useful to model primary health care systems and for testing the impact of new reforms [42]. Although it is difficult to represent all the com-plexities of a primary care unit within a simulation model, appropriate simplifications may provide an answer to that problem. The right level of detail is criti-cal in DES models [43] and a widely recognized guide-line, that we followed, was to keep the model as simple as possible while capturing the necessary features of interest [22].
Future work might explore the application of the DES model on improved and more complete data (in particu-lar on costs) and on PHCCs and FHUs located in other geographical areas with distinct features; running the models with new conditions (such as price changes); simulating the behaviour of several PHCCs and FHUs together in an integrated system, although this requires
either simplifying the models or higher computational power; and analysing the implications on health outcomes.
Abbreviations
CI: confidence interval; DES: discrete event simulation; ERR: experimental remuneration regimen; FHU: family health unit; GP: general practitioner; NHS: National Health Service; PHCC: primary health care centre; PI: performance indicator.
Acknowledgements
We thank Dr Laura Marques from Equipa Regional de Apoio de Lisboa e Vale do Tejo for making information available for this study.
Author details
1
Engineering Systems Division, Massachusetts Institute of Technology, 77 Massachusetts Avenue, 02139 Cambridge, MA, USA.2CEG-IST, Centre for
Management Studies of Instituto Superior Técnico, Technical University of Lisbon, Av. Rovisco Pais, Lisbon 1049-001, Portugal.3Instituto de Medicina
Preventiva, Faculdade de Medicina da Universidade de Lisboa, Av. Prof. Egas Moniz, Lisbon 1649-028, Portugal.
Authors’ contributions
ASF was responsible for the research process, data analysis and
interpretation and for writing the paper. MDO and ABS were responsible for the conception and design of the study and helped in the data collection, analysis and interpretation, as well as in the writing of the paper. All authors read and approved the final manuscript.
Competing interests
ASF and MDO declare no conflicts of interest. ABS was a member of the Mission for Primary Health Care, the Ministry of Health task force for the launch and implementation of the primary health care reforms reported in this paper.
Received: 12 January 2011 Accepted: 15 October 2011 Published: 15 October 2011
References
1. Starfield B, Shi LY, Macinko J: Contribution of primary care to health systems and health. Milbank Q 2005, 83(3):457-502.
2. Amado CAEF, Santos SP: Challenges for performance assessment and improvement in primary health care: The case of the Portuguese health centres. Health Policy 2009, 91:43-56.
3. Kringos DS, Boerma WGW, Hutchinson A, van der Zee J, Groenewegen PP: The breadth of primary care: a systematic literature review of its core dimensions. BMC Health Serv Res 2010, 10(6):1-13.
4. Hogg W, Rowan M, Russell G, Geneau R, Muldoon L: Framework for primary care organizations: the importance of a structural domain. Int J Qual Health C 2008, 20(5):308-313.
5. Oliveira MD, Pinto CG: Health care reform in Portugal: An evaluation of the NHS experience. Health Econ 2005, 14:S203-S220.
6. Barros PP, Simões JA: Portugal - Health System Review. In Health Systems in Transition. Volume 9. European Observatory Health Care Systems; 2007. 7. Instituto de Gestão Informática e Financeira de Saúde: Estatística do
Movimento Assistencial dos Centros de Saúde em 2005. Lisboa: Ministério da Saúde; 2006.
8. Biscaia AR, Martins JN, Carreira MFL, Gonçalves IF, Antunes AR, Ferrinho P: Cuidados de Saúde Primários em Portugal, Reformar para Novos Sucessos. 1 edition. Lisbon: Padrões Culturais Editora; 2005.
9. Campos AC: Reformas da Saúde: o fio condutor Almedina; 2008. 10. Gouveia M, Silva SN, Oliveira P, Miguel LS: Análise dos Custos e Sistema
de Remunerações e Incentivos das Unidades de Saúde Familiar. Associação Portuguesa de Economia da Saúde; 2007.
11. Missão para os Cuidados de Saúde Primários: Reforma para os Cuidados de Saúde Primários - Plano Estratégico 2007-2009. Lisboa: Missão para os Cuidados de Saúde Primários; 2007.
12. Fooks C: Implementing Primary Care Reform in Canada: Barriers and Facilitators McGill-Queen’s University Press; 2004.
13. Ministério da Saúde: Decreto-Lei n.° 9/2006. Diário da República; 2006. 14. Ministério da Saúde: Decreto-Lei n.° 298/2007. Diário da República; 2007. 15. Estatística das USF. [http://www.mcsp.min-saude.pt/Imgs/content/
page_32/candnac_20111017.pdf].
16. D’Amour D, Goulet L, Labadie J-F, Martín-Rodriguez LS, Pineault R: A model and typology of collaboration between professionals in healthcare organizations. BMC Health Serv Res 2008, 8(188):1-14.
17. Agência de Contratualização dos Serviços de Saúde: Contratualização com as Unidades de Saúde Familiares para 2007. Lisbon; 2006.
18. Missão para os Cuidados de Saúde Primários: Proposta de Reconfiguração dos Centros de Saúde - Criação de Agrupamentos de Centros de Saúde. Lisboa: Missão para os Cuidados de Saúde Primários; 2007.
19. Gouveia M, Silva SN, Oliveira P, Miguel LS: Análise dos Custos dos Centros de Saúde e do Regime Remuneratório Experimental. Associação Portuguesa de Economia da Saúde; 2007.
20. Fone D, Hollinghurst S, Temple M, Round A, Lester N, Weightman A, Roberts K, Coyle E, Bevan G, Palmer S: Systematic review of the use and value of computer simulation modelling in population health and health care delivery. J Public Health Med 2003, 25(4):325-335.
21. Jun JB, Jacobson SH, Swisher JR: Application of discrete-event simulation in health care clinics: A survey. J Oper Res Soc 1999, 50:109-123. 22. Jacobson SH, Hall SN, Swisher JR: Discrete-event simulation of health care
systems. In Patient Flow: Reducing Delay in Healthcare Delivery Edited by: Hall RW 2006, 211-252.
23. Pidd M: Tools for Thinking: Modelling in Management Science. 2 edition. Wiley; 2003.
24. Ramwadhdoebe S, Buskens E, Sakkers RJB, Stahl JE: A tutorial on discrete-event simulation for health policy design and decision making: Optimizing pediatric ultrasound screening for hip dysplasia as an illustration. Health Policy 2009, 93:143-150.
25. Günal MM, Pidd M: Discrete event simulation for performance modelling in health care: a review of the literature. Journal of Simulation 2010, 4:42-51.
26. Simul8 Corporation: Simul8 2006 Standard Edition. Simul8 Corporation;, 13.0 2008.
27. Instituto Nacional de Estatística: Anuário Estatístico de Portugal. Instituto Nacional de Estatística; 2006.
28. Instituto Nacional de Estatística: Population estimates. Instituto Nacional de Estatística; 2007.
29. USF Dafundo: Plano de Acção Triénio 2008 - 2010. 2007. 30. USF Delta: Plano de Acção 2008. 2007.
31. USF Marginal: Relatório de Actividades 2007. 2007. 32. USF Rodrigues Migueis: Relatório de Actividades 2007. 2007. 33. USF Tílias: Plano de Acção 2007. 2007.
34. Donabedian A: An Introduction to Quality Assurance in Health Care Oxford University Press; 2002.
35. Hauge JW, Paige KN: Learning Simul8: The Complete Guide. 2 edition. PlainVu; 2004.
36. Ministério da Saúde: Decreto-Lei n.° 88/2005. Diário da República 2005. 37. Ministério da Saúde: Decreto-Lei n.° 28/2008. Diário da República 2008. 38. Wonca Working Party on Rural Practice: Policy on Rural Practice and Rural
Health. Victoria: Monash University School of Rural Health; 2001. 39. Rodríguez C, Pozzebon M: The implementation evaluation of primary
care groups of practice: a focus on organizational identity. BMC Family Practice 2010, 11(15):1-10.
40. Canadian Medical Association: Physician Resource Questionnaire 2003. 2003.
41. Doran T, Roland M: Lessons from major initiatives to improve primary care in the United Kingdom. Health Affair 2010, 29(5):1023-1029. 42. Law AM: Simulation Modelling and Analysis. 3 edition. McGraw Hill; 2000. 43. Harper PR, Pitt MA: On the challenges of healthcare modelling and a
proposed project life cycle for successful implementation. J Oper Res Soc 2004, 55(6):657-661.
Pre-publication history
The pre-publication history for this paper can be accessed here: http://www.biomedcentral.com/1472-6963/11/274/prepub
doi:10.1186/1472-6963-11-274
Cite this article as: Fialho et al.: Using discrete event simulation to compare the performance of family health unit and primary health care centre organizational models in Portugal. BMC Health Services Research 2011 11:274.
Submit your next manuscript to BioMed Central and take full advantage of:
• Convenient online submission
• Thorough peer review
• No space constraints or color figure charges
• Immediate publication on acceptance
• Inclusion in PubMed, CAS, Scopus and Google Scholar
• Research which is freely available for redistribution
Submit your manuscript at www.biomedcentral.com/submit