EUROPEAN ORGANIZATION FOR NUCLEAR RESEARCH (CERN)
CERN-PH-EP/2013-037 2015/11/26
CMS-TOP-12-028
Measurement of the differential cross section for top quark
pair production in pp collisions at
√
s
=
8 TeV
The CMS Collaboration
∗Abstract
The normalized differential cross section for top quark pair (tt) production is mea-sured in pp collisions at a centre-of-mass energy of 8 TeV at the CERN LHC using the CMS detector in data corresponding to an integrated luminosity of 19.7 fb−1. The measurements are performed in the lepton+jets (e/µ+jets) and in the dilepton (e+e−,
µ+µ−, and e±µ∓) decay channels. The tt cross section is measured as a function of
the kinematic properties of the charged leptons, the jets associated to b quarks, the top quarks, and the tt system. The data are compared with several predictions from perturbative QCD up to approximate next-to-next-to-leading-order precision. No sig-nificant deviations are observed relative to the standard model predictions.
Published in the European Physical Journal C as doi:10.1140/epjc/s10052-015-3709-x.
c
2015 CERN for the benefit of the CMS Collaboration. CC-BY-3.0 license ∗See Appendix B for the list of collaboration members
1
1
Introduction
Understanding the production and properties of top quarks is fundamental for testing the qual-ity of the standard model (SM) and for searching for new physical phenomena beyond its scope. The large top quark data samples produced in proton-proton (pp) collisions at the CERN LHC provide access to precision measurements that are crucial for checking the internal consistency of the SM at the LHC energy scale. In particular, measurements of the top quark pair (tt) production cross section as a function of tt kinematic observables are important for compar-ing with the state-of-the-art quantum chromodynamic (QCD) predictions within the SM, and thereby constrain QCD parameters. In addition, the top quark plays a relevant role in theories beyond the SM, and such differential measurements are therefore expected to be sensitive to new phenomena [1].
Differential tt production cross sections have been measured previously at the Fermilab pp Tevatron [2, 3], and at the LHC at a centre-of-mass energy √s = 7 TeV [4–6]. We present here the first measurement of the normalized differential tt production cross section with the CMS detector at √s = 8 TeV. The analysis uses data recorded in 2012 corresponding to an integrated luminosity of 19.7±0.5 fb−1, which is about a factor of four larger than the sample used in the measurement performed by the CMS Collaboration at 7 TeV [5]. The analysis largely follows the procedures of Ref. [5] and benefits from the increase in statistical precision together with improvements in kinematic reconstruction algorithms and extended systematic studies, leading to a significant reduction of the total uncertainties.
The measurements are performed in `+jets channels (` = e or µ), which contain a single iso-lated charged lepton and at least four jets in the final state, and in dilepton channels, with two oppositely charged leptons (e+e−, µ+µ−, e±µ∓) and at least two jets. The tt cross section is
determined as a function of the kinematic properties of the top quarks and of the tt system, as well as of the leptons and jets associated with bottom (b) quarks (b jets) from top quark decays. The kinematic properties of top quarks are obtained through kinematic-fitting and reconstruc-tion algorithms. The normalized differential tt cross secreconstruc-tion is determined by counting the number of tt signal events in each bin of a given observable, correcting for detector effects and acceptance, and dividing by the measured total inclusive tt event rate. The latter is evaluated by integrating over all bins in each observable.
The results for directly measured quantities, such as kinematic properties of leptons and b jets, are presented in a fiducial phase space defined by the kinematic and geometric acceptance of all selected final-state objects. This avoids extrapolating the measured cross section into re-gions that are not experimentally accessible. In addition, the top quark and tt distributions are determined in the full phase space, in order to facilitate the comparison with higher-order per-turbative QCD calculations. The results are compared to several predictions obtained with the leading-order (LO) MADGRAPH[7] generator interfaced toPYTHIA[8] for parton evolution and hadronization, the next-to-leading-order (NLO) generatorsPOWHEG[9–11], interfaced to both
PYTHIA andHERWIG[12], andMC@NLO[13] interfaced to HERWIG, and the latest NLO
calcu-lations with next-to-next-to-leading-logarithm (NNLL) corrections [14, 15], and approximate next-to-next-to-leading-order (NNLO) predictions [16]. The approximate NNLO predictions can be computed with the DIFFTOP[17] program.
This document is structured as follows. A brief description of the CMS detector is provided in Section 2. Details of the event simulation are given in Section 3, and event reconstruction and selection are discussed in Section 4. The estimated systematic uncertainties on the mea-surements of the cross section are described in Section 5. The results of the measurement are
discussed in Section 6, followed by a summary in Section 7.
2
CMS detector
The central feature of the CMS apparatus is a superconducting solenoid of 13 m length and 6 m inner diameter, which provides an axial magnetic field of 3.8 T. Within the field volume are a silicon-pixel and strip tracker, a lead tungstate crystal electromagnetic calorimeter (ECAL), and a brass and scintillator hadron calorimeter (HCAL), each composed of a barrel and two endcap sections. Charged particle trajectories are measured by the inner tracking system, cov-ering a pseudorapidity range of |η| < 2.5. The ECAL and the HCAL surround the tracking
volume, providing high-resolution energy and direction measurements of electrons, photons, and hadronic jets up to |η| < 3. Muons are measured in gas-ionization detectors embedded
in the steel flux return yoke outside the solenoid covering the region|η| <2.4. Extensive
for-ward calorimetry complements the coverage provided by the barrel and endcap detectors up to|η| <5.2. The detector is nearly hermetic, allowing for energy balance measurements in the
plane transverse to the beam directions. A two-tier trigger system selects the pp collisions for use in the analysis. A more detailed description of the CMS detector, together with a definition of the coordinate system and the relevant kinematic variables, can be found in Ref. [18].
3
Event simulation and theoretical calculations
Event generators, interfaced with a detailed detector simulation, are used to model experi-mental effects, such as consequences of event reconstruction and choice of selection criteria, as well as detector resolution. The tt sample is simulated using the LO MADGRAPH event generator (v. 5.1.5.11), which implements the relevant matrix elements with up to three addi-tional partons. The MADSPIN[19] package is used to incorporate spin correlation effects with
matrix elements for up to three additional partons. The value of the top quark mass is fixed to mt = 172.5 GeV and the proton structure is described by the parton distribution functions
(PDF) CTEQ6L1 [20]. The generated events are subsequently processed withPYTHIA(v. 6.426, referred to asPYTHIA6 in the following) for parton showering and hadronization, and the MLM prescription [21] is used for matching of matrix-element jets to parton showers. The CMS de-tector response is simulated using GEANT4 (v. 9.4) [22].
In addition to the MADGRAPH prediction, calculations obtained with the NLO generators MC@NLO (v. 3.41) and POWHEG (v. 1.0 r1380) are compared to the results presented in
Sec-tion 6. While POWHEG and MC@NLO are formally equivalent up to the NLO accuracy, they
differ in the techniques used to avoid double counting of radiative corrections that can arise from interfacing with the parton showering generators. TwoPOWHEGsamples are used: one is processed throughPYTHIA6 and the other throughHERWIG(v. 6.520, referred to asHERWIG6 in the following) for the subsequent parton showering and hadronization. The parton showering
inPYTHIA6 is based on a transverse-momentum-ordered evolution scale, whereas inHERWIG6
it is angular-ordered. The events generated withMC@NLOare interfaced withHERWIG6. The
HERWIG6 AUET2 tune [23] is used to model the underlying event in thePOWHEG+HERWIG6
sample, while the default tune is used in theMC@NLO+HERWIG6 sample. The proton structure
is described by the PDF sets CT10 [24] and CTEQ6M [20] for POWHEGandMC@NLO, respec-tively. In addition, the latest available NLO+NNLL [14, 15] and approximate NNLO QCD predictions [16] are also used to compare with the data. The NNLO MSTW2008 [25] PDF set is used for both the NLO+NNLL and the approximate NNLO calculations.
3
package), POWHEG, or PYTHIA6, depending on the process. The main background contribu-tions originate from the production of W and Z/γ∗ bosons with additional jets (referred to as W+jets and Z+jets, respectively, in the following), single top quark (s-, t-, and tW channels), diboson (WW, WZ, and ZZ), tt production in association with a Z, W, or γ boson (referred to as tt +Z/W/γ in the following), and QCD multijet events. The W+jets, Z+jets, and tt +Z/W/γ samples are simulated with MADGRAPH with up to two additional partons in the final state.
The POWHEGgenerator is used for simulating single top quark production, whilePYTHIA6 is
used to simulate diboson and QCD multijet events. Parton showering and hadronization are also simulated withPYTHIA6 in all the background samples. ThePYTHIA6 Z2* tune [26] is used to characterize the underlying event in both the tt and the background samples.
For comparison with the measured distributions, the event yields in the simulated samples are normalized to an integrated luminosity of 19.7 fb−1, according to their predicted cross sections. These are taken from NNLO (W+jets [27, 28] and Z+jets [27]), NLO+NNLL (single top quark s-, t-, and tW channels [16]), NLO (diboson [29], tt +W [30], and tt +Z [31]), and LO (QCD mul-tijet [8]) calculations. The predicted cross section for the tt +γ sample is obtained by scaling the LO cross section obtained with the WHIZARD event generator [32] by an NLO/LO correction K-factor [33]. Correction factors described in Sections 4 and 5, and subsequently referred to as scale factors, are applied when needed to improve the description of the data by the simula-tion. The tt simulation is normalized to the data to present the expected rates in the figures in Section 4.
4
Event reconstruction and selection
The event selection is similar to that described in Ref. [5] for the measurement of normalized differential tt cross sections at√s= 7 TeV, and is based on the final-state topology of tt events. The top quark decays almost exclusively into a W boson and a b quark, and only the subsequent decays of one or two of the W bosons into a charged lepton (electron or muon) and a neutrino are considered. These signatures imply the presence of isolated leptons with high transverse momentum pT, large pT imbalance caused by the neutrinos that escape detection, and highly
energetic jets. The identification of b jets through b-tagging techniques is used to increase the purity of the selected sample. The event selection in each channel is optimized to maximize the content of tt signal events and background rejection.
4.1 Lepton, jet, and missing transverse energy reconstruction
Events are reconstructed using a particle-flow technique [34, 35], which combines signals from all subdetectors to enhance the reconstruction and identification of individual particles ob-served in pp collisions. Charged hadrons from pileup events, i.e. those originating from ad-ditional pp interactions within the same bunch crossing, are subtracted on an event-by-event basis. Subsequently, the remaining neutral-hadron component from pileup is accounted for through jet energy corrections [36].
Electron candidates are reconstructed from a combination of the track momentum at the main interaction vertex, the corresponding energy deposition in the ECAL, and the energy sum of all bremsstrahlung photons attached to the track [37]. The candidates are required to have pT > 33 GeV within the pseudorapidity interval|η| < 2.1 for the`+jets channels, while
elec-tron candidates in the dilepton channels are required to have pT > 20 GeV and |η| < 2.4.
As an additional quality criterion, a relative isolation Irel(0.3) < 0.10 in the `+jets channels
and Irel(0.3) < 0.15 in the dilepton channels is required, where Irel(x) is defined as the sum
√
(∆η)2+ (∆φ)2 < x around the electron (excluding the electron itself) in η-φ space, divided
by the pTof the electron.
Muon candidates are reconstructed using the track information from the silicon tracker and the muon system. They are required to have pT >33 GeV and|η| < 2.1 in the`+jets channels,
while in the dilepton channels the corresponding selection requires pT >20 GeV and|η| <2.4.
Isolated muon candidates are selected if they fulfill Irel(0.4) < 0.12 and Irel(0.3) < 0.15 in the `+jets and dilepton channels, respectively. The same definition of relative isolation described above is also used for muon candidates.
Jets are reconstructed by clustering the particle-flow candidates [38] using the anti-kT
cluster-ing algorithm with a distance parameter of R = 0.5 [39]. Electrons and muons passing less stringent selections on lepton kinematic quantities and isolation, relative to the ones specified above, are identified but excluded from clustering. A jet is selected if it has pT > 30 GeV
and |η| < 2.4 for both the `+jets and dilepton channels. Jets originating from b quarks are
identified through a “combined secondary vertex” algorithm [40], which provides a b-tagging discriminant by combining secondary vertices and track-based lifetime information. The cho-sen working point in the`+jets channels has an efficiency for tagging a b jet of≈60%, while the probability to misidentify light-flavour jets as b jets (mistag rate) is only≈1.5%. In the dilepton channels, the working point is selected to provide b-tagging efficiency and mistag rate of≈80– 85% and≈10%, respectively [40]. These requirements are chosen to reduce the background contribution in the corresponding channels while keeping a large fraction of the tt signal. The missing transverse energy E/ is defined as the magnitude of the imbalance in the transverseT
momentum p/ in the event, which is the negative of the vectorial sum of the momenta in the~T
transverse plane of all the particles reconstructed with the particle-flow algorithm [41]. To mitigate the effect of contributions from pileup on the resolution in E/ , we use a multivariateT
correction where the input is separated into components that originate from the primary and other collision vertices [42]. This correction improves the E/ resolution byT ≈5%.
4.2 Event selection
Events in the`+jets channels that are triggered by the presence of a single electron (muon) with pT > 27 GeV (pT > 24 GeV, |η| < 2.1), are selected if they contain exactly one reconstructed
lepton fulfilling the requirements described in Section 4.1. Events are rejected if there are addi-tional electron candidates with pT >20 GeV,|η| <2.5, and Irel(0.3) <0.15, or additional muon
candidates with pT > 10 GeV, |η| < 2.5, and Irel(0.4) < 0.2. Additionally, an event must
con-tain at least four reconstructed jets satisfying the criteria described in Section 4.1. To suppress background contribution mainly from W+jets events, at least two of these jets are required to be tagged as b jets, and at least two must not be tagged as b jets, as they are used to reconstruct W → qq0 decays. In the dilepton channels, events are triggered using combinations of two leptons with pTthresholds of 8 and 17 GeV, and are selected if they contain at least two isolated
leptons of opposite electric charge and at least two jets. At least one of the jets is required to be b-tagged. In events with more than two leptons, we choose the lepton pair with opposite charge and largest value in the sum of their scalar pT. Events with an invariant mass of the
lepton pair smaller than 20 GeV are removed to suppress events from decays of heavy-flavour resonances and low-mass Drell–Yan processes. Backgrounds from Z+jets processes in the e+e− and µ+µ−channels are also suppressed by requiring the dilepton invariant mass to be outside
a Z boson mass window of 91±15 GeV, and to have E/T >40 GeV.
After these selection steps, several basic distributions in`+jets and dilepton events are shown in Figs. 1 and 2, respectively. The hatched regions correspond to the shape uncertainties for the
4.2 Event selection 5
signal and background (cf. Section 5), and are dominated by the former. The data are reason-ably well described by the simulation, as shown in the lower part of each plot, where the ratio of data to simulation is presented to better indicate the level of agreement between data and the default tt signal (MADGRAPH+PYTHIA6) and background samples used in the analysis. For
both channels, however, data tend to have lower pT values than predicted by the simulation.
It has been verified that the results presented in Section 6 are not affected by these remaining differences between data and simulation. A better data-to-simulation agreement in the lepton and jet pTdistributions is obtained by scaling the top quark pTspectrum in simulation to match
the data. However, the impact on the measurement of the cross sections is negligible.
Events 10 2 10 3 10 4 10 5 10 6 10 7 10 8 10 Data Signal t t Other t t Single t W+Jets +Jets * γ Z / γ +Z/W/ t t Diboson Uncertainty + Jets µ e/ = 8 TeV s at -1 CMS, 19.7 fb b jets N 2 3 4 5 MC N Data N 0.6 0.8 1 1.2 1.4 Events 10 2 10 3 10 4 10 5 10 6 10 7 10 8 10 Data Signal t t Other t t Single t W+Jets +Jets * γ Z / γ +Z/W/ t t Diboson Uncertainty + Jets µ e/ = 8 TeV s at -1 CMS, 19.7 fb jets N 4 5 6 7 8 9 MC N Data N 0.6 0.8 1 1.2 1.4 Leptons / 10 GeV 5 10 15 20 25 30 35 3 10 × Data Signal t t Other t t Single t W+Jets +Jets * γ Z / γ +Z/W/ t t Diboson Uncertainty + Jets µ e/ = 8 TeV s at -1 CMS, 19.7 fb [GeV] T l p 40 60 80 100 120 140 MC N Data N 0.6 0.8 1 1.2 1.4 Jets / 10 GeV 10 2 10 3 10 4 10 5 10 6 10 7 10 8 10 Data Signal t t Other t t Single t W+Jets +Jets * γ Z / γ +Z/W/ t t Diboson Uncertainty + Jets µ e/ = 8 TeV s at -1 CMS, 19.7 fb GeV jet T p 50 100 150 200 250 300 350 400 MC N Data N 0.6 0.8 1 1.2 1.4
Figure 1: Kinematic distributions after event selection and before the kinematic reconstruction of the tt system in the`+jets channels: the multiplicity in the reconstructed number of b-tagged jets (top left), the multiplicity in the reconstructed number of jets (top right), the pT of the
selected isolated leptons (bottom left), and the pT of all reconstructed jets (bottom right). The
QCD multijet background is negligible and not shown. The hatched regions correspond to the shape uncertainties for the signal and backgrounds (cf. Section 5). The lower part of each plot shows the ratio of data to the predictions.
Events 1 10 2 10 3 10 4 10 5 10 6 10 7 10 8 10 = 8 TeV s at -1 CMS, 19.7 fb Dilepton Data Signal t t Other t t Single t W+Jets µ µ ee/ → * γ Z / τ τ → * γ Z / γ +Z/W/ t t Diboson Uncertainty b jets N 1 2 3 4 5 6 MC N Data N 0.6 0.8 1 1.2 1.4 Events 10 2 10 3 10 4 10 5 10 6 10 7 10 8 10 = 8 TeV s at -1 CMS, 19.7 fb Dilepton Data Signal t t Other t t Single t W+Jets µ µ ee/ → * γ Z / τ τ → * γ Z / γ +Z/W/ t t Diboson Uncertainty jets N 2 3 4 5 6 7 8 MC N Data N 0.6 0.8 1 1.2 1.4 Leptons / 10 GeV 0 5 10 15 20 25 30 35 40 3 10 × at s = 8 TeV -1 CMS, 19.7 fb Dilepton Data Signal t t Other t t Single t W+Jets µ µ ee/ → * γ Z / τ τ → * γ Z / γ +Z/W/ t t Diboson Uncertainty GeV l T p 20 40 60 80 100 120 140 160 MC N Data N 0.6 0.8 1 1.2 1.4 Jets / 10 GeV 2 10 3 10 4 10 5 10 6 10 = 8 TeV s at -1 CMS, 19.7 fb Dilepton Data Signal t t Other t t Single t W+Jets µ µ ee/ → * γ Z / τ τ → * γ Z / γ +Z/W/ t t Diboson Uncertainty GeV jet T p 50 100 150 200 250 300 350 400 MC N Data N 0.6 0.8 1 1.2 1.4
Figure 2: Kinematic distributions after event selection and before the kinematic reconstruction of the tt system for the dilepton channels: the multiplicity in the reconstructed number of b-tagged jets (top left), the multiplicity in the number of reconstructed jets (top right), the pT of
the selected isolated leptons (bottom left), and the pT of the reconstructed jets (bottom right).
The QCD multijet background is negligible and not shown. The Z/γ∗+jets background is de-termined from data [5, 43]. The hatched regions correspond to the shape uncertainties for the signal and backgrounds (cf. Section 5). The lower part of each plot shows the ratio of data to the predictions.
4.3 Kinematic reconstruction of thett system 7
4.3 Kinematic reconstruction of the tt system
The kinematic properties of the top quark pair are determined from the four-momenta of all final-state objects through kinematic reconstruction algorithms. These algorithms are im-proved versions of those described in Ref. [5].
In the`+jets channels, a constrained kinematic fitting algorithm is applied [5, 44] to the four-momenta of the selected lepton and up to five leading jets, and the p/ representing the trans-~T
verse momentum of the neutrino, which are changed according to their resolutions. The fit is constrained to reconstruct two W bosons, each with a mass of 80.4 GeV. In addition, the recon-structed top quark and antiquark masses are required to be equal. To reduce the number of permutations in the association of jets to quarks, only b-tagged jets are considered as b quarks, and only untagged jets are considered as light quarks. In events with several combinatorial solutions, only the one with the minimum χ2 in the fit is accepted. The main improvement relative to the method described in Ref. [5] is the increase in the number of correct assignments of b jets to b quarks. This is achieved by applying the kinematic fit twice, sequentially, in each event. In the first fit, the top quark mass is fixed to a value of 172.5 GeV. The jet combina-tion that provides the minimum χ2 in the fit is then used as input to the second kinematic fit, in which the top quark mass is not fixed, and the solution to this fit is retained. A further improvement in the method is to require the χ2-probability of the second kinematic fit to be >2%. This criterion is chosen to optimize the fraction of correctly reconstructed signal events, without increasing significantly the statistical uncertainty in the data. The efficiency of this requirement is about 87% for signal events with the correct jet assignment. As a result, the number of correctly reconstructed events is increased by almost a factor of two relative to the method used in Ref. [5], and effects from migration of events across bins, which are relevant for the measurements of the cross section, are reduced. It has been checked that any possible bias in the results that could be introduced by fixing the top quark mass to a specific value in the first kinematic fit is within the assigned systematic uncertainty on the dependence of the measurement on the top quark mass (cf. Section 5.2).
The dilepton channels use an algebraic kinematic reconstruction method [5, 45]. The only un-knowns are the three-momenta of the two neutrinos, which are reconstructed imposing the fol-lowing kinematic constraints: pT conservation in the event; the W bosons, and top quark and
antiquark masses. In contrast to the method of Ref. [5], the top quark mass is fixed to a value of 172.5 GeV. Each suitable pair of b jet candidates in the event, and both possible assignments of these two jets to the two selected leptons, are considered in the kinematic reconstruction. Com-binations with two b-tagged jets are preferred to using single b-tagged jets. In the new method, events are reconstructed 100 times, each time randomly smearing the measured energies and directions of the reconstructed lepton and b jet candidates by their respective detector resolu-tions. This smearing recovers events that yielded no solution of the equations for the neutrino momenta, because of measurement fluctuations. The equations for the neutrino momenta can have up to four solutions. For a given smearing, the solution is identified by the one yielding the smallest invariant mass of the tt system. For each solution, a weight is calculated based on the expected true lepton-b-jet invariant mass spectrum. The weights are summed over the 100 reconstruction attempts, and the kinematic quantities associated to the top quark and an-tiquark are calculated as a weighted average. Finally, the two jet and lepton-jet assignments that yield the maximum sum of weights are chosen for analysis. It has been checked that any bias introduced through the use of the lepton-b-jet and tt invariant masses is negligible. This method yields on average a reconstruction efficiency of≈94%, which is 6% higher than the one described in Ref. [5], and reduces systematic migration effects.
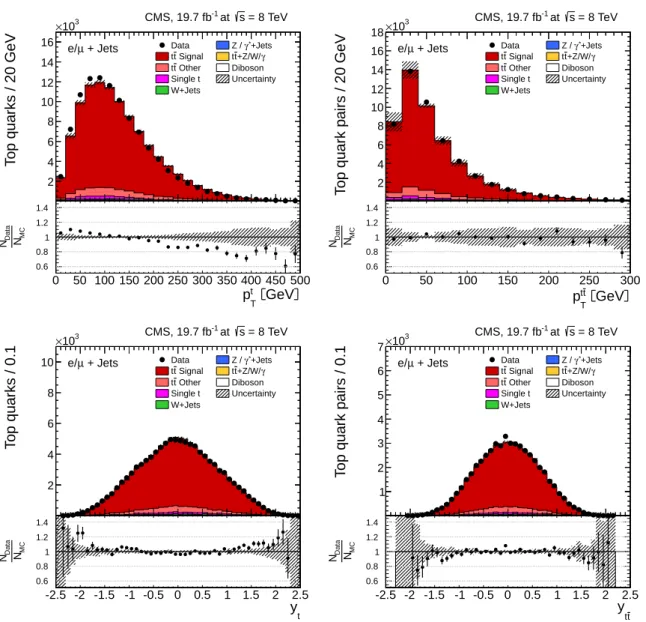
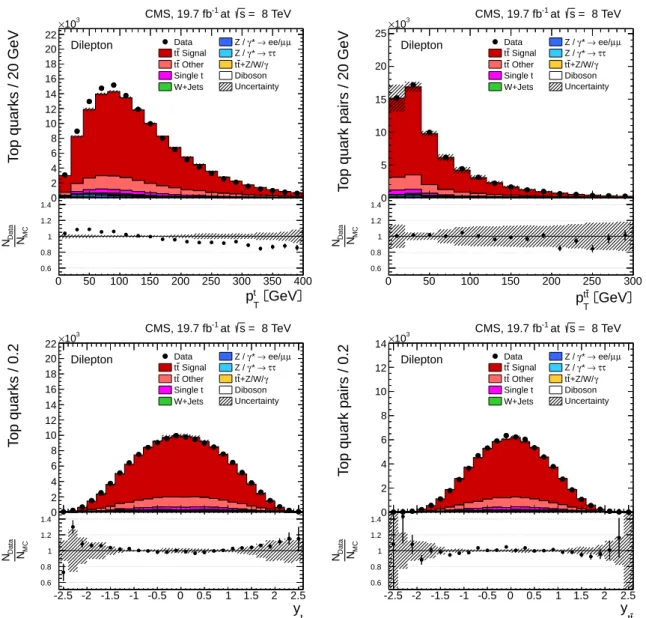
Distributions of the top quark or antiquark and tt kinematic observables (the transverse mo-menta ptT, pttT, and the rapidities yt and ytt) are presented in Figs. 3 and 4 for the `+jets and
dilepton channels, respectively. The hatched regions correspond to the shape uncertainties for the signal and background (cf. Section 5), and are dominated by the former. The lower panel in each plot also shows the ratio of data relative to the simulated signal and background samples. In general, the data are reasonably well described by the simulation within the uncertainties. For both channels, the measured pT distributions, in particular ptT, are somewhat softer than
the simulated distributions: the data lie above the simulation for ptT<60(65)GeV in the`+jets (dilepton) channels, while they lie below for ptT > 200 GeV. This pattern was also observed at 7 TeV [5]. To ensure that the results presented in Section 6 are not affected by such small remaining differences between data and simulation, the analysis has been repeated in different kinematic regions, with different selection requirements, and after scaling the top quark pT
spectrum in simulation to match the data. However, the impact on the measurement of the cross sections is negligible.
Following the event selection described in Section 4.2 and the kinematic reconstruction of the tt system, the main contributions to the background in the `+jets channels arise from tt de-cays into channel other than `+jets (including tt decays into τ leptons originating from the primary interaction) and single top quark events. The contribution from W+jets and QCD multijet events are well suppressed after the b-tagging requirement, while other tt events are somewhat reduced after the χ2-probability requirement. A total of 24 927 events are found in
the e+jets channel and 26 843 events in the µ+jets channel. The contribution from tt signal to the final event sample is 89.0%. The remaining fraction of events contains 7.3% tt decays other than the`+jets channels, 2.4% single top quark events, 0.9% W+jets and tt +Z/W/γ events, and negligible fractions of Z+jets, diboson, and QCD multijet events. All background contributions are determined from simulation.
In the dilepton channels, 10 678 events are found in the e+e−channel, 14 403 in the µ+µ−
chan-nel, and 39 640 in the e±µ∓channel. Only tt events containing at least two leptons (electrons or
muons) from W decays in the final state are considered as signal, and constitute 79.0% of the fi-nal event sample. All other tt candidate events, specifically those originating from decays via τ leptons, are considered as background and amount to 13.3% of the final event sample. The frac-tion of Z+jets events is found to be 2.4%. This background, which is dominant to the e+e−and
µ+µ−channels, is estimated from data using the number of events observed within the Z-peak
region (which is removed from the candidate sample), and a correction needed for non-Z+jets backgrounds in this same control region is obtained from data in the e±µ∓ channel [5, 43].
Other sources of background, including single top quark production (3.4%), tt +Z/W/γ pro-duction (1%), the contribution arising from misidentified or genuine leptons within jets (0.6%), or diboson events (0.3%), are estimated from simulation.
5
Systematic uncertainties
The measurement is affected by systematic uncertainties that originate from detector effects and from theoretical assumptions. Each source of systematic uncertainty is assessed individ-ually by changing the corresponding efficiency, resolution, or scale by its uncertainty, using a prescription similar to the one followed in Ref. [5]. For each change made, the measured normalized differential cross section is recalculated, and the difference of the changed result relative to its nominal value in each bin is taken as the systematic uncertainty. The overall un-certainty on the measurement is obtained by adding all the contributions in quadrature, and is
9 T o p q u a rk s / 2 0 G e V 2 4 6 8 10 12 14 16 3 10 × Data Signal t t Other t t Single t W+Jets +Jets * γ Z / γ +Z/W/ t t Diboson Uncertainty + Jets µ e/ = 8 TeV s at -1 CMS, 19.7 fb GeV t T p 0 50 100 150 200 250 300 350 400 450 500 MC N Data N 0.6 0.8 1 1.2 1.4 T o p q u a rk p a ir s / 2 0 G e V 2 4 6 8 10 12 14 16 18 3 10 × Data Signal t t Other t t Single t W+Jets +Jets * γ Z / γ +Z/W/ t t Diboson Uncertainty + Jets µ e/ = 8 TeV s at -1 CMS, 19.7 fb GeV t t T p 0 50 100 150 200 250 300 MC N Data N 0.6 0.8 1 1.2 1.4 T o p q u a rk s / 0 .1 2 4 6 8 10 3 10 × Data Signal t t Other t t Single t W+Jets +Jets * γ Z / γ +Z/W/ t t Diboson Uncertainty + Jets µ e/ = 8 TeV s at -1 CMS, 19.7 fb t y -2.5 -2 -1.5 -1 -0.5 0 0.5 1 1.5 2 2.5 MC N Data N 0.6 0.8 1 1.2 1.4 T o p q u a rk p a ir s / 0 .1 1 2 3 4 5 6 7 3 10 × Data Signal t t Other t t Single t W+Jets +Jets * γ Z / γ +Z/W/ t t Diboson Uncertainty + Jets µ e/ = 8 TeV s at -1 CMS, 19.7 fb t t y -2.5 -2 -1.5 -1 -0.5 0 0.5 1 1.5 2 2.5 MC N Data N 0.6 0.8 1 1.2 1.4
Figure 3: Distribution of top quark or antiquark (left) and tt (right) quantities as obtained from the kinematic reconstruction in the `+jets channels. The top row shows the pT, and the
bot-tom row shows the rapidities. The QCD multijet background is negligible and not shown. The hatched regions correspond to the shape uncertainties for the signal and backgrounds (cf. Section 5). The lower part of each plot shows the ratio of data to the predictions.
T o p q u a rk s / 2 0 G e V 0 2 4 6 8 10 12 14 16 18 20 22 3 10 × at s = 8 TeV -1 CMS, 19.7 fb Dilepton Data Signal t t Other t t Single t W+Jets µ µ ee/ → * γ Z / τ τ → * γ Z / γ +Z/W/ t t Diboson Uncertainty GeV t T p 0 50 100 150 200 250 300 350 400 MC N Data N 0.6 0.8 1 1.2 1.4 T o p q u a rk p a ir s / 2 0 G e V 0 5 10 15 20 25 3 10 × at s = 8 TeV -1 CMS, 19.7 fb Dilepton Data Signal t t Other t t Single t W+Jets µ µ ee/ → * γ Z / τ τ → * γ Z / γ +Z/W/ t t Diboson Uncertainty GeV t t T p 0 50 100 150 200 250 300 MC N Data N 0.6 0.8 1 1.2 1.4 T o p q u a rk s / 0 .2 0 2 4 6 8 10 12 14 16 18 20 22 3 10 × at s = 8 TeV -1 CMS, 19.7 fb Dilepton Data Signal t t Other t t Single t W+Jets µ µ ee/ → * γ Z / τ τ → * γ Z / γ +Z/W/ t t Diboson Uncertainty t y -2.5 -2 -1.5 -1 -0.5 0 0.5 1 1.5 2 2.5 MC N Data N 0.6 0.8 1 1.2 1.4 T o p q u a rk p a ir s / 0 .2 0 2 4 6 8 10 12 14 3 10 × at s = 8 TeV -1 CMS, 19.7 fb Dilepton Data Signal t t Other t t Single t W+Jets µ µ ee/ → * γ Z / τ τ → * γ Z / γ +Z/W/ t t Diboson Uncertainty t t y -2.5 -2 -1.5 -1 -0.5 0 0.5 1 1.5 2 2.5 MC N Data N 0.6 0.8 1 1.2 1.4
Figure 4: Distribution of top quark or antiquark (left) and tt (right) quantities as obtained from the kinematic reconstruction in the dilepton channels. The top row shows the pT, and the
bottom row shows the rapidities. The QCD multijet background is negligible and not shown. The Z/γ∗+jets background is determined from data [5, 43]. The hatched regions correspond to the shape uncertainties for the signal and backgrounds (cf. Section 5). The lower part of each plot shows the ratio of data to the predictions.
5.1 Experimental uncertainties 11
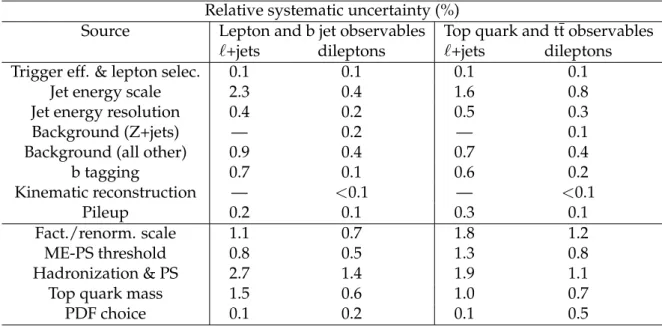
of the order of 3–10%, depending on the observable and the bin. A detailed description of this is given in Sections 5.1 and 5.2. The typical representative values of the systematic uncertainties in the normalized differential cross sections are summarized in Table 1.
5.1 Experimental uncertainties
The efficiencies of the single-electron and single-muon triggers in the`+jets channels are de-termined using the “tag-and-probe” method of Ref. [46] using Z boson event samples. Scale factors close to unity within a few percent are extracted to account for the observed dependence on the η and pTof the lepton. The lepton identification and isolation efficiencies for the`+jets
channels obtained with the tag-and-probe method agree well between data and simulation, so that the applied corrections are very close to unity. The systematic uncertainties are determined by shape-dependent changes in trigger and selection efficiencies by their uncertainties. Lepton trigger efficiencies in the dilepton channels are measured using triggers that are only weakly correlated to the dilepton triggers used in the analysis. A dependence on η of a few percent is observed, and scale factors are extracted. The lepton identification and isolation uncertainties in the dilepton channels are also determined using the tag-and-probe method, and are again found to be described very well by the simulation for both electrons and muons. The overall difference between data and simulation in bins of η and pTis estimated to be<2% for electrons,
and scale factors for muons are found to be close to unity within 1.0%.
The uncertainty due to the limited knowledge of the jet energy scale is determined by changes implemented in jet energy in bins of pT and η [38]. The uncertainty due to the limited
accu-racy of the jet energy resolution (JER) is determined by changing the simulated JER by±1σ in different η regions [38].
The uncertainty in b-tagging efficiency is determined by taking the maximum change in the shape of pT and η b jet distributions obtained by changing the scale factors. This is achieved
by dividing the b jet distributions in pT and η into two bins at the median of the respective
distributions. These correspond to pT = 65 GeV, and |η| = 0.7 and 0.75 for the `+jets and
dilepton channels, respectively. The b-tagging scale factors for b jets in the first bin are scaled up by half of the uncertainties quoted in Ref. [40], while those in the second bin are scaled down, and vice versa, so that a maximum variation is assumed and the difference between the scale factors in the two bins reflects the full uncertainty. The changes are made separately in the pTand η distributions, and independently for heavy-flavour (b and c) and light (s, u, d, and
gluon) jets, assuming that they are all uncorrelated.
The uncertainty in background normalization is determined by changing the background yields. In the`+jets channels, the background normalization for the diboson, QCD multijet, W+jets, and Z+jets samples is conservatively varied by±50% [5], since these backgrounds, being very small, are determined from simulation rather than from data. The normalization of the tt +Z/W/γ samples is changed by ±30%. For the single top quark sample, the uncertainty is covered by changing the normalization by±30%, and the kinematic scales of the event process (renormalization and factorization scales) as described in Section 5.2. In the e+e− and µ+µ−
channels, the dominant background from Z+jets determined from data [5, 43] is changed in normalization by±30%. In addition, changes in the background contributions from single top quark, diboson, QCD multijet, tt +Z/W/γ, and W+jets events of±30% are used in dilepton channels [5].
The kinematic reconstruction of top quarks is well described by the simulation, and the result-ing uncertainties are small. In the case of the`+jets analysis, the uncertainty of the kinematic fit is included in the changes in jet energy scales and resolutions, and in the uncertainty on the
dependence on the top quark mass (cf. Section 5.2). In the dilepton analysis, the bin-to-bin un-certainty is determined from the small remaining difference in efficiency between simulation and data.
The pileup model estimates the mean number of additional pp interactions to be about 20 events per bunch crossing for the analyzed data. This estimate is based on the total inelastic proton-proton cross section, which is determined to be 69.4 mb following the measurement described in Ref. [47]. The systematic uncertainty is determined by changing this cross section within its uncertainty of±5%.
5.2 Uncertainties in modelling
The impact of theoretical assumptions on the measurement is determined, as indicated pre-viously, by repeating the analysis and replacing the standard MADGRAPH tt simulation by dedicated simulation samples with altered parameters.
The uncertainty in modelling of the hard-production process is assessed through changes in the renormalization and factorization scales in the MADGRAPH sample by factors of two and 0.5 relative to their common nominal value, which is set to the Q of the hard process. In MAD -GRAPH, Q is defined by Q2=m2t +Σp2T, where the sum is over all additional final state partons in the matrix element. The impact of the choice of the scale that separates the description of jet production through matrix elements (ME) or parton shower (PS) in MADGRAPHis studied by
changing its reference value of 20 GeV to 40 GeV and to 10 GeV. In the`+jets channels, changes in the renormalization and factorization scales are also applied to single top quark events to determine an uncertainty on the shape of this background contribution. The dependence of the measurement on the top quark mass is also estimated from dedicated MADGRAPH simula-tion samples in which the top quark mass is changed by±1 GeV relative to the value used in the default simulation. The uncertainty from hadronization and parton showering is assessed by comparing the results obtained from samples simulated with POWHEG and MC@NLO in-terfaced with PYTHIA6 andHERWIG6, respectively. The uncertainty from the choice of PDF is determined by reweighting the sample of simulated tt signal events according to the 52 CT10 PDF error sets [24], at a 90% confidence level. The maximum variation is taken as uncertainty. As mentioned in Sections 4.2 and 4.3, the effect of scaling the top quark pT spectrum in
sim-ulation to match the data has negligible impact on the measured cross sections, therefore no systematic uncertainty is taken into account for this effect.
6
Normalized differential cross sections
The normalized tt cross section in each bin i of each observable X is determined as a function of the kinematic properties of the leptons, the lepton pair, the b jets, the b jet system, the top quarks, and the tt system through the relation [5]:
1 σ dσi dX = 1 ∑ixi xi ∆X i (1)
where xi represents the number of signal events measured in data in bin i after background
subtraction and corrected for detector efficiencies, acceptances, and migrations, and∆iXis the bin width. The differential cross section is normalized by the sum of xi over all bins, as
indi-cated in Eq. (1). The integrated luminosity is omitted, as it cancels in the ratio. Because of the normalization, sources of systematic uncertainty that are correlated across all bins of the mea-surement, e.g. the uncertainty in the integrated luminosity, also cancel. The contribution to the
13
Table 1: Breakdown of typical systematic uncertainties for the normalized differential cross sec-tions. The uncertainty in the jet-parton matching threshold is indicated as “ME-PS threshold”; “PS” refers to “parton shower”. The medians of the distribution of uncertainties over all bins of the measurement are quoted. For the`+jets channels, the background from Z+jets is negligible and included in the “Background (all other)” category.
Relative systematic uncertainty (%)
Source Lepton and b jet observables Top quark and tt observables `+jets dileptons `+jets dileptons Trigger eff. & lepton selec. 0.1 0.1 0.1 0.1
Jet energy scale 2.3 0.4 1.6 0.8
Jet energy resolution 0.4 0.2 0.5 0.3
Background (Z+jets) — 0.2 — 0.1
Background (all other) 0.9 0.4 0.7 0.4
b tagging 0.7 0.1 0.6 0.2 Kinematic reconstruction — <0.1 — <0.1 Pileup 0.2 0.1 0.3 0.1 Fact./renorm. scale 1.1 0.7 1.8 1.2 ME-PS threshold 0.8 0.5 1.3 0.8 Hadronization & PS 2.7 1.4 1.9 1.1
Top quark mass 1.5 0.6 1.0 0.7
PDF choice 0.1 0.2 0.1 0.5
background from other tt decays is taken into account, after subtracting all other background components, by correcting the number of signal events in data using the expected signal frac-tion. The expected signal fraction is defined as the ratio of the number of selected tt signal events to the total number of selected tt events (i.e. signal and all other tt events) in simula-tion. This procedure avoids the dependence on the total inclusive tt cross section used in the normalization of the simulated signal sample.
Effects from trigger and detector efficiencies and resolutions leading to the migration of events across bin boundaries, and therefore to statistical correlations among neighbouring bins, are corrected by using a regularized unfolding method [5, 48, 49]. For each measured distribution, a response matrix is defined that accounts for migrations and efficiencies using the simulated MADGRAPH+PYTHIA6 tt signal sample. The generalized inverse of the response matrix is used
to obtain the unfolded distribution from the measured distribution by applying a χ2
mini-mization technique. A smoothing prescription (regularization) is applied to prevent large un-physical fluctuations that can be introduced when directly inverting the response matrix. The strength of the regularization is determined and optimized individually for each distribution using the averaged global correlation method [50]. To keep the bin-to-bin migrations small, the widths of bins in the measurement are chosen according to their purity (ratio of the number of events generated and reconstructed in a particular bin to the total number of events recon-structed in that bin; this quantity is sensitive to migrations into the bin) and stability (ratio of the number of events generated and reconstructed in a particular bin to the number of events generated in that bin; this is sensitive to migrations out of the bin). The purity and stability of the bins in this analysis are typically 60% or larger, mainly due to the improvements in the kinematic reconstruction methods discussed in Section 4.3.
The performance of the unfolding procedure is tested for possible biases from the choice of the input model (the MADGRAPH+PYTHIA6 tt signal simulation). It is verified that, either by
sig-nal, the unfolding procedure based on the nominal response matrices still recovers these altered shapes within statistical uncertainties. Moreover, tt samples simulated withPOWHEG+PYTHIA6
and MC@NLO+HERWIG6 are used to obtain the response matrices applied in the unfolding
when determining the systematic uncertainties of the model (cf. Section 5.2). Therefore, pos-sible effects from the unfolding procedure are already taken into account in the systematic uncertainties. The unfolded results are found to be consistent with those obtained using other regularization techniques [49].
The measurement of the normalized differential cross sections proceeds as follows. For each kinematic distribution, the event yields in the separate channels are added together, the back-ground is subtracted, and the unfolding is performed. It is verified that the measurements in separate channels yield results consistent within their uncertainties. The systematic uncertain-ties in each bin are determined from the changes in the combined cross sections. This requires the full analysis to be repeated for every systematic change, and the difference relative to the nominal combined value is taken as the systematic uncertainty for each bin of each observ-able. This method therefore takes into account the correlation among systematic uncertainties in different channels and bins.
The normalized differential cross sections of leptons and b jets are unfolded to the particle level and determined in a fiducial phase space defined by the kinematic and geometric re-gion in which the final-state leptons and jets are produced within the detector acceptance (cf. Section 6.1). This minimizes model uncertainties from the extrapolation of the measure-ment outside of the experimeasure-mentally well-described regions of phase space. In addition, the top quark and tt-system quantities are unfolded to the parton level and presented in the full phase space (cf. Section 6.2) to provide easier comparisons with recent QCD calculations. The measurements are compared to predictions from MADGRAPH+PYTHIA6, POWHEG+PYTHIA6,
POWHEG+HERWIG6, andMC@NLO+HERWIG6. The top quark and tt results are also compared
to the latest calculations at NLO+NNLL [14, 15] and approximate NNLO [16] precision, when available.
In addition to the measurements discussed in Ref. [5], results for the pTand invariant mass of
the b jet pair, the pT of the top quarks or antiquarks in the tt rest frame, the pT of the highest
(leading) and second-highest (trailing) pT of the top quark or antiquark, and the difference in
the azimuthal angle between the top quark and antiquark are also presented.
All values of normalized differential cross sections, including bin boundaries, are provided in tables in Appendix A.
6.1 Lepton and b jet differential cross sections
The normalized differential tt cross section as a function of the lepton and b jet kinematic prop-erties is measured at the particle level, where the objects are defined as follows. Leptons from W boson decays are defined after final-state radiation. A jet is defined at the particle level, follow-ing a procedure similar to that described in Section 4.1 for reconstructed jets, by applyfollow-ing the anti-kT clustering algorithm with a distance parameter of 0.5 to all stable particles (excluding
the decay products from W boson decays into eν, µν, and final states with leptonic τ decays). A jet is defined as a b jet if it contains any of the decay products of a B hadron. Only the two b jets of highest pToriginating from different B hadrons are considered as arising from the top
quark decays.
The measurements are presented in a fiducial phase space defined by geometric and kinematic requirements on these particle-level objects as follows. The charged leptons from the W boson
6.1 Lepton and b jet differential cross sections 15
decays must have|η| < 2.1 and pT > 33 GeV in the`+jets channels, and|η| < 2.4 and pT >
20 GeV in the dilepton channels. Exactly one and two leptons are required, respectively, in the`+jets and the dilepton channels. At least four jets with |η| < 2.4 and pT > 30 GeV, two
of which are b jets, are required in the `+jets channels. In the dilepton channels, both b jets from the top quark decays must satisfy|η| < 2.4 and pT > 30 GeV. The fiducial particle-level
corrections are determined using simulated tt events that fulfill these requirements; all other tt events are classified as background and are removed.
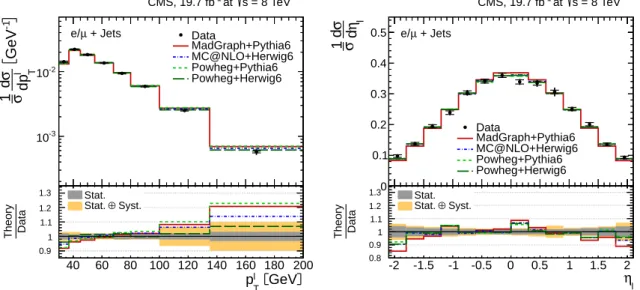
Figure 5 presents the normalized differential cross section in the `+jets channels as a func-tion of the lepton transverse momentum p`T and pseudorapidity η`. The distributions of the
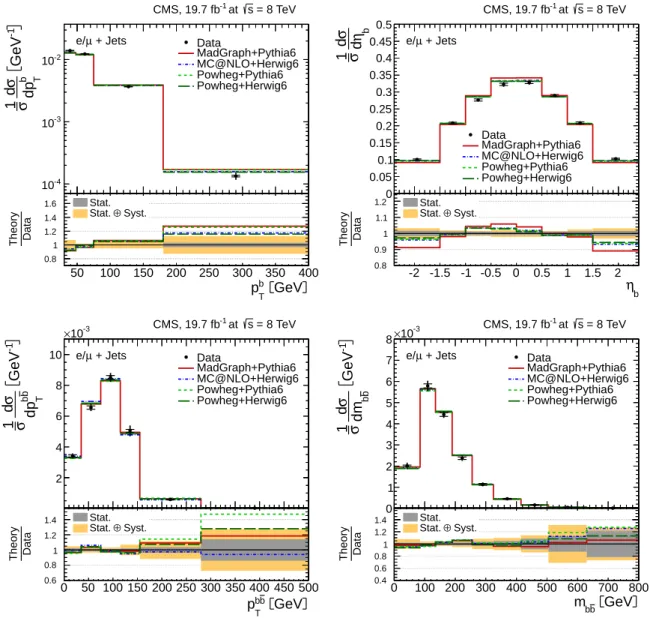
transverse momentum of the b jets pbT and their pseudorapidity ηb are given in Fig. 6, to-gether with the transverse momentum pbbT and invariant mass mbb of the b jet pair. Also shown are predictions from MADGRAPH+PYTHIA6, POWHEG+PYTHIA6, POWHEG+HERWIG6,
andMC@NLO+HERWIG6. The lower panel in each plot shows the ratio of each of these
predic-tions to data, in order to quantify their level of agreement relative to data.
GeV l T p 40 60 80 100 120 140 160 180 200 -1 GeV l T dp σ d σ 1 -3 10 -2 10 Data MadGraph+Pythia6 MC@NLO+Herwig6 Powheg+Pythia6 Powheg+Herwig6 = 8 TeV s at -1 CMS, 19.7 fb + Jets µ e/ GeV l T p 40 60 80 100 120 140 160 180 200 Data Theory 0.9 1 1.1 1.2 1.3 Syst. ⊕ Stat. Stat. l η -2 -1.5 -1 -0.5 0 0.5 1 1.5 2 l η d σ d σ 1 0 0.1 0.2 0.3 0.4 0.5 Data MadGraph+Pythia6 MC@NLO+Herwig6 Powheg+Pythia6 Powheg+Herwig6 = 8 TeV s at -1 CMS, 19.7 fb + Jets µ e/ l η -2 -1.5 -1 -0.5 0 0.5 1 1.5 2 Data Theory 0.8 0.9 1 1.1 1.2 1.3 Syst. ⊕ Stat. Stat.
Figure 5: Normalized differential tt production cross section in the`+jets channels as a function of the p`T (left) and η` (right) of the charged lepton. The superscript ‘`’ refers to both`+ and
`−. The data points are placed at the midpoint of the bins. The inner (outer) error bars indicate the statistical (combined statistical and systematic) uncertainties. The measurements are com-pared to predictions from MADGRAPH+PYTHIA6, POWHEG+PYTHIA6, POWHEG+HERWIG6,
and MC@NLO+HERWIG6. The lower part of each plot shows the ratio of the predictions to
data.
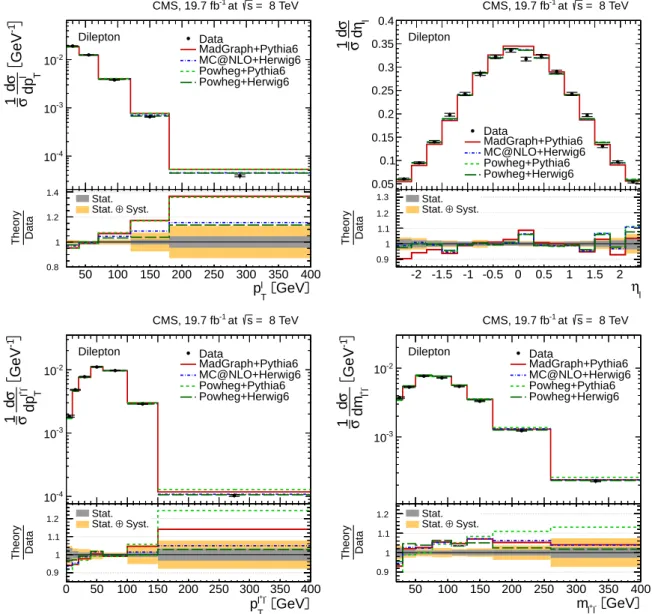
Figure 7 presents the normalized differential cross sections for the dilepton channels: the trans-verse momentum p`Tand the pseudorapidity η`of the leptons, and the transverse momentum
pT`+`− and the invariant mass m`+`− of the lepton pair. The distributions in the transverse
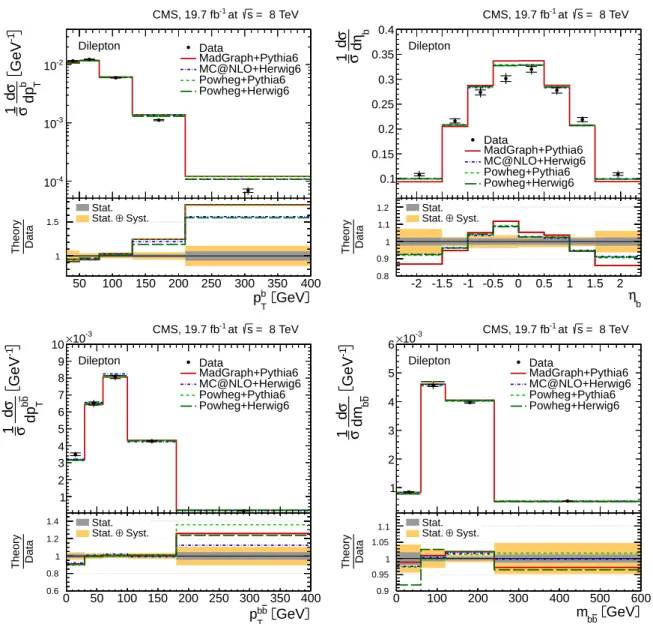
mo-mentum of the b jets pbT and their pseudorapidity ηb are shown in Fig. 8, together with the
transverse momentum pbbT and invariant mass mbb of the b jet pair. Predictions from MAD
-GRAPH+PYTHIA6, POWHEG+PYTHIA6, POWHEG+HERWIG6, and MC@NLO+HERWIG6 are also
presented for comparison.
In general, none of the examined predictions provides an accurate description of data for all measured lepton and b jet distributions. A steeper pT spectrum is observed in data for the
GeV b T p 50 100 150 200 250 300 350 400 -1 GeV b T dp σ d 1 σ -4 10 -3 10 -2 10 Data MadGraph+Pythia6 MC@NLO+Herwig6 Powheg+Pythia6 Powheg+Herwig6 = 8 TeV s at -1 CMS, 19.7 fb + Jets µ e/ GeV b T p 50 100 150 200 250 300 350 400 Data Theory 0.8 1 1.2 1.4 1.6 Syst. ⊕ Stat. Stat. b η -2 -1.5 -1 -0.5 0 0.5 1 1.5 2 b η d σ d σ 1 0 0.05 0.1 0.15 0.2 0.25 0.3 0.35 0.4 0.45 0.5 Data MadGraph+Pythia6 MC@NLO+Herwig6 Powheg+Pythia6 Powheg+Herwig6 = 8 TeV s at -1 CMS, 19.7 fb + Jets µ e/ b η -2 -1.5 -1 -0.5 0 0.5 1 1.5 2 Data Theory 0.8 0.9 1 1.1 1.2 Syst. ⊕ Stat. Stat. GeV b b T p 0 50 100 150 200 250 300 350 400 450 500 -1 GeV b b T dp σ d σ 1 2 4 6 8 10 -3 10 × Data MadGraph+Pythia6 MC@NLO+Herwig6 Powheg+Pythia6 Powheg+Herwig6 = 8 TeV s at -1 CMS, 19.7 fb + Jets µ e/ GeV b b T p 0 50 100 150 200 250 300 350 400 450 500 Data Theory 0.6 0.8 1 1.2 1.4 Syst. ⊕ Stat. Stat. GeV b b m 0 100 200 300 400 500 600 700 800 -1 GeV b b dm σ d σ 1 0 1 2 3 4 5 6 7 8 -3 10 × Data MadGraph+Pythia6 MC@NLO+Herwig6 Powheg+Pythia6 Powheg+Herwig6 = 8 TeV s at -1 CMS, 19.7 fb + Jets µ e/ GeV b b m 0 100 200 300 400 500 600 700 800 Data Theory 0.4 0.6 0.8 1 1.2 1.4 Syst. ⊕ Stat. Stat.
Figure 6: Normalized differential tt production cross section in the`+jets channels as a function of the pb
T(top left) and ηb(top right) of the b jets, and the pbbT (bottom left) and mbb(bottom right)
of the b jet pair. The superscript ‘b’ refers to both b and b jets. The data points are placed at the midpoint of the bins. The inner (outer) error bars indicate the statistical (combined statistical and systematic) uncertainties. The measurements are compared to predictions from MAD
-GRAPH+PYTHIA6, POWHEG+PYTHIA6, POWHEG+HERWIG6, and MC@NLO+HERWIG6. The
6.2 Top quark andtt differential cross sections 17
is best described by POWHEG+HERWIG6. The lepton pT in data is above the predictions for
pT` < 40 GeV, while it is below for pT` > 100 GeV. A similar behaviour is observed for p`T+`−, pb
T, and pbbT . The m`+`− distribution in data is below all predictions for m`+`− > 30 GeV. Worse
agreement is found for POWHEG+PYTHIA6. The η distributions in data are described by the predictions within the experimental uncertainties. The ηb distributions are slightly less
cen-tral in data than in the predictions, and are worse described by MADGRAPH+PYTHIA6. The remaining distributions are described by the predictions within experimental uncertainties.
6.2 Top quark and tt differential cross sections
The normalized differential tt cross section as a function of the kinematic properties of the top quarks and the tt system is defined with respect to the top quarks or antiquarks before the decay (parton level) and after QCD radiation, and extrapolated to the full phase space using the MADGRAPH+PYTHIA6 prediction for the`+jets and dilepton channels.
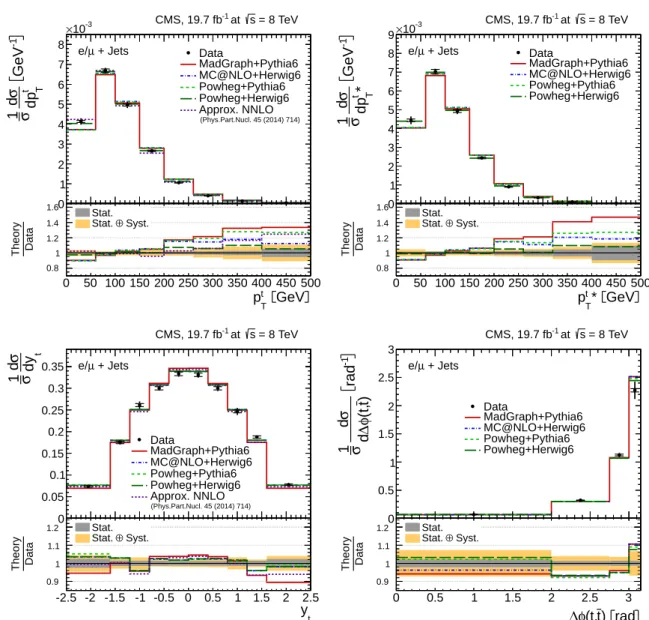
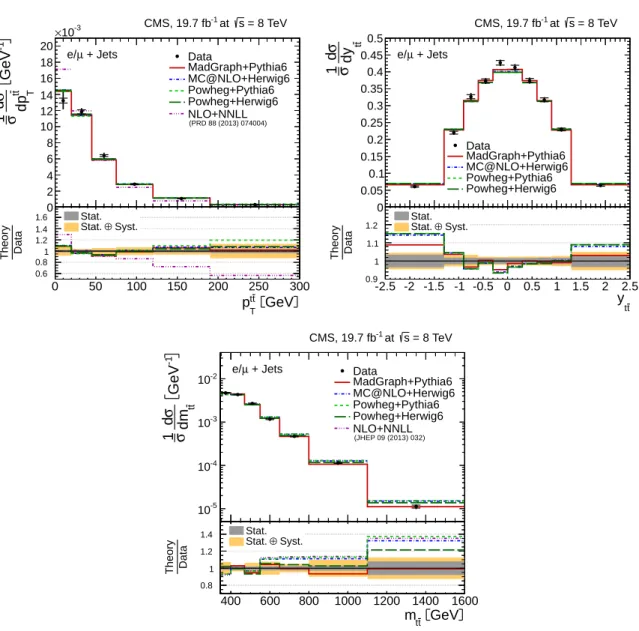
In Figs. 9 to 11, the following distributions are presented for the`+jets channels: the transverse momentum ptT and the rapidity yt of the top quarks or antiquarks, the transverse
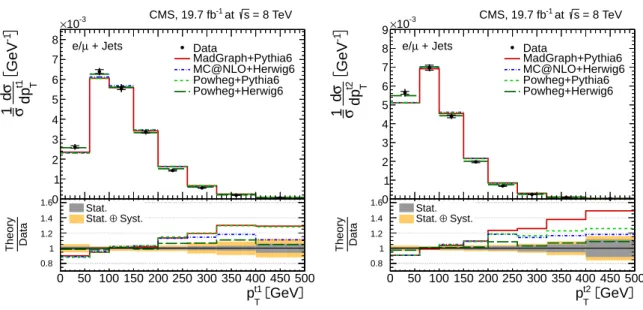
momen-tum ptT∗ of the top quarks or antiquarks in the tt rest frame, the difference in the azimuthal angle between the top quark and antiquark∆φ(t,¯t), the transverse momentum of the leading (pt1T) and trailing (pt2T) top quark or antiquark, and the transverse momentum pttT, the rapidity ytt, and the invariant mass mtt of the tt system. The data are compared to predictions from
MADGRAPH+PYTHIA6, POWHEG+PYTHIA6, POWHEG+HERWIG6, and MC@NLO+HERWIG6. In
addition, the approximate NNLO calculation [16] is also shown for the top quark pTand
rapid-ity results, while the mttand the pttT distributions are compared to the NLO+NNLL predictions from Refs. [14] and [15], respectively. Figures 12–14 show the corresponding distributions in the dilepton channels. The lower panel in each plot also shows the ratio of each prediction relative to data.
In general, thePOWHEG+HERWIG6 prediction provides a good description of data for all mea-sured distributions. The shape of the top quark pTspectrum is softer in data than in the
predic-tions from MADGRAPH+PYTHIA6, POWHEG+PYTHIA6, andMC@NLO+HERWIG6 in both
chan-nels. The data lie above the predictions for pt
T < 60 (65) GeV in the`+jets (dilepton) channels,
while they lie below for pt
T >200 GeV. This effect was also observed at 7 TeV [5]. The
disagree-ment between data and predictions in the tail of the distributions is also observed in a mea-surement by the ATLAS Collaboration [6]. In contrast, the prediction fromPOWHEG+HERWIG6 and the approximate NNLO calculation provide a better description of the data, as they pre-dict a slightly softer top quark pTdistribution than the three other simulations. The difference
between the POWHEG+PYTHIA6 and POWHEG+HERWIG6 distributions is attributed to differ-ent treatmdiffer-ent of the hardest initial state radiation in PYTHIA6 and HERWIG6. The same pat-tern is observed for ptT∗, indicating that the softer spectrum in data is not caused by the boost of the tt system. It is also present in the pt1
T, and particularly, in the pt2T distributions. For
all these distributions, the POWHEG+HERWIG6 prediction provides a better description of the
data. The difference in the shape of the top quark pT spectrum between data and simulation
is observed consistently in the analyses using different event selection requirements or differ-ent pileup conditions. The yt distribution is found to be slightly less central in data than in
the predictions, particularly in the case of MADGRAPH+PYTHIA6 and the approximate NNLO calculation, which are more central than the other predictions. On the contrary, yttis more cen-tral in data, and it is slightly better described by MADGRAPH+PYTHIA6. The mtt distribution
in data tends to be lower than the predictions for large mttvalues, and is better described by MADGRAPH+PYTHIA6 andPOWHEG+HERWIG6. The pttT spectrum is well described by all the
GeV l T p 50 100 150 200 250 300 350 400 -1 GeV l T dp σ d σ 1 -4 10 -3 10 -2 10 = 8 TeV s at -1 CMS, 19.7 fb Dilepton Data MadGraph+Pythia6 MC@NLO+Herwig6 Powheg+Pythia6 Powheg+Herwig6 GeV l T p 50 100 150 200 250 300 350 400 Data Theory 0.8 1 1.2 1.4 Syst. ⊕ Stat. Stat. l η -2 -1.5 -1 -0.5 0 0.5 1 1.5 2 l η d σ d σ 1 0.05 0.1 0.15 0.2 0.25 0.3 0.35 0.4 = 8 TeV s at -1 CMS, 19.7 fb Dilepton Data MadGraph+Pythia6 MC@NLO+Herwig6 Powheg+Pythia6 Powheg+Herwig6 l η -2 -1.5 -1 -0.5 0 0.5 1 1.5 2 Data Theory 0.9 1 1.1 1.2 1.3 Syst. ⊕ Stat. Stat. GeV -l + l T p 0 50 100 150 200 250 300 350 400 -1 GeV -+l l T dp σ d σ 1 -4 10 -3 10 -2 10 = 8 TeV s at -1 CMS, 19.7 fb Dilepton Data MadGraph+Pythia6 MC@NLO+Herwig6 Powheg+Pythia6 Powheg+Herwig6 GeV -l + l T p 0 50 100 150 200 250 300 350 400 Data Theory 0.9 1 1.1 1.2 Syst. ⊕ Stat. Stat. GeV -l + l m 50 100 150 200 250 300 350 400 -1 GeV -+l l dm σ d σ 1 -3 10 -2 10 = 8 TeV s at -1 CMS, 19.7 fb Dilepton Data MadGraph+Pythia6 MC@NLO+Herwig6 Powheg+Pythia6 Powheg+Herwig6 GeV -l + l m 50 100 150 200 250 300 350 400 Data Theory 0.9 1 1.1 1.2 Syst. ⊕ Stat. Stat.
Figure 7: Normalized differential tt production cross section in the dilepton channels as a func-tion of the p`T (top left) and η` (top right) of the charged leptons, and the p`
+`−
T (bottom left)
and m`+`− (bottom right) of the lepton pair. The superscript ‘`’ refers to both `+and`−. The
data points are placed at the midpoint of the bins. The inner (outer) error bars indicate the statistical (combined statistical and systematic) uncertainties. The measurements are com-pared to predictions from MADGRAPH+PYTHIA6, POWHEG+PYTHIA6, POWHEG+HERWIG6,
and MC@NLO+HERWIG6. The lower part of each plot shows the ratio of the predictions to
6.2 Top quark andtt differential cross sections 19 GeV b T p 50 100 150 200 250 300 350 400 -1 GeV b T dp σ d 1 σ -4 10 -3 10 -2 10 = 8 TeV s at -1 CMS, 19.7 fb Dilepton Data MadGraph+Pythia6 MC@NLO+Herwig6 Powheg+Pythia6 Powheg+Herwig6 GeV b T p 50 100 150 200 250 300 350 400 Data Theory 1 1.5 Stat. ⊕ Syst. Stat. b η -2 -1.5 -1 -0.5 0 0.5 1 1.5 2 b η d σ d σ 1 0.1 0.15 0.2 0.25 0.3 0.35 0.4 = 8 TeV s at -1 CMS, 19.7 fb Dilepton Data MadGraph+Pythia6 MC@NLO+Herwig6 Powheg+Pythia6 Powheg+Herwig6 b η -2 -1.5 -1 -0.5 0 0.5 1 1.5 2 Data Theory 0.8 0.9 1 1.1 1.2 Syst. ⊕ Stat. Stat. GeV b b T p 0 50 100 150 200 250 300 350 400 -1 GeV b b T dp σ d σ 1 1 2 3 4 5 6 7 8 9 10 -3 10 × at s = 8 TeV -1 CMS, 19.7 fb Dilepton Data MadGraph+Pythia6 MC@NLO+Herwig6 Powheg+Pythia6 Powheg+Herwig6 GeV b b T p 0 50 100 150 200 250 300 350 400 Data Theory 0.6 0.8 1 1.2 1.4 Syst. ⊕ Stat. Stat. GeV b b m 0 100 200 300 400 500 600 -1 GeV b b dm σ d σ 1 1 2 3 4 5 6 -3 10 × at s = 8 TeV -1 CMS, 19.7 fb Dilepton Data MadGraph+Pythia6 MC@NLO+Herwig6 Powheg+Pythia6 Powheg+Herwig6 GeV b b m 0 100 200 300 400 500 600 Data Theory 0.9 0.95 1 1.05 1.1 Syst. ⊕ Stat. Stat.
Figure 8: Normalized differential tt production cross section in the dilepton channels as a function of the pbT (top left) and ηb (top right) of the b jets, and the pbbT (bottom left) and
mbb (bottom right) of the b jet pair. The superscript ‘b’ refers to both b and b jets. The data points are placed at the midpoint of the bins. The inner (outer) error bars indicate the statistical (combined statistical and systematic) uncertainties. The measurements are com-pared to predictions from MADGRAPH+PYTHIA6, POWHEG+PYTHIA6, POWHEG+HERWIG6,
and MC@NLO+HERWIG6. The lower part of each plot shows the ratio of the predictions to
considered predictions, except for the NLO+NNLL calculation, which fails to describe the data for all pttT values.
The results from the`+jets and dilepton channels are compared to each other in Figs. 15 to 17. This is only feasible for the top quark and tt quantities, since they are measured in the same phase space (i.e. the full parton level phase space) for both channels. The results are presented relative to the MADGRAPH+PYTHIA6 prediction to highlight the level of agreement between data and the default tt simulation. To facilitate the comparison of measurements that are per-formed using different size and number of bins, a horizontal bin-centre correction is applied to all data points from both channels. In each bin, the measured data points are presented at the horizontal position in the bin where the predicted bin-averaged cross section equals the cross section of the unbinned MADGRAPH+PYTHIA6 calculation (cf. [51]), which is common for both channels. The data are also compared to the predictions from POWHEG+PYTHIA6,
POWHEG+HERWIG6, MC@NLO+HERWIG6 relative to MADGRAPH+PYTHIA6. The results are
consistent between the channels for all quantities, in particular, for all measurements related to the top quark pTdistribution. The softer spectrum in data relative to MADGRAPH+PYTHIA6 is
clearly visible.
In addition, a comparison between results obtained at√s =7 [5] and 8 TeV is also performed for both the`+jets and dilepton channels, and presented in Figs. 18 and 19 for ptT, yt, pttT, ytt,
and mtt. Since the fiducial phase space definition for the normalized differential cross sections is also different for each value of√s, the comparison is again only possible for top quark and tt quantities. The measurements are presented relative to the corresponding default MAD
-GRAPH+PYTHIA6 predictions at 7 and 8 TeV. A horizontal bin-centre correction with respect to
the MADGRAPH+PYTHIA6 predictions is applied to all data points from both channels and√s
values. The results are consistent between the channels for all quantities, both at 7 and 8 TeV. The uncertainties in almost all bins of the distributions are reduced for the 8 TeV results relative to 7 TeV, mainly due to the improvements discussed in Section 4.3. The softer ptTin data relative to MADGRAPH+PYTHIA6 is also visible at 7 TeV.
7
Summary
First measurements are presented of normalized differential tt production cross sections in pp collisions at√s = 8 TeV. The measurements are performed with the CMS detector in the `+jets (` = e or µ) and dilepton (e+e−, µ+µ−, and e±µ∓) tt decay channels. The normalized
tt cross section is measured as a function of the transverse momentum, rapidity, and invariant mass of the final-state leptons and b jets in the fiducial phase space, and the top quarks and tt system in the full phase space. The measurements in the different decay channels are in agree-ment with each other. In general, the data are in agreeagree-ment with standard model predictions up to approximate NNLO precision. Among the examined predictions, POWHEG+HERWIG6
provides the best overall description of the data. However, the pT spectrum in data for
leptons, jets, and top quarks is softer than expected, particularly for MADGRAPH+PYTHIA6,
POWHEG+PYTHIA6, andMC@NLO+HERWIG6. The calculation at approximate NNLO precision
also provides a good description of the top quark pT spectrum. The mtt distribution in data
tends to be lower than the predictions for large mtt values. The pttT spectrum is well described by all the considered predictions, except for the NLO+NNLL calculation, which fails to de-scribe the data for all pttT values. The results show the same behaviour as the corresponding CMS measurements at√s=7 TeV.
21 GeV t T p 0 50 100 150 200 250 300 350 400 450 500 -1 GeV t T dp σ d σ 1 0 1 2 3 4 5 6 7 8 -3 10 × Data MadGraph+Pythia6 MC@NLO+Herwig6 Powheg+Pythia6 Powheg+Herwig6 Approx. NNLO = 8 TeV s at -1 CMS, 19.7 fb + Jets µ e/ (Phys.Part.Nucl. 45 (2014) 714) GeV t T p 0 50 100 150 200 250 300 350 400 450 500 Data Theory 0.8 1 1.2 1.4 1.6 Syst. ⊕ Stat. Stat. GeV * t T p 0 50 100 150 200 250 300 350 400 450 500 -1 GeV *t T dp σ d σ 1 0 1 2 3 4 5 6 7 8 9 -3 10 × Data MadGraph+Pythia6 MC@NLO+Herwig6 Powheg+Pythia6 Powheg+Herwig6 = 8 TeV s at -1 CMS, 19.7 fb + Jets µ e/ GeV * t T p 0 50 100 150 200 250 300 350 400 450 500 Data Theory 0.8 1 1.2 1.4 1.6 Syst. ⊕ Stat. Stat. t y -2.5 -2 -1.5 -1 -0.5 0 0.5 1 1.5 2 2.5 t dy σ d σ 1 0 0.05 0.1 0.15 0.2 0.25 0.3 0.35 Data MadGraph+Pythia6 MC@NLO+Herwig6 Powheg+Pythia6 Powheg+Herwig6 Approx. NNLO = 8 TeV s at -1 CMS, 19.7 fb + Jets µ e/ (Phys.Part.Nucl. 45 (2014) 714) t y -2.5 -2 -1.5 -1 -0.5 0 0.5 1 1.5 2 2.5 Data Theory 0.9 1 1.1 1.2 Syst. ⊕ Stat. Stat. rad ) t (t, φ ∆ 0 0.5 1 1.5 2 2.5 3 -1 rad )t (t, φ∆ d σ d σ 1 0 0.5 1 1.5 2 2.5 3 Data MadGraph+Pythia6 MC@NLO+Herwig6 Powheg+Pythia6 Powheg+Herwig6 = 8 TeV s at -1 CMS, 19.7 fb + Jets µ e/ rad ) t (t, φ ∆ 0 0.5 1 1.5 2 2.5 3 Data Theory 0.9 1 1.1 1.2 Syst. ⊕ Stat. Stat.
Figure 9: Normalized differential tt production cross section in the`+jets channels as a function of the ptT (top left), the tt rest frame ptT∗ (top right), and the rapidity yt (bottom left) of the
top quarks or antiquarks, and the difference in the azimuthal angle between the top quark and the antiquark ∆φ(t,¯t) (bottom right). The data points are placed at the midpoint of the bins. The inner (outer) error bars indicate the statistical (combined statistical and systematic) uncertainties. The measurements are compared to predictions from MADGRAPH+PYTHIA6,
POWHEG+PYTHIA6,POWHEG+HERWIG6,MC@NLO+HERWIG6, and to approximate NNLO [16]
calculations, when available. The lower part of each plot shows the ratio of the predictions to data.
GeV t1 T p 0 50 100 150 200 250 300 350 400 450 500 -1 GeV t1 T dp σ d σ 1 0 1 2 3 4 5 6 7 8 -3 10 × Data MadGraph+Pythia6 MC@NLO+Herwig6 Powheg+Pythia6 Powheg+Herwig6 = 8 TeV s at -1 CMS, 19.7 fb + Jets µ e/ GeV t1 T p 0 50 100 150 200 250 300 350 400 450 500 Data Theory 0.8 1 1.2 1.4 1.6 Syst. ⊕ Stat. Stat. GeV t2 T p 0 50 100 150 200 250 300 350 400 450 500 -1 GeV t2 T dp σ d σ 1 0 1 2 3 4 5 6 7 8 9 -3 10 × Data MadGraph+Pythia6 MC@NLO+Herwig6 Powheg+Pythia6 Powheg+Herwig6 = 8 TeV s at -1 CMS, 19.7 fb + Jets µ e/ GeV t2 T p 0 50 100 150 200 250 300 350 400 450 500 Data Theory 0.8 1 1.2 1.4 1.6 Syst. ⊕ Stat. Stat.
Figure 10: Normalized differential tt production cross section in the `+jets channels as a function of the pT of the leading (left) and trailing (right) top quarks or antiquarks. The
data points are placed at the midpoint of the bins. The inner (outer) error bars indicate the statistical (combined statistical and systematic) uncertainties. The measurements are com-pared to predictions from MADGRAPH+PYTHIA6, POWHEG+PYTHIA6, POWHEG+HERWIG6,
and MC@NLO+HERWIG6. The lower part of each plot shows the ratio of the predictions to
data.
Acknowledgments
We congratulate our colleagues in the CERN accelerator departments for the excellent perfor-mance of the LHC and thank the technical and administrative staffs at CERN and at other CMS institutes for their contributions to the success of the CMS effort. In addition, we grate-fully acknowledge the computing centres and personnel of the Worldwide LHC Computing Grid for delivering so effectively the computing infrastructure essential to our analyses. Fi-nally, we acknowledge the enduring support for the construction and operation of the LHC and the CMS detector provided by the following funding agencies: the Austrian Federal Min-istry of Science, Research and Economy and the Austrian Science Fund; the Belgian Fonds de la Recherche Scientifique, and Fonds voor Wetenschappelijk Onderzoek; the Brazilian Fund-ing Agencies (CNPq, CAPES, FAPERJ, and FAPESP); the Bulgarian Ministry of Education and Science; CERN; the Chinese Academy of Sciences, Ministry of Science and Technology, and Na-tional Natural Science Foundation of China; the Colombian Funding Agency (COLCIENCIAS); the Croatian Ministry of Science, Education and Sport, and the Croatian Science Foundation; the Research Promotion Foundation, Cyprus; the Ministry of Education and Research, Esto-nian Research Council via IUT23-4 and IUT23-6 and European Regional Development Fund, Estonia; the Academy of Finland, Finnish Ministry of Education and Culture, and Helsinki Institute of Physics; the Institut National de Physique Nucl´eaire et de Physique des Partic-ules / CNRS, and Commissariat `a l’ ´Energie Atomique et aux ´Energies Alternatives / CEA, France; the Bundesministerium f ¨ur Bildung und Forschung, Deutsche Forschungsgemeinschaft, and Helmholtz-Gemeinschaft Deutscher Forschungszentren, Germany; the General Secretariat for Research and Technology, Greece; the National Scientific Research Foundation, and Na-tional Innovation Office, Hungary; the Department of Atomic Energy and the Department of Science and Technology, India; the Institute for Studies in Theoretical Physics and Mathe-matics, Iran; the Science Foundation, Ireland; the Istituto Nazionale di Fisica Nucleare, Italy;
23 GeV t t T p 0 50 100 150 200 250 300 -1 GeV tt T dp σ d σ 1 0 2 4 6 8 10 12 14 16 18 20 -3 10 × Data MadGraph+Pythia6 MC@NLO+Herwig6 Powheg+Pythia6 Powheg+Herwig6 NLO+NNLL = 8 TeV s at -1 CMS, 19.7 fb + Jets µ e/ (PRD 88 (2013) 074004) GeV t t T p 0 50 100 150 200 250 300 Data Theory 0.6 0.8 1 1.2 1.4 1.6 Syst. ⊕ Stat. Stat. t t y -2.5 -2 -1.5 -1 -0.5 0 0.5 1 1.5 2 2.5 tt dy σ d 1 σ 0 0.05 0.1 0.15 0.2 0.25 0.3 0.35 0.4 0.45 0.5 Data MadGraph+Pythia6 MC@NLO+Herwig6 Powheg+Pythia6 Powheg+Herwig6 = 8 TeV s at -1 CMS, 19.7 fb + Jets µ e/ t t y -2.5 -2 -1.5 -1 -0.5 0 0.5 1 1.5 2 2.5 Data Theory 0.9 1 1.1
1.2 Stat. Stat.⊕ Syst.
GeV t t m 400 600 800 1000 1200 1400 1600 -1 GeV tt dm σ d σ 1 -5 10 -4 10 -3 10 -2 10 DataMadGraph+Pythia6 MC@NLO+Herwig6 Powheg+Pythia6 Powheg+Herwig6 NLO+NNLL = 8 TeV s at -1 CMS, 19.7 fb + Jets µ e/ (JHEP 09 (2013) 032) GeV t t m 400 600 800 1000 1200 1400 1600 Data Theory 0.8 1 1.2 1.4 Syst. ⊕ Stat. Stat.
Figure 11: Normalized differential tt production cross section in the`+jets channels as a func-tion of the pttT (top left), ytt (top right), and mtt (bottom) of the tt system. The data points are placed at the midpoint of the bins. The inner (outer) error bars indicate the statistical (combined statistical and systematic) uncertainties. The measurements are compared to predictions from
MADGRAPH+PYTHIA6, POWHEG+PYTHIA6, POWHEG+HERWIG6, MC@NLO+HERWIG6, and to
NLO+NNLL [14, 15] calculations, when available. The lower part of each plot shows the ratio of the predictions to data.