Towards actual brazilian trafic load models for short
span highway bridges
Rumo a modelos de carga reais do tráfego brasileiro
para pontes rodoviárias de pequenos vãos
a POLI - Department of Structures, Universidade Federal do Rio de Janeiro, [email protected], Av. Athos da Silveira Ramos, 149, CT - Bloco D, 2º andar, Cidade Universitária,
Rio de Janeiro, Brasil;
b COPPE - POLI, Universidade Federal do Rio de Janeiro, [email protected], PO Box 68506 - CEP: 21941-972, Rio de Janeiro, Brasil;
c Controllato Ltd. and COPPE - Universidade Federal do Rio de Janeiro, [email protected], Rua Fonseca Teles 129, CEP: 20940-200, Rio de Janeiro, Brasil; d COPPE, Civil Engineering Program, Universidade Federal do Rio de Janeiro, [email protected], PO Box 68506 - CEP: 21941-972, Rio de Janeiro, Brasil.
Received: 14 Nov 2014 • Accepted: 22 Jan 2015 • Available Online: 02 Apr 2015
Abstract
Resumo
New live load models for highway bridge design in Brazil are under development by assembling real trafic database, trafic simulations, analytical-numerical modeling of the dynamic interaction between vehicle and structure and statistical extrapolations. This paper presents and discusses the results obtained in the irst stages of this work which includes the comparison between the static effects due to the actual trafic of heavy vehicles and those generated by the live load model given in the current national code NBR 7188. It is demonstrated that this live load model is not ap
-propriate to represent the actual trafic effects and may be, in some cases, non-conservative. The present work deals with short span bridges for two lanes single carriageway under free low trafic scenarios. The representative static effects in these bridges due to the actual trafic of heavy vehicles are obtained by extrapolating its probability density functions to a certain return period. To this purpose, a trafic database was constructed by gathering data from several weighing stations in Brazilian highways which was then applied to perform trafic simulations through a specially developed computational tool.
Keywords: highway bridges, live load models, heavy trafic database, trafic simulation.
Novos modelos de cargas móveis para o projeto de pontes rodoviárias no Brasil estão em desenvolvimento com a montagem de um banco de dados de tráfego real, simulações de tráfego, modelagem analítico-numérica da interação dinâmica veículo-estrutura e extrapolações. Este artigo apresenta e discute os resultados obtidos nas primeiras etapas deste trabalho, incluindo a comparação entre os efeitos estáticos devido ao tráfego dos veículos comerciais reais e aqueles gerados pelo modelo de cargas da NBR 7188. Demonstra-se que este modelo de cargas não é adequado para representar as solicitações reais e pode estar, em alguns casos, contra a segurança. São consideradas pontes de pequenos vãos com pista simples e duas faixas de rolamento em cenários de tráfego livre. Os esforços estáticos representativos nessas pontes devido ao tráfego real dos veículos comerciais são obtidos extrapolando as suas funções densidade de probabilidade a um determi
-nado período de retorno. Para tal, uma base de dados de trânsito foi construída através da coleta de dados em alguns postos de pesagem de rodovias federais brasileiras, os quais foram aplicados para executar simulações de tráfego através de uma ferramenta computacional especialmente desenvolvida para esta inalidade.
Palavras-chave: pontes rodoviárias, modelos de cargas móveis, base de dados de tráfego pesado, simulação de tráfego.
C. E. ROSSIGALI a
M. S. PFEIL b
R. C. BATTISTA c
L. V. SAGRILO d
1. Introduction
Highway bridges in Brazil are still designed according to the de
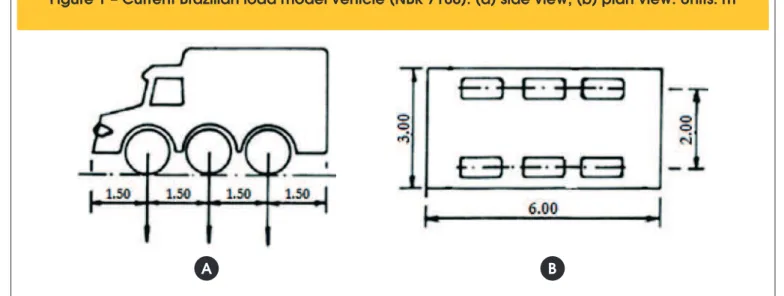
-sign code NBR 7188 [1], dated 1982, in which the live load model is composed of the 3-axles vehicle shown in Figure 1 plus a dis
-tributed load, multiplied by a dynamic ampliication factor, function only of the span length. The coniguration of this design loading fol
-lows the pattern of an older version of the NBR 7188, the NB-6 [2], dated 1960, which was based at that time on the current German design code DIN 1072 [3]. The load values have been increased over time, for example from 360 kN (NB-6) to the current heavier vehicle load equal to 450 kN. In spite of these load magnitude up -dates, the present live load model is not appropriate to represent
the actual trafic effects on Brazilian bridges, as shown later herein.
New live load models for bridge design in Brazil are being
devel-oped by the authors so as to reproduce extreme values of bridge effects due to actual trafic (including dynamic effects) with ap
-proximately the same reliability index among the typical structural systems and through the span length range. The following steps are being performed to reach this goal [4,5,6,7]:
n 1) Selection of typical bridge structural systems and corre
-sponding critical sections where internal forces are to be con -sidered in the analysis;
n 2) Real trafic measurements and statistics;
n 3) Trafic simulation and static analysis of bridge models se
-lected in step 1;
n 4) Statistics of the selected internal forces (bending moments
and shear forces in critical sections) and extrapolation to obtain the representative values of the static effects;
n 5) Calculation of the target values of the selected internal
forces by multiplying the representative static effect by the cor
-responding dynamic ampliication factor, the latter obtained through dynamic analysis of each structural system under the load coniguration which yields the largest static effect;
n 6) Search, by optimization techniques, of new live load models
to reproduce the target values;
n 7) Calibration of safety load factors through reliability analysis.
This paper describes steps 1 to 4 and presents the comparison between static effects caused by the actual trafic, on typical bridge systems, and those generated by the current Brazilian load model. To this point, single carriageway and two lanes bridges are con
-sidered, composed of two types of two-girder systems, with sup
-ported span lengths ranging from 10 m to 40 m and cantilever span lengths from 2.5 m to 10 m, totalizing 24 different structures. For these cases of short spans free trafic low scenarios are determi
-nant [8], as opposed to longer systems for which trafic jam and mixed trafic have to be considered.
In the absence of updated weigh in motion (WIM) trafic measure
-ments in Brazilian highways, a hybrid vehicle database containing the necessary trafic statistical information was built from ive dif
-ferent data sources including three weighing stations in highways and trafic weighing and volume distribution research performed in many Brazilian regions by DNIT – the National Department for Transportation Infrastructure. The data base is composed of 29 classes of commercial vehicles, each one having probability den
-sity functions (PDFs) of typical trafic parameters, such as gross vehicle weight (GVW), axle and axle group weights, speed and axles spacing (wheelbases); there are also deterministic values for some vehicle dimensions and maximum axle weights.
Trafic simulations considering some possible scenarios for trafic lane distribution led to histograms of selected bridge static effects, which were extrapolated by means of the probability level, consid
-ering Weibull distributions itted to these histograms. The obtained representative values of the static effects due to real trafic of heavy vehicles are herein compared to the static effects produced by both Brazilian load models from the past NB-6 and the current NBR 7188, when applied to the same short span bridge systems.
2. Heavy vehicles database
The data collected during 14 consecutive days in 2011 at one truck
weighing station along the São Paulo State highway SP-348
(admin-istered by the Concessionaire CCR AutoBAn), is fairly representa
-tive of the heavy trafic in Brazil. It was then taken as reference to
Figure 1 – Current Brazilian load model vehicle (NBR 7188): (a) side view; (b) plan view. Units: m
the database developed in this work, named H-2013 (H stands for hybrid; it was developed in 2013) [5]. As the available data neither include information on buses, vehicle speed, wheelbases nor allow the distinction among certain vehicle classes with the same number
of axles, the H-2013 database was developed by gathering
infor-mation from other 4 sources including weighing and trafic surveys carried out by Brazilian Federal Organizations. It was found that the statistical information of all these data is quite similar and that the
adoption of a hybrid base would not yield important deviations. In addition to the data provided CCR AutoBAn from 14 days
mea-surements in 2011, the other 4 sources of data were the following:
n DNIT´s trafic survey in ifteen stations in several States of Bra
-zil between 1999 and 2002 by means of WIM measurements;
n trafic survey performed by CENTRAN (Excellence Center in
Transport Engineering, a government agency linked to the Bra
-zilian Army) on Federal Bra-zilian Highways by collecting data in 109 counting stations spread all over the country in a seven
days period in 2005;
n data collected at the same weighing station in SP-348 state
highway consisting of a set of sheets containing daily records of a 6-days period in June 2008;
n data provided by Ecovia concessionaire from a weighing sta
-tion located on the BR-277 highway, containing daily records of a 28-days period in June 2008.
2.1 Trafic composition
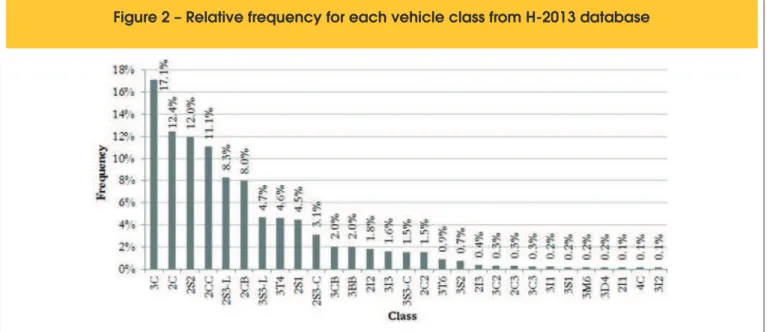
The database H-2013 trafic composition is shown in Figure 2 and comprises 29 classes of commercial vehicles which are illustrated in Table 1.
Figure 2 – Relative frequency for each vehicle class from H-2013 database
Table 1 – Brazilian commercial vehicles spectrum: classes and silhouettes
Class Silhouette Class Silhouette Class Silhouette
2CC 2S1 3I1
2C 2S2 3I2
3C 2S3 3I3
4C 2I1 3T4
2C2 2I2 3T6
2C3 2I3 3M6
3C2 3S1 2CB
3C3 3S2 3CB
Classes 2S3 and 3S3 are quite frequent (see Figure 2) and their GVW distributions have more than one mode; therefore they were divided into long (L) and short (S) types according to the distance between the last axle of the tractor unit and the irst axle of the trailer.
2.2 Gross Vehicle Weight (GVW) and axle weights
During the development of Eurocode 1 [9] load models, axle load records were ampliied in 10% to take into account dynamic ef
-fects [10,11]. Conversely, no ampliication was applied to the re
-cords for the AASHTO LRFD load model [12,13]. For the purpose of this work comparisons between GVW measured while moving at 60 km/h maximum speed and registered at a static scale showed deviations within +5% and -5% GVW [7], therefore the adopted weight was the load measured by the WIM system (from the weigh
-ing station located at SP-348, data from June-2008).
Figure 3a shows GVW cumulative distribution for class 3C, while Figure 3b illustrates the variation of the rear axles group weight with GVW for the same class; the values of mean and standard deviation are showed in their subtitles. It can be seen that there is a signiicant amount of records exceeding the Brazilian legal weight limit, which in this case equals 230 kN.
In order to do the trafic simulation PDFs were itted to each one of the 29 vehicle classes GVW histogram; the best model was cho
-sen among 18 different continuous functions. After testing these models individually or particular linear combinations of some of them (depending on the number of modes of each histogram), the most appropriate model – which is the most similar to the sample data - was elected via goodness-of-it tests (chi-squared and Kol
-mogorov-Smirnov). Although not being as accurate as other meth
-ods [14], the method of moments, because of its simplicity, was used instead to perform the parameter estimation. Table 2
sum-Figure 3 – Variation of: (a) GVW cumulative distribution for class 3C ( = 154.3 kN;
X
s = 44.0 kN); (b) 3C rear axle group weight with GVW ( = 110.9 kN; s = 38.8 kN)
X
A
B
Class Distribution 1 Distribution 2 Distribution 3
Type A.V. S.D. Type A.V. S.D. Type A.V. S.D.
2CC GAM 56.9 15.8 – – – – – –
2C GAM 91.2 20.3 – – – – – –
3C WEI 112.7 18.2 UNI 190.1 24.7 EXP 256.8 13.7
2S2 GUM 194.0 42.2 – – – – – –
2S3-C DEX 394.9 50.4 – – – – – –
2S3-L 2MN 353.8 71.4 RAY 494.9 40.1 – – –
3S3-C DEX 443.0 26.9 – – – – – –
3S3-L 2MN 427.3 45.3 FRE 504.7 34.1 – – –
3T4 DEX 541.0 44.3 – – – – – –
A.V. = average value; S.D. = standard deviation; DEX = double exponential; EXP = exponential; FRE = Frèchet (Type II max); GAM = Gamma; GUM = Gumbel (Type I max); RAY = Rayleigh; UNI = Uniform; WEI = Weibull (Type III min); 2MN = Type II min
marizes the information on the distributions fitted to the GVW histograms of the most frequent classes.
Axle weights were also considered as random variables. To
avoid the use of correlations between axle weights, the scat
-ter diagrams relating for each class the axle groups weights to the GVW (like the one shown in Figure 3b) were submitted to adjustment curves by means of least squares fitting. For all
those diagrams it was found that linear models always display
the best adjustments and were therefore the assumed curves. Besides providing the axle loads as a function of GVW these curves were also used to estimate the maximum GVWs as a function of the assumed maximum axle loads as detailed in
the following.
Limitation in GVW values aims to preserve physical represen
-tation of the traffic simulation, which seeks values of bridge internal forces generated only by actual vehicles. Maximum assumed axle loads are shown in the last column of Table 3 and for which it was considered both the extreme axle weight values available in databases and the technical axle load thresholds informed by manufacturers that vary widely with the intended use of each vehicle: trucks, trailers and buses have
different limits.
2.3 Wheelbases
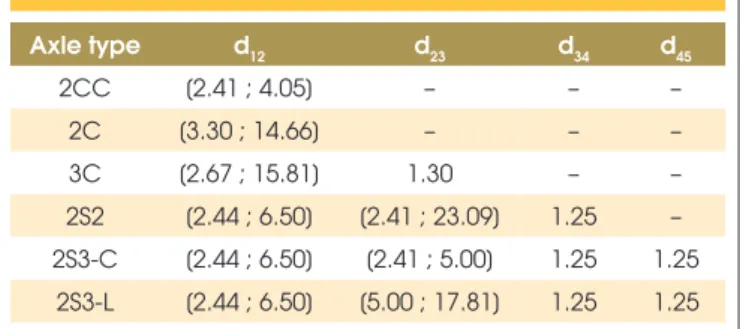
Most wheelbases were considered random variables which were itted to PDF models as performed for the GVWs. Table 4 shows some of these population models. For the estimation of wheelbases extreme values all the information acquired from the database as well as the manufacturers’ speciications were considered. Tandem and tridem wheelbases and other distributions with small coeficient of variation were considered deterministic. Table 5 shows some of these deterministic values and ranges for wheelbases. It can be seen from Tables 4 and 5 that some wheelbases may vary within a wide range and their PDFs may have more than one mode.
2.4 Vehicle speeds
Figure 4 shows histograms describing speed distribution for single-unit trucks (such as 2C and 3C), buses and semitrailers
(like 2S2 and 2S3); the values of mean and standard deviation are showed in the subtitles. In all cases the most frequent speed is 80 km/h. There are few speed records exceeding 140 km/h.
Table 3 – Maximum axle loads recorded by
scales in databases
Axle type
Registered
maximum load Legal
limit (kN) Assumed maximum load (kN) Value (kN) Class
Single 105.5 2S2 60 110
Double 173.8 2S3 85/100* 180
* 85 kN for tandem axles; 100 kN for isolated axles
Class Dist. Distribution 1 Distribution 2 Distribution 3
Type A.V. S.D. Type A.V. S.D. Type A.V. S.D.
2CC d12 LGT 3.84 0.38 – – – – – –
2C d12 EXP 5.31 0.80 – – – – – –
3C d12 FRE 5.20 0.65 – – – – – –
2S2 d12 DEX 3.63 0.17 RAY 4.41 0.18 – – –
2S2 d23 LOG 4.82 0.67 NOR 8.09 0.93 GUM 12.5 0.70
2S3-C d12 RAY 3.62 0.11 RAY 4.37 0.20 – – –
2S3-C d12 NOR 3.20 0.25 UNI 4.37 0.37 – – –
2S3-L d12 3MX 3.62 0.13 GUM 4.29 0.19 – – –
2S3-L d23 FRE 6.26 0.74 – – – – – –
A.V. = average value; S.D. = standard deviation; DEX = double exponential; EXP = exponential; FRE = Frèchet (Type II max); GUM = Gumbel (Type I max); LGT = Logistic; LOG = Lognormal; NOR = Normal; RAY = Rayleigh; UNI = Uniform; 3MX = Type III max
Table 4 – Population models fitted to some wheelbases; d
ijis the distance
between axles i and j; units: m
Table 5 – Some deterministic values and ranges
for wheelbases (m); d
ijis the distance between
axles i and j
Axle type d12 d23 d34 d45
2CC [2.41 ; 4.05] – – –
2C [3.30 ; 14.66] – – –
3C [2.67 ; 15.81] 1.30 – –
2S2 [2.44 ; 6.50] [2.41 ; 23.09] 1.25 –
2S3-C [2.44 ; 6.50] [2.41 ; 5.00] 1.25 1.25
3. Structural models
The bridges considered in this study are reinforced concrete Π cross-section structures (Figure 5), which were modeled as a simple grid composed of two main T-beams, a number of cross beams located at intermediate positions in its spans and also at the supports. The two bridges’ Π type cross sections shown in Figure 5 represent a large portion of Brazilian highways’ ex
-isting short span bridges [15], corresponding to designs origi
-nally planned for single carriageway two-lanes highways. The first one (Figure 5a) refers to old “narrow” bridge deck width, that was the standard type until the 1980s. From that decade on, it was adopted for the Brazilian highways a larger deck slab (Figure 5b); the “wide” deck that has been the standard
type till today.
The schematics of the bridge’ structures longitudinal pro
-iles are illustrated in Table 6 together with the inluence lines of internal forces and moments at critical sections consid
-ered in this work: shear force at support and positive bend
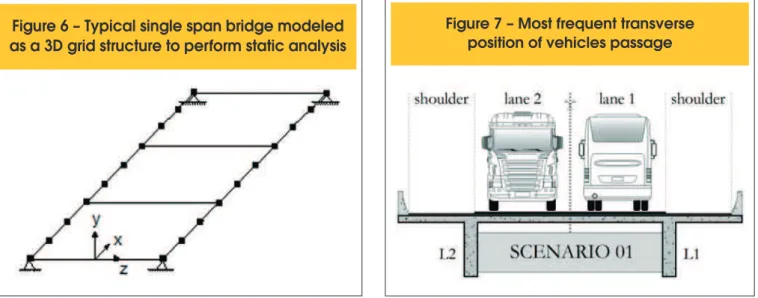
-ing moment for simply and two-span continuous systems and negative bending moment at the support of cantilever and continuous systems. Span lengths range from 10 m to 40 m for simply supported and continuous systems, and from 2.5 m to 10 m for cantilever span. Figure 6 illustrates a typi
-cal grid numeri-cal model used for static analyses, where T-beams and cross beams are represented by frame elements.
4. Trafic simulation
4.1 Developed computational tool
In order to obtain the critical internal forces produced by the simu
-lated trafic, it was developed a computational tool that works in two steps [6]:
n Trafic simulation: the initial stage generates information for
all the vehicles composing the trafic spectrum, such as ve
-hicle class, speed, GVW, wheelbases etc. In order to gener
-ate values for the random variables, Monte Carlo technique is
employed;
Figure 4 – Speed distributions: (a) single-unit trucks ( = 77.1 km/h; s = 13.5 km/h);
X
(b) buses ( = 82.4 km/h; s = 16.4 km/h); (c) semi-trailers ( = 78.3 km/h; s = 11.2 km/h)
X
X
A
B
C
Figure 5 – Two-girder RC bridges cross sections considered in this
paper: (a) narrow deck (ND); (b) wide deck (WD). Units: cm
n Structural analysis: in this stage, vehicles generated by simu
-lation travel along the model structures. Effects caused by the generated loading are recorded in certain sections (those in
-dicated in Table 6) at each time step. The maximum effect at each loading cycle is also registered. At the end of simulation the process recorded effects are summarized in histograms. According to O’Connor and O’Brien [16], four different trafic situ
-ations should be analyzed: trafic jams, mixed low, free low and emergencies. In small spans, critical load cases are due to heavy vehicles crossing and are affected by dynamic ampliication factor. In large spans, however, critical load cases are due to simultane
-ous presence of several vehicles on structures in congested or mixed low, with little or no dynamic ampliication [11]. As the struc
-tures considered herein have maximum length of 40 m, congested and mixed low situations were not analyzed. In free lowing, the time between vehicles is modeled as a random variable. Trafic is
generated at each lane independently; correlations between ran
-dom variables of the same vehicles in different lanes with same direction may be important [17], but weren’t taken into account. Trafic simulations were performed for a total of 30 days. The simu
-lator checks if, at the current instant of time, there is at least one vehicle with at least one axle on the bridge. If so, the computational tool calculates the desired effects at the reference sections. Struc
-tural analysis ceases when all vehicles in all lanes have already travelled along the bridge; then histograms are produced for every considered effect.
For trafic simulation, speed histograms from H-2013 database were considered discarding values lower than 30 km/h or greater than 140 km/h. Time between vehicles was modeled by a gam
-ma distribution [11]. The adoption of this distribution is suggest
-ed in the case of the process of vehicles arrival be idealiz-ed as a Poisson process. Due to lack of information, it was adopted a
Table 6 – Structural systems, reference cross-section in girder and influence lines of critical effects
considered in this paper
Structural system Simply supported Two-span continuous Cantilever
Representation
Shear force
Diagram –
Section Support Central support –
Shear force Diagram –
Section Midspan Approx. midspan –
Shear force Diagram –
Section – Central support Support
Figure 6 – Typical single span bridge modeled
as a 3D grid structure to perform static analysis
coeficient of variation equal to 0.5 for all distributions of time be
-tween vehicles. The simulation does not take into account accel
-eration, braking or lateral displacements.
In the structural analysis the force exerted by each tire is modeled by a concentrated load and the effects due to each load are calcu
-lated using inluence surfaces. The trafic simulator was validated through some tests that demonstrated its accuracy [6].
4.2 Trafic scenarios considered
The transverse location of passing vehicles in opposite senses of
trafic direction pictured in Figure 7, named scenario 1, is the most frequent scenario for one carriageway typical bridge with two traf
-ic lanes centered along its axis; most of the heavy veh-icles pass along the longitudinal axis of each lane. However, taking girder L1 as a reference for ultimate limit state design situation, the worst load case occurs for the trafic of vehicles out of the lanes marked along the pavement. Thus, many possibilities are opened for traf
-ic on bridges. For the wider bridge deck considered in this work a variety of trafic situations are depicted in Figure 8 as scenarios 2 to 9, all of them for free lowing trafic of vehicles. It should be observed in this igure that the transverse distribution of lanes,
shoulders and clearances differ from the actual situation in exist
-ing bridges [11]. Nevertheless it is considered in order to achieve the worst transverse load distributions, the vehicles traveling on the border lane or shoulder of the bridge deck, close to the lateral
barrier or guard-rail.
In scenarios 3, 5, 7 and 9, lanes are located on the right, as close as possible to girder L1, while the shoulders are clustered on the left of the deck, to represent emergency or temporary construction situa
-tions. In scenarios 1 to 5, vehicles travel in two trafic lanes, accord
-ing to original design assumption, while in scenarios 6 to 9 the car
-riageway is divided in 3 lanes to conform to trafic growth. All these situations are feasible only to the wide slabs (Figure 5b) since the trafic lanes are all 3.60 m wide. The scenarios considered herein intend to envelop all possible free lowing and emergency situations foreseen during lifetime of these typical RC bridges.
4.3 Adopted ADTT - Average Daily Truck Trafic
ADTT was estimated by using information from AB-2011 database whose average number of records equals 6,104 vehicles/day. However, the total number of commercial vehicles on the highway is greater than the number of records because (i) some vehicles
avoid the weighing station, mainly due to legal limit weight
sur-plus and (ii) the records were not obtained continuously since the weighing station closes in peak times until the queue of trucks is reduced to a few hundred meters. The actual number of commer
-cial vehicles is estimated to be 15% greater than the volume mea
-sured by the weighing station, already including the presence of buses, which are not subject to weighing in this highway. Consider
-ing this “adjustment factor” the actual commercial vehicle ADTT in this database is estimated equal to 7,019 trucks and buses. This value is called reference low (RF) and includes heavy trafic in all the three lanes of the considered highway.
4.4 Distribution of the trafic low among the lanes
Due to lack of available recent trafic data collected directly in the lanes, the proportion of total trafic supported by each lane has to be estimated. Table 7 shows the distribution of total low among lanes given by some authors, for two trafic lanes in the same di
-rection. Values are relatively similar. In Getachew [18] and Prat [11] the proportions were estimated from detailed trafic studies per
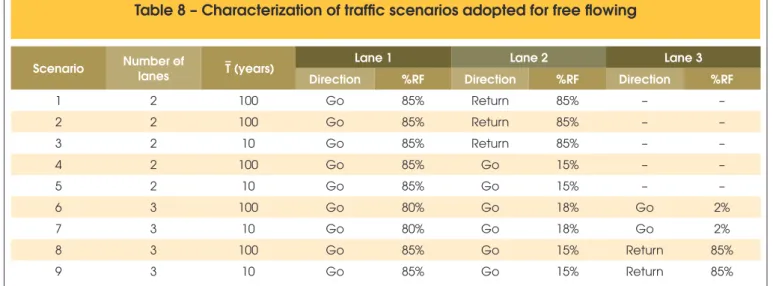
-formed respectively in roads of France and Sweden; O’Brien and Enright [17] refer to data collected on Netherlands (A) and Czech Republic (B) highways. For this study, in the case of two lanes in the same sense of trafic direction, it was assumed that 85% of total low is supported by lane 1, lower than values presented in Table 7, since the reference low RF refers to 3 lanes. The adopted proportions of total low supported by each lane in each scenario are summarized in Table 8.
5. Determination of static
effects’ characteristic values
For Eurocode 1 load models calibration, the target values were taken with a return period of 1,000 years, to ensure a small prob
-ability of excess in effects’ values: 0.1% per year [10]. This choice was made to limit the likelihood of several exceedances of the ser
-viceability limit state during lifetime. The AASHTO load model HS-93 was calibrated assuming a return period of 75 years [13]. To set the return period for the extrapolations of static effects one
Table 7 – Proportions of total flow supported
by each lane on two-lane (in same direction)
carriageways
Reference Division of the broad traffic
lane 1 lane 2
Prat (2001) 92.0% 8.0%
Getachew (2003) 89.7% 10.3%
O´Brien and Enright (2011) – A 92.3% 7.7%
O´Brien and Enright (2011) – B 93.8% 6.2%
Scenario Number of
lanes T (years)
Lane 1 Lane 2 Lane 3
Direction %RF Direction %RF Direction %RF
1 2 100 Go 85% Return 85% – –
2 2 100 Go 85% Return 85% – –
3 2 10 Go 85% Return 85% – –
4 2 100 Go 85% Go 15% – –
5 2 10 Go 85% Go 15% – –
6 3 100 Go 80% Go 18% Go 2%
7 3 10 Go 80% Go 18% Go 2%
8 3 100 Go 85% Go 15% Return 85%
9 3 10 Go 85% Go 15% Return 85%
should take into account that a very large return period is not rep
-resentative [8] because the trafic probably will not remain with the same settings. The rapidly changing technology causes distortion
of the load pattern in long-term violating the stationarity of these
random processes which partially invalidates the large return pe
-riods, unlike natural phenomena such as wind speeds and river loodings.
On the other hand, the extrapolation is being held for random
un-measured but indirectly modeled quantities - the internal forces - which can generate errors, so that for safety conservatively large return periods must be adopted [11]. Considering both aspects a return period of 100 years was adopted for target values calcula
-tion in simula-tions according to scenarios 1, 2, 4, 6 and 8, which
do not include relocation of lanes. As scenarios 3, 5, 7 and 9 re
-fer to special situations, simulations under these conigurations were carried out with a return period of 10 years. In all cases traf
-ic growth was not taken into account for the extrapolation. These values are shown in the third column of Table 8.
For the critical static effects shown in Table 6, the following steps were accomplished in order to obtain the corresponding charac
-teristic values:
n building of the histograms of static effects via trafic simulations
for all scenarios shown in Figure 8, and itting of a Weibull dis
-tribution for each histogram;
n calculation of the characteristic values of these distributions,
using the probability level of the parent Weibull distribution and
Axle, i Truck class 3S3-C, lane 1 Truck class 3M6, lane 2
d i-1 , i (m) Load (kN) d i-1 , i (m) Load (kN)
1 0.00 55.8 0.00 58.9
2 4.80 100.2 3.46 87.2
3 1.30 100.2 1.35 87.2
4 3.09 107.6 5.32 85.8
5 1.25 107.6 1.25 85.8
6 1.25 107.6 1.25 85.8
7 – – 5.06 86.4
8 – – 1.25 86.4
9 – – 1.25 86.4
Table 9 – Wheelbases d
i-1,
i(m) and load of the vehicles that yielded the maximum bending moment
of a simply supported 20 m span bridge with wide deck
considering the return periods showed in Table 8. These charac
-teristic values were took as representative of each static effect;
n adopting the scenario with the largest representative value as
the reference for each considered effect in each structure. Among all vehicle classes shown in trafic composition (Table 1 and Figure 2), those which effectively contribute to the extreme static effects are 2S3, 3S3, 3T4, 3T6 and 3I3; all of them are sus
-ceptible to high values of GVW.
In short spans, up to 10 m, the presence of tridem axles from class
-es 2S3 and 3S3 govern the extreme effects. As the span lengths increase, also increase the likelihood of longer and heavier vehi
-cles from classes 3I3, 3T4, 3T6 and 3M6 pass on the bridges with all axes simultaneously acting at multiple sections of the girders. Although classes 3T6 and 3M6 are quite infrequent in the trafic composition, they correspond to the longest trucks and the biggest GVW among all classes from Figure 2; this could explain its impor
-tance in static effects’ extreme values.
Taking as example the bending moment in a simply supported 20 m span bridge with wide deck (Figure 5b), the maximum value ob
-tained by trafic simulation is 3059 kNm, due to simultaneous pres
-ence of two vehicles in scenario 3 - see Figure 8 - side by side, both travelling at 80 km/h: on lane 1 a 3S3-C truck with GVW equal to 578.9 kN; and on lane 2 a 3M6 truck with GVW equal to 749.9 kN. Each wheelbase and axle load of these trucks is shown in Table 9. Figure 9 illustrates the instant of time when these vehicles
generate the largest bending moment at mid-span of girder L1.
Figure 10 shows the histogram of positive bending moments for the simply supported 20 m span bridge with wide deck, the Weibull distribution itted to this histogram and its distribution of extremes, whose mode is equal to 3836 kNm. This value is equal to the ex -trapolated value obtained by the probability level using the parent
Figure 10 – Histogram and fitted Weibull
distribution of the positive bending
moment of the simply supported
20 m span bridge with wide deck
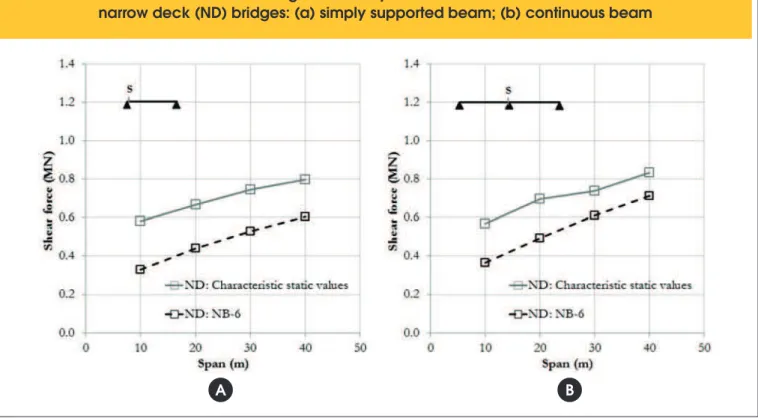
Figures 11 – Comparison in terms of static shear force between the extreme values produced by
the real traffic and those generated by NB-6 Brazilian code load model for
narrow deck (ND) bridges: (a) simply supported beam; (b) continuous beam
Weibull distribution and is taken as the characteristic value of the static bending moment.
The ratio between the characteristic value and the maximum val
-ue reached by the simulation in 30 days equals 1.254. One can check, assuming linear static behavior, that extrapolation leads to physically feasible results. This ratio, multiplied by the GVWs of the trucks that generated the greatest static bending moment within 30 days of trafic simulation (Table 9), results in these “new” GVWs: 726.0 kN for the 3S3-C truck on lane 1 and 940.4 kN for the 3M6 truck on lane 2. Retaining the same relative positions shown in Figure 9, this new combination of trucks would generate a bending moment equal to 3836 kNm. Both GVWs are smaller than its up
-per limits: 963.0 kN for 3S3-C and 1333 kN for 3M6. These values depend on the maximum axle loads (Table 3) and on the linear models considered to represent the load for each axle or group of axles, which is function of the GVW [5].
6. Comparison between the obtained
characteristic static effects and those
generated by the brazilian live load models
In Figures 11 to 16 the representative (extreme) values of the static effects (shown in continuous lines), which are caused by the traf-ic of real veh-icles, are compared to those produced in the same structural models (see Figure 6) by the live load models prescribed in the Brazilian codes NB-6 and NBR 7188 (shown in dashed lines). Only the static effects produced by these live loads were considered as they were not multiplied by the impact factor. Fig
-ures 11 to 13 refer to the narrow bridge deck (ND) coniguration
designed with the old load model from NB-6 while Figures 14 to 16 are related to the wide deck bridge (WD) designed according to the current live load from NBR 7188.
Figures 11 and 14 illustrate the variation with the span length of the maximum shear forces in simply supported span (Figure 11a
and 14a) and continuous spans (Figure 11b and 14b) bridges. Fig
-ures 12 and 15 show comparisons in terms of positive bending moments for each one of the same structural systems. Negative bending moments in continuous and cantilever spans are shown in Figures 13 and 16.
It can be seen in these igures that the static effects generated by the real trafic of vehicles as calculated according to the proce
-dures described herein are in general greater than those produced by the past and current Brazilian standards load models. The most critical cases are related, as expected, to the narrow deck bridges: the static shear forces in simply supported bridges, the positive bending moments and the negative bending moment in cantilever bridges due to the real trafic of vehicles exceeded on average respectively 50%, 53% and 75% the static effects caused by the old NB-6 load model.
It is noticeable that the current Brazilian code gives conservative
values only for the negative bending moment in 30 m and 40 m
continuous spans with wide bridge deck (Figure 16a). The greater average exceedance of the trafic load static effect in relation to the corresponding code load model was found for the negative bend
-ing moments in cantilevers (Figure 16b): 48%.
These results show that Brazilian code load models may not repro
-duce adequately the real trafic of heavy vehicles and may, in many cases, be non-conservative. The dynamic effects and the modeling
Figures 12 – Comparison in terms of static positive bending moment between the extreme values
produced by the real traffic and those generated by NB-6 Brazilian code load model
for narrow deck (ND) bridges: (a) simply supported beam; (b) continuous beam
Figures 13 – Comparison in terms of static negative bending moment between the extreme
values produced by the real traffic and those generated by NB-6 Brazilian code load
model for narrow deck (ND) bridges:(a) continuous beam; (b) cantilever beam
A
B
Figures 14 – Comparison in terms of static shear force between the extreme values produced
by the real traffic and those generated by NBR 7188 Brazilian code load model
for wide deck (WD) bridges: (a) simply supported beam; (b) continuous beam
Figures 15 – Comparison in terms of static positive bending moment between the extreme values
produced by the real traffic and those generated by NBR 7188 Brazilian code load
model for wide deck (WD) bridges: (a) simply supported beam; (b) continuous beam
A
B
Figures 16 – Comparison in terms of static negative bending moment between the extreme values
produced by the real traffic and those generated by NBR 7188 Brazilian code
load model for wide deck (WD) bridges:(a) continuous beam; (b) cantilever beam
of uncertainties must be taken into account for a inal conclusion
on this matter.
It can still be noted in Figures 11 to 16 that the curves related from one side to the real trafic of heavy vehicles and from the other side to load models are in general divergent with increasing span length, particularly in the case of bending moments. This indicates
that the safety margin of the Brazilian load models is not uniform
for all span lengths and structural systems.
7. Final remarks and conclusions
It is outlined in this paper the main results obtained in the irst stage of the work performed towards the development of new live load models which aim to simulate the effects caused by the real trafic loads on existing two girders short span bridges, typical of Brazil
-ian roadways comprising two lanes single carriageway.
The lack of a large number of WIM records was got around by establishing a database which brought together measurements from weighing stations and idealized trafic scenarios. Applied traf
-ic simulation techniques allow for scenarios of multiple veh-icles on the bridges and provided the histograms of the selected critical effects. Then Weibull distributions were itted to these histograms from which the characteristic static effects were calculated by ex
-trapolations according to the return period deined for the trafic scenarios. In each structure the representative values of the critical static effects were considered as the highest characteristic values among all trafic scenarios.
It was observed from the trafic simulations that in short spans (up to 10 m) the passage of tridem axles from classes 2S3 and 3S3 governed the extreme effects. In larger spans the critical effects were caused by the simultaneous presence of longer and heavier vehicles once all their axles can be located simultaneously on the bridge deck.
In most cases the static effects generated by real trafic, as cal
-culated according to the procedures described herein, are higher than those produced by the load models from Brazilian design codes (without multiplying them by the dynamic ampliication fac
-tor). These results show that Brazilian code load models may not reproduce adequately the real trafic of heavy vehicles and may, in many cases, be non-conservative.
The current Brazilian code NBR 7188 gives conservative values only for the negative bending moment in 30 m and 40 m continu
-ous spans with wide bridge deck. The negative bending moments in cantilever spans produced by this code live load model are sig
-niicantly lower than the extreme ones generated by the trafic of heavy vehicles.
A great number of bridges with narrow decks designed under the 1960 NB-6 code are still in full service. In was observed that static effects due to the load model from this code (see Figures 11 to 13) are always much lower than the extreme ones produced by the real trafic, indicating that these bridges may exhibit now a small fraction of the required safety margin and therefore should be reinforced. It is important to mention that there are several sources of uncer
-tainty in modeling which affect the numerical values obtained for the characteristic static effects. The uncertainties in the structural mod
-eling do not affect the ratios between the internal forces due to the real trafic loads and those due to the design code live load models, since the same grid model is analyzed for both loading sources. On
the other hand, uncertainties related to trafic statistics and simula
-tion, in particular the need to idealize trafic scenarios and neglect of trafic growth rate may affect results to the better or to the worse. These uncertainties are to be addressed in the near future with en
-larged trafic data acquisition, as they must be dealt with when per
-forming the structural reliability analyses of the bridges.
In order to achieve fully the new load models complementary work steps 5 to 7 described in Section 1 are being carried out and re -sults will be reported in the near future.
The coniguration of the new live load models comprising concen
-trated and distributed loads must reproduce the target values of selected internal forces considering free, congested and mixed traf
-ic low. With the geometr-ical and phys-ical features of the new load models, one can calibrate new related safety factors, seeking for a unique compromised reliability index to all selected types of bridges.
8. Acknowledgements
Sincere thanks are given to the National Council for Scientiic and Technological Development – CNPq and FAPERJ, the Rio de Janeiro State research agency, that funded the development of this research. Special thanks are also due to Colonel Paulo Roberto Dias Mo
-rales, from DEC (Brazilian Army), for furnishing the worksheets containing information collected by the CENTRAN in 2005; to Eng. Nilton Velihovetchi from Concessionaire CCR Ponte and to the Concessionaires CCR AutoBAn, for kindly supplying information from weighing station PGF 58 in 2008 and 2011; and to Ecovia Caminhos do Mar S.A., for making available data from the weigh
-ing station PPV 03 in July 2008.
9. References
[1] Brazilian Association of Technical Standards – ABNT. NBR 7188 – Live load on highway bridges and footbridges (in Por
-tuguese), Rio de Janeiro, Brazil, 1982.
[2] Brazilian Association of Technical Standards – ABNT. NB-6 – Live load on highway bridges (in Portuguese), Rio de Ja
-neiro, Brazil, 1960.
[3] Deutsche Institut für Normung. DIN 1072 - Straßen- und We
-gbrücken; Lastannahmen, Berlin, Germany, 1952.
[4] Rossigali, C. E. Probabilistic Studies towards Live Load Models for Brazilian Highway Bridges (in Portuguese). M.Sc. Dissertation, Federal University of Rio de Janeiro, Rio de Ja
-neiro, Brazil, 2006.
[5] Rossigali, C. E. Update in Live Load Model for Small-span Highway Bridges in Brazil (in Portuguese). D.Sc. Thesis, Federal University of Rio de Janeiro, Rio de Janeiro, Bra -zil, 2013.
[6] Rossigali, C. E., Pfeil, M. S. and Sagrilo, L. V. S. Trafic simu -lation aiming new load models to highway bridges. In: XXXII
Iberian Latin American Congress on Numerical Methods in Engineering, Ouro Preto, Brazil (in Portuguese), 2011. [7] Rossigali, C. E., Pfeil, M. S. and Sagrilo, L. V. S. Trafic data
Basis of design and actions on structures, Part 2, “Trafic loads on bridges”, Brussels, Belgium, 2003.
[10] Calgaro, J.-A. Loads on Bridges. Progress in Structural En
-gineering and Materials, v.1, n.4, 1998, p.452-461.
[11] Prat, M. Trafic load models for bridge design: recent devel
-opments and research. Progress in Structural Engineering and Materials, v.3, 2001, p.326-334.
[12] American Association of State Highway and Transporta
-tion Oficials. AASHTO LRFD Bridge Design Speciica-tions, Washington, DC, USA, 2007.
[13] Nowak, A. S. Live load model for highway bridges. Structural Safety, v.13, 1993, p 53-66.
[14] Ang, A. and Tang, W. Probability Concepts in Engineering: Emphasis on Applications to Civil and Environmental Engi
-neering, New York: John Wiley & Sons, 2ed, 2007.
[15] Mendes, P.T.C. Contributions to a RC bridge management model applied to Brazilian highways network (in Portu
-guese). D.Sc. Thesis, University of São Paulo, São Paulo,
Brazil, 2009.
[16] O´Connor, A. and O´Brien, E. J. Trafic load modeling and factors inluencing the accuracy of predicted extremes, Ca
-nadian Journal of Civil Engineering, v.32, 2005, p.270-278. [17] O’Brien, E. J. and Enright, B. Modeling same-direction
two-lane trafic for bridge loading, Structural Safety, v.33, 2011, p.296-304.
[18] Getachew, A. Trafic loads on bridges: Statistical Analysis of Collected and Monte Carlo Simulated Vehicle Data. Ph.D. Thesis, Royal Institute of Technology, Stockholm, Sweden,