*e-mail: [email protected]
Influence of Neutral and Charged Species on the Plasma Degradation of the Stearic Acid
Euclides Alexandre Bernardellia,c*, Marcio Mafrab, Ana Maria Maliskac,
Thierry Belmonted, Aloisio Nelmo Kleinb
aFederal Institute of Santa Catarina – IF-SC, Florianópolis, SC, Brazil bFederal University of Technology of Paraná – UTFPR, Curitiba, PR, Brazil
cFederal University of Santa Catarina – UFSC, Florianópolis, SC, Brazil dInstitut Jean Lamour, Nancy-Université, Nancy, Lorraine, France
Received: June 28, 2012; Revised: October 7, 2012
In this work, stearic acid (SA) was degraded in an Ar-O2 and Ar-H2 post-discharge environment created by a plasma reactor with a microwave source and in an Ar, Ar-H2 and Ar-O2 DC (Direct Current) discharge environment created in a cathode-anode confined system. The afterglow region is useful for understanding the role of the chemically active species (O, O2, H and H2). In contrast, the discharge region allows the observation of the effects of chemically active species, charged species (ions and electrons) and photons. The influence of these species on the grafting and etching of SA was evaluated by measuring the mass variation, mass variation rate and chemical composition. The results showed that when only chemically active oxygen species are present, the SA is preferentially grafted. However, when both photons and charged species are present, the SA is more efficiently etched. When the Ar-H2 and Ar environments are utilized; the SA is not efficiently degraded.
Keywords: stearic acid, DC discharge, post-discharge, grafting, etching, plasma cleaning
1. Introduction
In surface engineering, a wide range of treatments are employed to improve the material properties of mechanical parts that are subjected to wear, fatigue and corrosion. Considerable research and development of these treatment techniques has been observed in recent years. However, almost all of the surface treatments are sensitive to contamination. For this reason, a cleaning step must be conducted to remove the contaminants present on the surfaces. In mechanical and metallurgical industries, where the most commonly observed contaminants are organic compounds such as oils and greases, effective methods to remove these substances play an important role in the end performance of the product1-3.
Plasma cleaning is a suitable method for removing organic contaminants and lacks the high costs and hazardous processes associated with other methods4-7. However, plasma cleaning industrial applications is still restricted because the mechanisms are not well understood. Recent works6,8,9 have shown that different treatment stages can occur, even under the same plasma conditions. During a treatment, etching and grafting of long chain molecules are concurrent, and as a result, the mass variation does not evolve linearly. Controlling the chemical changes in the material is a key step to better understand the interactions occurring between the plasma and the surface of a material; this control is necessary to ensure efficient plasma cleaning.
Under certain conditions, plasma treatments can affect the chemical bonds of a contaminant and strengthen them; further removal can become difficult or impossible15. Noel et al.10 showed that the treatments using Ar-N
2 plasma
can create double bonds, increasing the stability of the
stearic acid (SA). Using Ar-O2 plasma10, it is possible to etch the SA. However, this treatment creates an oxidised chain, causing the efficiency of the treatment to drop significantly as time progresses.
Several studies have been conducted to better understand the interaction mechanism between organic molecules and active and charged species generated in plasma treatments5,4,11,12. In these investigations, Hexatriacontane (HTC), which possesses only simple C–C and C–H bonds, was evaluated as a contaminant. The O/O2 (in all states) ratio and the temperature were shown to be key factors that affected the etching and/or grafting of HTC. However, to understand how the plasma cleaning process occurs more generally, many organic molecules with different types of bonds and functional groups must be studied to obtain a better representation of organic contaminants.
Additionally, studies have been performed on SA10,7,13 to determine how carboxylic groups (COOH) react when exposed to chemically active species in the post-discharge region of Ar-O2 plasma. Through these treatments, the interaction mechanisms of SA with these species were identified. After understanding the effect of the chemically active species, treatments were evaluated in a discharge environment, and the influence of charged species and photons was determined14,15.
The aim of the study was to promote a better understanding about the influence of chemically active species with charged species and photons with respect to their interaction with SA. SA was treated in two ways: in the glow region of a DC discharge with different atmospheres (Ar, Ar-H2 and Ar-O2) and in the late afterglow region of microwave Ar-H2 and Ar-O2 plasmas.
2. Experimental Setup
Stearic acid (CH3(CH2)16COOH) has a linear structure containing C-C and C-H bonds and a carboxylic acid group at the end of the chain. The properties of this material are as follows: molar mass = 284.47 g.mol–1; density = 0.847 g.cm–3; melting point = 69,6 °C; and ebullition point = 383 °C. The commercial SA used was 98% pure, and the remaining 2%
of the material was composed primarily of hydrocarbons, oxalic acid and water.
To prepare the samples, 1.2 g of SA was melted and poured into the Teflon crucible, where it solidified. Next, the crucible was capped to avoid high temperature gradients and, consequently, inhomogeneous structures in the sample until it cooled down to room temperature. The crucible dimensions and positioning in both treatment chambers, the DC discharge and the microwave afterglow are presented in the details of Figures 1 and 2. These two experimental setups are discussed hereafter.
2.1.
First experimental setup
The first experimental setup is depicted in Figure 1. The reactor is a cylindrical quartz tube with an inner diameter of 30 mm, where the plasma is created by means of a confined
Figure 1. Experimental setup of a discharge plasma reactor.
cathode-anode system made of stainless steel. A complete
description of the confined cathode-anode system has been presented by Pavanati et al.16. Because the samples were placed in the middle of the cathode in floating potential, they were heated by radiation and the impingement of plasma species. The temperature of the sample was measured by a thermocouple crossing the crucible wall and located within the SA.
The temperature was controlled by means of a water-cooling system at the cathode. However, this system is turned on to limit the equilibrium temperature of the samples under plasma exposure to 40 °C or 60 °C. The time to reach the temperature of treatment is about 10 minutes.
2.1.1. Experimental conditions
The exposure time to the plasma (5 to 120 minutes), the temperature (40 or 60 °C) and the composition of the atmosphere (pure Ar or Ar-10% O2 plasma) were evaluated. To study the effect of hydrogen as an active species, a set of treatments in Ar-H2 was also performed at 5 to 120 minutes and 60 °C. The other parameters were constant: plasma power = 8.5 W; voltage = 500 V; current = 0.17 A; flow rate = 100 sccm; pressure = 3 Torr; pulsed DC bias frequency = 1.75 kHz; on period of the power supply (ton) = 70-90 µs; and off period of the power supply (toff) = 470 µs. Because the same current and voltages were employed in all treatments, the effect of different active species could be determined.
Elementary chemical analyses of the samples treated in the Ar-O2 plasma were performed via dynamic flash combustion using an elementary CHNS-O analyser, the EA 1110 model from CE Instruments. The oxygen concentration was estimated by determining the difference between the concentrations of carbon and hydrogen. Before and after each experiment, the samples were weighed using an analytical balance (±0.1 mg). The treatment process was characterised by the mass variation (MV) and the mass variation rate (MRV), the latter of which was obtained according to the following equation: MVR = ∆m/(A∆t), where A is the sample area (3.30 cm2), ∆m is the mass variation and ∆t is the time of exposure to the plasma.
2.2.
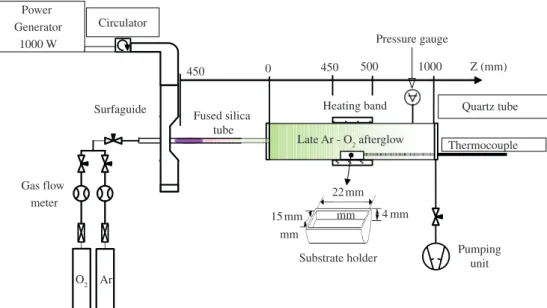
Second experimental setup
The second experimental setup is depicted in Figure 2, where the plasma is created in a cylindrical quartz tube (5 mm inner diameter) that is exposed to 2.45 GHz microwaves by means of a surfaguide wave launcher. The post-discharge enters a Pyrex tube (28 mm inner diameter) 450 mm downstream from the plasma gap. The distance from the discharge gap to the crucible is 900 mm, which ensures that there are no charged species from the plasma interfering with the study.
Once the experiment starts, a Teflon plate remains on the crucible until it is removed by applying an external magnet to the left of and far behind the sample. The removal of the plate occurs once the temperature is nearly constant, i.e., approximately 20 minutes after the plasma is turned on. The temperature of the crucible is controlled by a device positioned around the Pyrex tube that heats the crucible at a given temperature until the experiment starts. The
initial sample temperature is at 40 or 60 °C until the plate is removed. Next, the heating device is turned off, and the temperature evolves freely.
2.2.1. Experimental conditions
The treatments were evaluated with an exposure time to the Ar and Ar-10% O2 plasma of 5 to 120 minutes and an initial temperature of 40 or 60 °C. Additionally, experiments were conducted using Ar-10% H2 plasma with an exposure time of 5 to 120 minutes at 60 °C. The delivered microwave power was 150 W. The treatments were carried out at 3 torr and a flow rate of 1000 sccm. The crucible was the same utilised in the treatments with the DC discharge.
Similar to experimental setup 1, the temperature of the sample was measured by a thermocouple crossing the crucible wall and located within the SA. As the experiment started, the furnace was turned off, and the samples were only heated by the gas and by the energy deposited via surface reactions. In a previous publication11,12, we showed that the gas temperature is lower than the sample temperature by ~8 °C.
Elemental compositions of the treated SA, i.e., concentrations of H, C and O, were determined by the “Service Central D’Analyses” of the CNRS using chemical micro-analyses with coulometric–catharometric detections and infrared cells. The analyses were performed on pieces of samples that were cored through the entire depth of the crucible.
Before and after plasma treatments, each sample was weighed with an analytical balance (±0.1 mg), and the MV and MRV was evaluated.
3. Results and Discussion
As presented by Bernardelli et al.15, the MV is negligible in the absence of plasma; these experiments were conducted in a vacuum at 40 or 60 °C with a gas flow of Ar, O2 or H2. Thus, the modifications of the SA structure presented hereafter can be attributed to the plasma treatment.
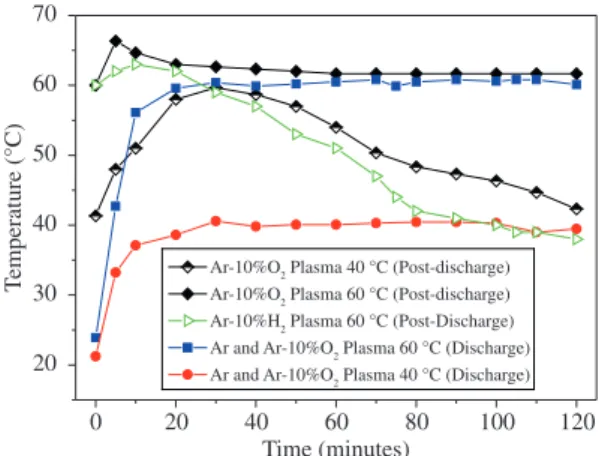
Figure 3 presents the temperature-time evolution of the treatments in both experimental setups. In the post-discharge group, there was no external temperature control;
Figure 3. Temporal evolution of the temperature due to treatment with Ar, Ar-H2 or Ar-O2 DC discharge and in Ar-10% O2 or Ar-H2
as a consequence, the temperature evolution was controlled by exothermic and endothermic reactions of the chemically active species with SA7,13.
The maximum temperature reached by the sample treated in post-discharge, which was initially 60 °C, was 66 °C after 5 minutes of exposure to the Ar-O2 post-discharge. After 30 minutes, the sample reached steady state at 60 °C. The treatments beginning at 40 °C increase until 60 °C after approximately 20 minutes and decrease until 120 minutes.
Understanding the physical transformations in Ar-O2 plasma is a good way to explain this behaviour. Treatments that began at 40 °C resulted in the formation of a small quantity of liquid, even though the sample was well below the melting temperature. As the treatment continued, the
chains were modified by the plasma, creating chains less reactive with the plasma lowering the sample’s temperature. However, the treatments that started at 60 °C maintained their temperature because the exothermic reactions were increased due to a thicker liquid phase. A complete discussion of these physical transformations is presented by Bernardelli et al.7.
A previous work with HTC11 showed similar phase transformations; however, the changes were not caused by gas heating, but by reactions between the samples within the post-discharge species. These reactions released a large amount of energy, which was sufficient to promote a significant heating of the gas12.
The reactivity was lower in the Ar-H2 afterglow region, being the samples heated no more than 4 °C, followed by a decrease in temperature for the rest of the treatment. These Ar-H2 afterglow samples were solid during the duration of the treatment. These behaviours showed that there was a higher reactivity of the O and O2 chemically active species with SA compared to the H and H2 chemically active species.
The temperature profiles of the discharge treatments (Figure 3) were as follows: a rapid increase in temperature to 40 °C or 60 °C during the beginning (~10 minutes) followed by a constant temperature for the remainder of the procedure (120 minutes). The steady temperature was due to the temperature control of the cooling system of the cathode (Figure 1); thus, the presented evolutions are representative for all treatments (Ar, Ar-O2 and Ar-H2).
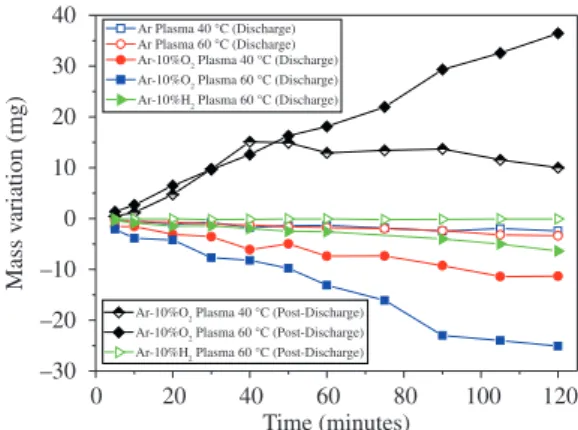
In Figure 4 are the results of the MV evolution for all studied treatments. In the post-discharge region, where only chemically active species were present, SA was preferentially grafted. In the discharge region, where chemically active species, charged species and photons were all present, SA was preferentially etched. In all treatments realised in the post-discharge region of the Ar-O2 plasma, the MV was positive. This mass gain is a result of the grafting of oxygen in the carbonaceous chain; this was the highest gain resulting from the treatment that was started at a temperature of 60 °C.
The treatments completed in the discharge region of the Ar-O2 plasma all resulted in a negative MV. These treatments yield to a significantly large MV than the treatments with pure argon. The MVR remained nearly constant for each treatment due to a continuous etching during the treatments, which results in a constant topmost surface composition and structure.
The pure Ar plasma treatments illuminate the role of charged species and photons. In this case, the charged species without the chemically active species do not efficiently etch the SA, showing that the energy transferred from the charged species and the radiation from the discharge, using an Ar plasma, is not enough to etch SA. As presented by Wertheimer17, H
2 plasma has an intense
radiation that interacts with carbon chains and degrades this. However, using the experimental set-up presented in Figure 1, when Ar-H2 was used the MV was very small (Figure 4). It shows that the radiation of the plasma is not sufficiently to etch the SA.
As presented in Figure 4, the treatments in the post-discharge of the Ar-O2 plasma facilitated the functionalisation of SA. A possible way to isolate the functionalisation effect is to perform the treatments with Ar-H2 plasma.
In the post-discharge (Ar-H2 plasma) treatments, no change in mass was observed, showing that hydrogen as the chemically active species is not sufficient to etch SA. However, when the treatments were realised in the Ar-H2 plasma discharge, a change in mass was observed. This result confirms that chemically active species, charged species and photons together are necessary to etch SA18,19.
The reactivity of the two active species are compared in the discharge region; O and O2 conduct a more efficient etch of SA compared to H and H2. This higher reactivity is a result of the formation of more volatile chains due to the O and O2 reaction with the radicals formed by ions, electrons and photons. This removal process superimposes a possible reticulation process and, consequently, oxygen grafting. This process can be observed in the elemental composition.
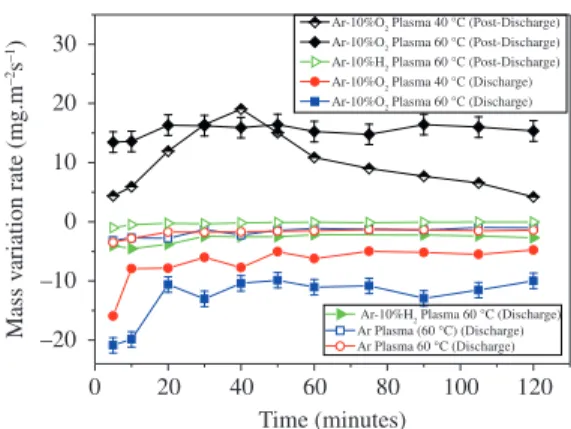
The MRVs of the samples are presented in Figure 5. The Ar, Ar-10% H2 post-discharge and Ar-10% H2 discharge treatments have a continuous MRV, showing that SA is etched at the same rate. If there is a modification of SA, this modification is not sufficient to change the MRV.
In the Ar-O2 discharge (40 and 60 °C) and Ar-O2 post-discharge (60 °C) treatments, SA is modified by the plasma after 20 minutes, resulting in a decrease of MRV. Subsequently, the SA is etched and grafted at the same rate. However, at 40 °C (post-discharge), following an increase in mass during the first 40 minutes, the MVR of the samples start to fall, and a distinctive evolution is observed.
Figure 4. Temporal evolution of the mass variation due to treatment with Ar, Ar-H2 or Ar-O2 DC discharge and in Ar-10% O2 or Ar-H2
Treatments that began at 40 °C resulted in the formation of a small quantity of liquid if compared to the treatments that began at 60 °C. It results in chains less reactive with the plasma, however the reactions occurring create volatile products. In this case MRV tends to become negative.
As shown in Figure 3, the temperatures of the samples treated at 60 °C (post-discharge and discharge) are approximately the same. An explanation for this finding was presented by Bernardelli et al.13, who showed that the thickness of the modified SA is higher for the samples started at 60 °C than for the samples started at 40 °C. In the first case, the quantity of SA that reacts with the chemically active species is sufficient to maintain the temperature of the sample until the end of the treatment.
In Figure 6, the chemical compositional evolution of the samples is presented. The afterglow treatments result in more intense changes in the composition of the samples, which is in agreement with the previous assumption, where at higher temperatures, the etch is superposed by a deeper introduction of oxygen. It can also explain the higher mass gain in the Ar-O2 post-discharge treatments at 60 °C. The functionalisation processes by oxygen occurs in a sub-layer, leading to a more functionalised bulk7,13; this process is also expected to occur in the Ar-O2 discharge.
Bernardelli et al.7,13 showed using XPS that the acid functional group is not attached in the presence of chemically active species (post-discharge treatments). In this case, the acid function is eliminated after successive fragmentation by C–C scission. However, with the presence of charged species and photons, the acid function is attached preferentially, as observed in the chemical composition where the oxygen concentration decreases at the beginning of the treatments15.
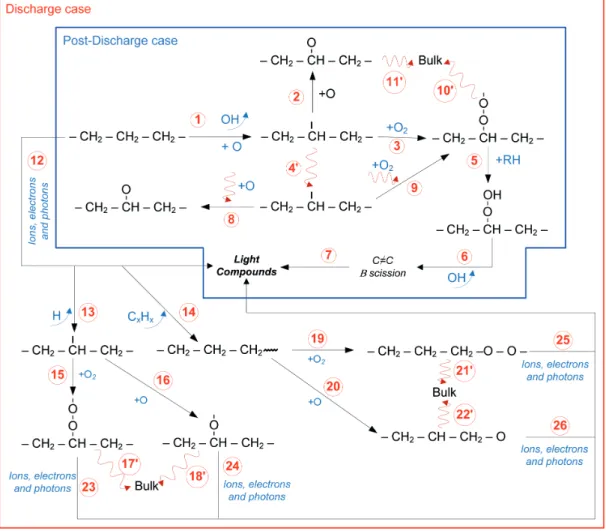
Although the reactions undergone by the alkane chain are rather complicated and numerous, a short description of the main processes leading to the scission of C–C bonds is possible. Figure 7 shows the proposed degradation mechanisms of SA. The first mechanism describes the experiments realised in the post-discharge region; the second mechanism occurs in the discharge region.
In the post-discharge region, the chains of SA are attacked by an oxygen atom creating an alkyl radical (reaction 1). This radical can follow three paths. The first path is a reaction (reaction 2) with an O atom to form an
alkoxy radical. In the second path, there is a reaction with O2 to create peroxide radical (reaction 3). The peroxide radical can react with other SA chains to former a hydroperoxide (reaction 5). Following the release of OH, β scissions of the chains occur to create light compounds.
The alkyl (diffusion 4’), peroxide (diffusion 10’), and alkoxy (diffusion 11’) radicals can diffuse to the bulk of the samples. When alkoxy and peroxide radicals diffuse to the bulk, the samples are likely functionalised. The diffusion of the alkyl radical can be accompanied by the diffusion of oxygen that, via reactions 8 and 9, can form alkoxy and peroxide radicals. These radicals can functionalise SA or form light compounds. Because the samples gained mass in the Ar-O2 post-discharge region, it can be concluded that the diffusion of the functionalised compounds and oxygen are greater than the diffusion in reactions that create light compounds.
The same reactions presented above are expected to occur in the Ar-O2 discharge. However, the electrons, ions and photons can also react with the SA chains (reactions 12, 23, 24, 25 and 26) to give light compounds. Reactions 23-26 occur after a reaction with oxygen (O2 or O in all states). These reactions efficiently form light compounds, even though the bonds broken by electrons, ions and photons are re-established and the branching chains of SA re-occur. These reactions can explain the low MV presented by the Ar-only treatments, where, without the oxygen active species, the bonds broken by charged species and photons can be re-established or diffuse to former ramified chains20. As demonstrated by Vidaurre et al.20, it is possible that, via a higher plasma source power, the molecules carbon chains can be etched efficiently with Ar plasma. However, this possibility is not investigated in this study.
In the Ar-H2 DC discharge treatments, the reactions that occur are presented in Figure 8. The long chain of SA is etched by the charged species and photons (reaction 1) to form light compounds or radicals. The radicals can react with hydrogen (reaction 2 and 3) to close the chains. Next, the etch produced by charged species and photons (reaction 6) forms light compounds. These reactions do not occur efficiently, resulting in a lower loss of mass (Figure 4). The radicals formed can react with other radicals on the surface or they can diffuse to the bulk and react there; it is the mean reactions that result in the branching of the carbon chains.
Figure 5. Mass variation rate (MRV) of the samples treated in Ar, Ar-10% O2 or Ar-10% H2 discharge and post-discharge.
4. Conclusions
Experiments were conducted to understand the influence of a chemically active species, charged species and photons on the degradation of SA. The results show that ions,
electrons and photons are insufficient to etch efficiently the SA. However, when only chemically active species are present, the nature of the species (oxygen or hydrogen species) becomes very important. The active species can promote intense grafting of SA (oxygen) or leave SA unchanged (hydrogen). Finally, when active oxygen species are present in addition to radiation and the charged species, a highest etching rates are observed. It can be concluded that the interaction of the charged species with a chemically active species is necessary to efficiently etch SA.
Acknowledgements
The authors would like to thank the CNPq and the CAPES/COFECUB, a joint Brazilian/French project (Ph 697/10), for financial support.
Figure 7. The mean reactions occurring in SA during treatments in Ar-O2 plasma, both post-discharge and discharge.
References
1. Cohen A, Boas M and Rosen A. The influence of ion nitriding parameters on the hardness layer of 15-5 PH stainless steel. Thin Solid Films. 1986; 141:53-58. http://dx.doi. org/10.1016/0040-6090(86)90318-4
2. Ames D and Chelli SJ. Surface contamination effects on
film adhesion on metals and organic polymers. Surface and Coatings Technology. 2004; 187:199-207. http://dx.doi. org/10.1016/j.surfcoat.2004.03.027
3. Berkel RV. Overview of the cleaner production concept and relation with other environmental management strategies. Cleaner Production for Process Industries. Available from: <http://cleanerproduction.curtin.edu.au>. Access in: 15/09/2009.
4. Hody V, Belmonte T, Czerwiec T, Henrion G and Thiebaut JM. Oxygen grafting and etching of hexatriacontane in late N2–O2
post-discharges. Thin Solid Films. 2006; 5506-507:212-216. http://dx.doi.org/10.1016/j.tsf.2005.08.016
5. Murillo R, Poncin-Epaillard F and Segui Y. Plasma etching of organic material: Combined effects of charged and neutral species. The European Physical Journal Applied Physics. 2007; 37:299-305. http://dx.doi.org/10.1051/ epjap:2007031
6. Mafra M, Belmonte T, Poncin-Epaillard F, Maliska A and Cvelbar U. Treatment of hexatriacontane by Ar–O2 Remote Plasma: Formation of the active species. Plasma Processes and Polymers. 2009; 6:S198-S203. http://dx.doi.org/10.1002/ ppap.200932406
7. Bernardelli EA, Belmonte T, Frache G, Poncin-Epaillard F, Noel C, Choquet P et al. Interaction mechanisms between Ar–O2 post-discharge and stearic acid I: behaviour of thin films.
Plasma Chemistry and Plasma Process. 2011; 31:189-203. http://dx.doi.org/10.1007/s11090-010-9263-2
8. Bernardelli EA, Souza T, Maliska AM, Belmonte T and Mafra M. Plasma etching of stearic acid in Ar and Ar–O2 DC
discharges. Materials Science Forum. 2010; 660-661:599-604. http://dx.doi.org/10.4028/www.scientific.net/MSF.660-661.599
9. Lefèvre L, Belmonte T, Czerwiec T, Ricard A and Michel H. Study of late argon-nitrogen post-discharge interactions with oxidized iron surface. Applied Surface and Science. 2000; 153(2-3):85-95. http://dx.doi.org/10.1016/ S0169-4332(99)00358-X
10. Noel C, Duday D, Verdier S, Choquet P, Belmonte T and Migeon H-N. Interaction of stearic acid deposited on silicon samples with Ar/N2 and Ar/O2 atmospheric pressure microwave post-discharges. Plasma Processes Polymers. 2009; 6:S187-S192. http://dx.doi.org/10.1002/ppap.200930506
11. Mafra M, Belmonte T, Poncin-Epaillard F, Silva Sobrinho AS and Maliska AM. Role of the temperature on the interaction mechanisms between argon-oxygen post-discharge and hexatriacontane. Plasma Chemistry and Plasma Processing. 2008; 28:495-509. http://dx.doi.org/10.1007/ s11090-008-9140-4
12. Mafra M, Belmonte T, Maliska A, Silva Sobrinho AS, Cvelbar U and Poncin-Epaillard F. Argon-oxygen post-discharge treatment of hexatriacontane: heat transfer between gas phase and sample. Key Engineering Materials. 2008; 373-374:421-425. http://dx.doi.org/10.4028/www.scientific.net/ KEM.373-374.421
13. Bernardelli EA, Belmonte T, Frache G, Poncin-Epaillard F, Noel C, Choquet P et al. Interaction mechanisms between Ar–O2 post-discharge and stearic acid II: behaviour of thick films. Plasma Chemistry and Plasma Process. 2011; 31:205-215. http://dx.doi.org/10.1007/s11090-010-9264-1
14. Bernardelli EA, Souza T, Maliska AM, Belmonte T and Mafra M. Plasma etching of stearic acid in Ar-O2 discharge.
In: Proceedings of the 7th International Latin American Conference on Powder Technology – PTECH; 2009, São Paulo. São Paulo; 2009.
15. Bernardelli EA, Souza T, Maliska AM, Mafra M, Belmonte T and Klein AN. Modification of stearic acid in Ar and Ar-O2
pulsed DC discharge. Materials Research. 2011; 14(4):519-523. http://dx.doi.org/10.1590/S1516-14392011005000068
16. Pavanati HC, Maliska AM, Klein AN and Muzart JLR. Comparative study of porosity and pores morphology of unalloyed iron sintered in furnace and plasma reactor. Materials Research. 2007; 10:87-93. http://dx.doi.org/10.1590/S1516-14392007000100019
17. Wertheimer MR, Fozza AC and Hollander A. Industrial processing of polymers by low-pressure plasmas: the role of VUV radiation. Nuclear Instruments and Methods in Physics Research B. 1999; 151:65-75. http://dx.doi.org/10.1016/S0168-583X(99)00073-7
18. Silveira W, Wendhausen PAP and Klein AN. Study of the debinding rate on mim parts using plasma assisted debinding.
Materials Science Forum. 2008; 591-593:229-234. http:// dx.doi.org/10.4028/www.scientific.net/MSF.591-593.229
19. Mozetic M. Discharge cleaning with hydrogen plasma.
Vacuum. 2001; 61:367-371. http://dx.doi.org/10.1016/S0042-207X(01)00146-4