1 Programa de Pós-Graduação em Engenharia Florestal, Fundação Universidade Regional de Blumenau, Rua São Paulo, 3250, Itoupava Seca,
89010-971, Blumenau, SC, Brazil
2 Centro de Ciências Tecnológicas, Departamento de Engenharia Florestal, Fundação Universidade Regional de Blumenau, Rua São Paulo, 3250,
Itoupava Seca, 89010-971, Blumenau, SC, Brazil
3 Faculdade de Ciências Biológicas e Agrárias, Universidade do Estado de Mato Grosso, Avenida Perimetral Rogério Silva, 4930, Jardim Flamboyant,
78580-000, Alta Floresta, MT, Brazil
* Corresponding author: [email protected]
More than environmental control at local scales: do spatial
processes play an important role in fl oristic variation in
subtropical forests?
João Paulo de Maçaneiro1, Laio Zimermann Oliveira1, Rafaela Cristina Seubert2, Pedro V. Eisenlohr3* and Lauri Amândio Schorn2
Received: November 6, 2015 Accepted: February 29, 2016
ABSTRACT
Th e eff ect of environmental variables on the plant species distribution in the Atlantic Forest raises the interest of researchers, but few studies, mainly at local scales, analyzed the infl uence of spatial factors on the environment and species distribution. Linear models and spatial correlograms were used to evaluate whether environment and space may predict variations in species composition of trees and shrubs in a Subtropical Rainforest remnant. Th e study area was divided in 25 plots of 400 m², systematically distributed, where individuals with DBH ≥ 5 cm were measured. Elevation and slope were the most important predictors of the fl oristic variations, but space, generally neglected in researches on South American’s vegetation, had a relevant infl uence, as a structural component, in terms of environmental variables, and as intrinsic biological component, here probably as result of constraints in species dispersion. Although the origin of great part of the variation in species composition remained unknown, which is common in studies on vegetation, results indicated, for the fi rst time, the complex role of spatial and environmental variables in the composition of trees and shrub species in a Subtropical Rainforest of Brazil.
Keywords: Atlantic Forest, environmental gradient, linear models, species distribution, variance partitioning
Introduction
Studies analyzing the eff ects of environmental factors on community composition patterns may provide evidence on the ecological preferences of these species in diff erent abiotic conditions (Peña-Claros et al. 2012; Sanchez et al. 2013; Th uiller 2013). Environment heterogeneity is one of the main factors infl uencing species composition in tropical forests. Its eff ects may be related to edaphic factors, light and water availability, and topographic characteristics (Jones
et al. 2011; Penã-Claros et al. 2012; Baldeck et al. 2013; Eisenlohr et al. 2013; Oliveira-Filho et al. 2013; Sanchez et
al. 2013; Th uiller 2013). Topography and physicochemical soil properties have been recognized as crucial drivers of vegetation mainly at local scales (e.g., O’Brien et al. 2000;
Bohlman et al. 2008; Machado et al. 2008; Souza et al. 2012; Toledo et al. 2012; Mélo et al. 2013). Topography, for example, plays a fundamental role in the description of variations in the composition of vegetation, mainly because a variation in topography may cause alterations in the physical and chemical properties of soils (John et al. 2007; Baldeck et al. 2013; Mélo et al. 2013).
João Paulo de Maçaneiro, Laio Zimermann Oliveira, Rafaela Cristina Seubert, Pedro V. Eisenlohr and Lauri Amândio Schorn
indicators of species distribution along gradients (e.g., Gentry 1988; Toledo et al. 2012), a more recent ecological approach takes into account both the spatial structure of plant communities and environmental factors, especially the influence of spatial structure on variations in species composition (Lichstein et al. 2002; Legendre et al. 2009; Eisenlohr et al. 2013; Gasper et al. 2013; Mélo et al. 2013; Oliveira-Filho et al. 2013; Lewis et al. 2014). Spatial structure may be caused by contagious ecological processes such as dispersion (Legendre 1993; Cottenie 2005), but environmental factors may also have spatially structured fractions in space, because neighbor sites tend to present similar environmental characteristics (Fortin & Dale 2005). When the spatial structure of plant communities is analyzed, ecological variables such as dispersion and competition mechanisms arise as important drivers of species distribution (Cottenie 2005; Diniz-Filho et al. 2012; Baldeck et al. 2013). When spatial structure is disregarded, incorrect statements may be made on species composition patterns related to environment (Legendre & Legendre 2012). Furthermore, if space is disregarded, interpretation of numerical analyses of ecological studies may be biased and compromise the reliability of statistical tests (Peres-Neto 2006; Diniz-Filho et al. 2007; Dale & Fortin 2009). In addition, it is particularly interesting to investigate which part of variation in species composition is explained by fractions corresponding to environment, to spatially structured environment, and only to space (Peres-Neto 2006; Peres-Neto & Legendre 2010).
In recent years, the Atlantic Forest, one of the world’s 35 hotspots for conservation of biodiversity (Ribeiro et al. 2011), has been the object of many studies aimed at verifying the effect of environmental variables on vegetation distribution patterns along environmental gradients (Budke
et al. 2007; Ferreira-Júnior et al. 2007; Rodrigues et al. 2007; Silva et al. 2009; Gonçalves et al. 2011; Souza et al. 2012; Higuchi et al. 2013; Marcuzzo et al. 2013; Mélo et al. 2013). However, few studies have analyzed the influence of spatial components on the environment and distribution of vegetation (Machado et al. 2008; Mélo et al. 2013). Studies that address such influence would be appropriate, because they could improve the predictive power of ecological modeling, thereby providing a more complete assessment of the drivers of floristic variation, and because they could be useful to inspire further large-scale studies with more generalization power.
The present study assessed whether environment and space may consistently predict variation in the composition patterns of tree and shrub species in a subtropical Atlantic rainforest remnant in order to answer the following questions: (i) Are there environmental factors influencing tree and shrub species composition patterns? We expected to find a great effect of soil and terrain topography in determining floristic and structure composition, because they are very well known as the main factors conditioning changes in the composition of vegetation in the Atlantic
Rainforest at local scales. (ii) Does the spatial component have an influence on the composition patterns of tree and shrub species together with the environment? We expected to find a significant effect of space, because recent studies have indicated that inclusion of the spatial component in the analysis of vegetation patterns helps in the identification of potentially important processes. Thus, the spatial component may be important to determine the distribution of species along environmental gradients.
Materials and methods
Study area
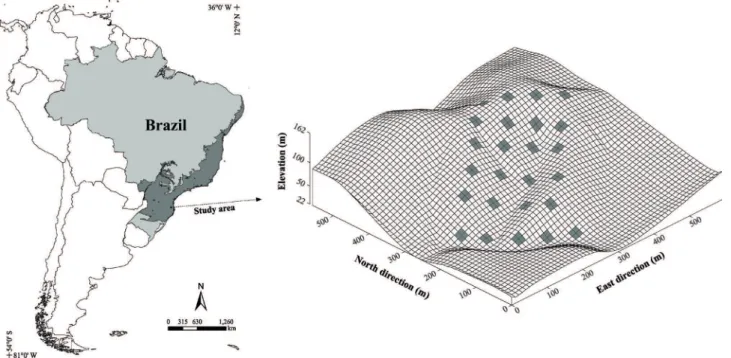
The study area is within the catchment area of the Itajaí River in Brusque, SC. It belongs to the RPPN Chácara Edith, which has a total area of 415.8 ha and an altitude ranging from 20 to 300 m asl, and it is located between 27º05’ and 27º06’ S and 48º51’ and 48º54’ W (Fig. 1).
The predominant vegetation in the study area consists of Submontane Subtropical Evergreen Broadleaf Rainforest (sensu Oliveira-Filho 2015), hereinafter referred to as subtropical rainforest, being located in the Atlantic Forest Domain. In 1923, the former owner of the reserve began logging in the study area; this activity continued until the 1930s. The logging was focused on blackleg (Ocotea catharinensis Mez) and other species of economic interest (Hoffmann et al. 2002). The reserve was explored during the beginning of the 1900s, but the vegetation has gone about 80 years without any anthropogenic action (Maçaneiro et al. 2015).
The climate of the city of Brusque, according to the Köppen classification, is Cfa – a humid mesothermal subtropical climate with hot summers (Alvares et al. 2014). The annual average temperature varies between 19 and 20° C, with monthly averages ranging from 15° C in the coldest month (July) to 25° C in the warmest months (January and February). The annual relative humidity ranges between 84 and 86%, with monthly averages between 80% in the driest month (December) and 88% in the wettest months (June and July) (Pandolfo et al. 2002). The data collected by the Brusque Station of the National Water Agency (27°06’02.16”S, 48°55’04.08”W, 25 m asl), 2.8 km away from the study area, register a total annual rainfall ranging from 460 to 3,004 mm, with an average of 1,568 mm, from 1941 to 2013.
Figure 1. Location and surface grid showing the topography of the area studied in the RPPN Chácara Edith, Brusque, Santa Catarina, with the distribution of 25 plots of 20 x 20 m used to sample the vegetation.
In the study area, an association between two soil types predominates: moderate A Tb Haplic Cambisol in undulating relief of moderately argillaceous texture and moderate A dystrophic Litholic Neosol in strongly undulating mountainous relief of moderately argillaceous texture (EMBRAPA 2013).
Data collection
To collect data, we used plots arranged in groups (Soares
et al. 2012) with the aim of representing the largest possible
variation of vegetation along the slope analyzed. We placed the plots along five transects, running from the base to the top of the slope. In total, we systematically distributed 25 plots of 20 x 20 m (400 m²), totaling a sampling area of 10,000 m². These plots were approximately 50 m apart, and there was a distance of 25 m between tracks. In each plot, we sampled all individuals, living trees, and shrubs with DBH (diameter at breast height) ≥ 5 cm.
We identified the collected botanical material by comparing it with digital photos from sites belonging to Flora Digital (http://ufrgs.br/floradigital) and Virtual Herbarium (http://reflora.jbrj.gov.br), with dried plant specimens deposited at the Dr Roberto Miguel Klein Herbarium of the Regional University of Blumenau (FURB), and also in consultation with taxonomic literature and FURB experts. We sent duplicates of species of the Lauraceae and Myrtaceae families to specialists.
Two composed samples of superficial soil (0–20 cm depth), weighing around 500 g each, were collected in each plot of the experimental area, according to the
recommendations of Santos et al. (2013). Each composed sample was made of various subsamples collected in each plot. Samples were stored and identified in plastic bags and were sent to the Laboratory of Soil Analysis of the Universidade do Estado de Santa Catarina (UDESC/Lages) to identify the following chemical variables: pH-H2O, SMP index, calcium (Ca), magnesium (Mg) and aluminum (Al) contents, potential acidity (H + Al), effective cationic exchange capacity (CEC), Al saturation, bases saturation, organic matter (OM), clay content, phosphorus (P), sodium (Na), potassium (K), and (CEC). The physical characteristics analyzed were granulometry, with proportions of silt, sand, and clay. The drainage class of soil was evaluated for each plot, according to EMBRAPA (2013). We measured slope in degrees and the gradient of each plot with a Bosch GLM 80 laser distance meter.
Modeling species composition with spatial and
environmental variables
The influence of spatial and environmental variables on the composition of tree and shrub species was analyzed by transformation-based redundancy analyses (tb-RDA; Borcard et al.2011). In the present case, we used the Hellinger transformation (see below). We chose the tb-RDA technique because it is a composition of linear models and does not use chi-squared distance, avoiding biases caused by other multivariate techniques of direct analysis of gradients, like CCA (Legendre & Gallagher 2001; Borcard
João Paulo de Maçaneiro, Laio Zimermann Oliveira, Rafaela Cristina Seubert, Pedro V. Eisenlohr and Lauri Amândio Schorn
to identify and remove collinear environmental variables, a principal components analysis (PCA) was performed in the PC-ORD 6.0 (McCune & Mefford 2011). After this procedure, environmental variables that remained in the analysis were slope, elevation, pH-H2O, sand and clay contents, Ca, Mg, OM, K, P, Al saturation, and bases saturation. In the matrix of presence and absence of species, the species with low frequency in plots were removed from the analysis, because they give low contribution to the community structure and may hinder the analysis of data (Causton 1988). In the present study, low-frequency species were considered the ones appearing only in up to four plots, because when the preliminary tb-RDA was performed, these species did not show a strong relation with the studied environmental variables. After this procedure, the Hellinger transformation was applied to the matrix of species occurrence, with the objective of avoiding biases caused by the Euclidean distances in RDA (Legendre & Gallagher 2001). Standard Score transformation was applied to the environmental variables, with the objective to correct differences in scale (Zar 2010). The geographical coordinates (latitude and longitude) of each plot were used to create spatial variables named MEMs (Moran’s Eigenvector Maps), allowing a better understanding of the role of space in different scales (Dray
et al. 2006).
During this step, we used the software “spacemakeR” in R environment (R Core Team 2013), according to the recommendation of Borcard et al. (2011), and MEMs were created by a connectivity matrix obtained through a Delunay triangulation (Borcard et al. 2011). Eighteen MEMs were created, considered as predictors of the species composition in a model generated by a tb-RDA, which regressed the MEMs on the matrix of species. Selection of significant MEMs for the model was obtained by the “forward” method (Blanchet
et al. 2008). Next, we selected the predictive environmental variables by means of another tb-RDA. Finally, the last tb-RDA was processed in PC-ORD 6.0 (McCune & Mefford 2011) using species matrixes (Hellinger-transformed), with the selected environmental (standardized) and spatial (MEMs) variables, in order to investigate the effect of these variables on the species composition along the analyzed environmental gradient. This tb-RDA will henceforth be referred to as “final tb-RDA.”
We observed an “arch effect” in the graph of the first two axes of the final tb-RDA. Despite some criticisms, we agree with Vieira et al. (2015), for whom “arch-like curvature is an important, inherent property of successive-replacement data, which must be considered in any discussion or analysis (…).” Although we decided to maintain the tb-RDA, this requires caution with respect to the association of explanatory variables to plots in a linear framework in case such an association would be performed for each axis individually. As Hill & Gauch (1980) argue, “for the axes to be separately interpretable, they need to be independent, not merely uncorrelated.” Thus, in addition to the above-mentioned caution, we calculated the contribution of each
explanatory variable to the whole final tb-RDA rather than restrict our analysis to a subset of axes. This was done by means of partial tb-RDAs followed by permutation-based ANOVA.
The presence of spatial autocorrelations was verified by Mantel and Moran correlograms (Fortin & Dale 2005) using PASSaGE 2.0 (Rosenberg & Anderson 2011). We obtained the correlograms to provide additional information on the spatial effect on plant communities, thus unveiling, for example, at which distance the spatial autocorrelation disappears. The variables used for preparing Mantel correlograms were the occurrence of the 20 and 10 most frequent species as a whole. The variables used for preparing Moran correlograms were species richness and the occurrence of each of the 10 most frequent species, separately.
Variance partitioning
Having the previously selected spatial and environmental variables at our disposal, we performed the variance partitioning to know how “pure” environment [a], spatially structured environment [b], “pure” space [c], and undetermined variables [d] could explain variations in the species composition of our database. We evaluated whether fraction [a] influenced species composition, thus controlling type I error caused by fraction [b] (Neto 2006; Peres-Neto & Legendre 2010). In this step, we ran a permutation-based ANOVA to test the significance of fractions [a] and [c] (Legendre & Legendre 2012). The R-codes used followed Eisenlohr (2014).
Results
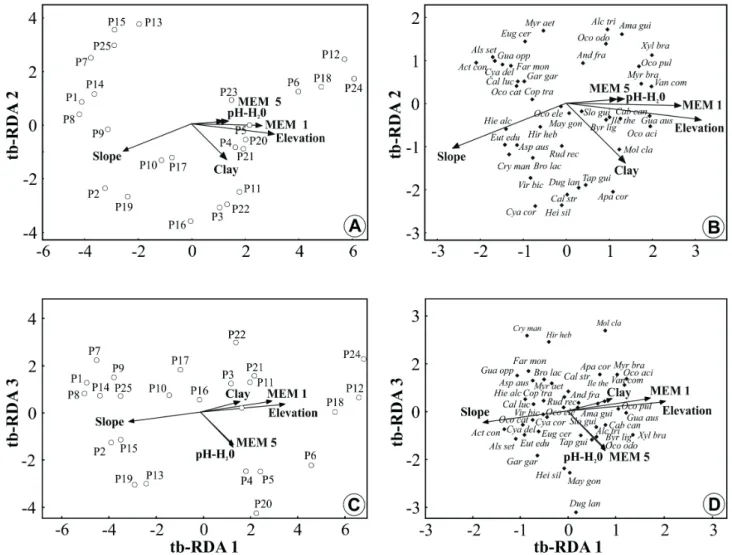
Eigenvalues of the first three tb-RDA axes explained 32.6% of the variance (axis 1= 20.3%; axis 2 = 7%; axis 3 = 5.3%) and appeared highly significant (Monte Carlo, P < 0.001). Environmental and spatial variables that showed the highest correlations with axis 1 were elevation, slope, clay content, and MEM 1 (spatial variable); the variables most correlated with axis 2 were slope and clay content, and those most correlated with axis 3 were pH-H2O and MEM 5 (Fig. 2, Tab. 1).
Figure 2. Diagrams produced by transformation-based redundancy analysis (tb-RDA) to plots (a, c) and species (b, d), based on the presence and absence of 42 species in 25 plots sampled in a subtropical rainforest in southern Brazil.
Table 1. Contribution of each predictor to the overall floristic patterns yielded by the final tb-RDA. R² adjusted, F and p were obtained after partitioning analysis. Significant results are in bold.
Predictor R² adjusted F (ANOVA) P (ANOVA)
Slope 4.41% 2.0985 0.013
Elevation 3.51% 1.8738 0.015
MEM 5 2.93% 1.7297 0.022
Clay 2.30% 1.5730 0.037
pH 2.16% 1.5375 0.041
MEM 1 0.53% 1.1314 0.306
soil are strongly related to plots located in the middle of the slope. Plots located at the base of the hillside showed smaller clay content in soil. The first and third axes of the final tb-RDA (Fig. 2C) indicated that some plots located in the middle of the slope presented high pH-H2O values in soil and were related to MEM 5. Furthermore, this relation was inversely correlated with plots located in the base of the hillside, whose pH-H2O values were the smallest.
João Paulo de Maçaneiro, Laio Zimermann Oliveira, Rafaela Cristina Seubert, Pedro V. Eisenlohr and Lauri Amândio Schorn
variable, MEM 1, was not significant (Tab. 1).
In the diagram of species ordination (Fig. 2B, D), the three first axes revealed a strong association between spatial and environmental variables with the species composition. We verified some segregation patterns between species and plots in the final tb-RDA, probably related to the topographic position in the hillside. The first group of species was associated with plots belonging to less elevated plots with a higher slope (e.g., Actinostemum concolor, Alsophila setosa, Calyptranthes lucida, Cyathea delgadii, and Euterpe edulis), with this environment defined as the base of the hillside. Additionally, a group of species was verified as strongly associated with the high-elevation and low-slope plots (e.g., Amaioua guianensis, Aparisthmium cordatum,
Guappira opposita, Myrcia brasiliensis, Ocotea acyphilla, Ocotea pulchra, and Xylopia brasiliensis), in other words, to the top-of-the-slope environment. On the other hand, some species did not show evident association with elevation or slope (e.g., Andira fraxinifolia, Brosimum lactescens, Byrsonima ligustrifolia, Copaifera trapezifolia, Cyathea corcovadensis,
Maytenus gonoclada, Ocotea elegans, and Sloanea guianensis), because they presented uniform distribution along the entire analyzed environmental gradient. Besides, MEM patterns in the ordination diagrams coincide with the environmental variables elevation and pH-H2O, indicating that the spatial component has an influence on both species distribution and the environment.
Correlograms indicated that, when considered as a whole, species occurrence presented strong spatial autocorrelation, which disappeared only at larger distances (Fig. 3; see correlograms for the 20 and 10 most frequent species). However, species richness was much less structured at space, and the same was verified for most of the species occurrence, individually (Fig. 3). Thus, the spatial autocorrelation stood out only at the multivariate level.
Partitioning of variance indicated that fractions [a] “pure” environment (F = 1.906; P = 0.005) and [c] “pure”
space (F = 1.436; P = 0.03) were significant (Fig. 4). The “pure” environment stood out among fractions, but fraction [d] indicated that most of the floristic variance (76%) remained unexplained (Fig. 3), indicating the existence of other predictive factors that were not evaluated in this study.
Discussion
Our results show that only a few of the studied environmental variables have an influence on the distribution patterns of tree and shrub species in a gradient of the subtropical rainforest in southern Brazil. They also show that space, which is generally neglected in investigations on meridional South American vegetation, plays a relevant role, even if smaller than environmental variables. This smaller contribution of space to species composition could be due to the typical lowest proportion of wind-dispersed species in tropical rainforests (e.g., Howe & Smallwood
1982); thus, it is possible that in more open physiognomies, such as savannas or dry forests, this contribution would be higher. Nevertheless, if we consider the influence of space shared with environmental variables (fraction [b]), the role of spatial components reaches almost half of the known drivers of floristic variation.
Considering the environmental influence on species distribution, differences between the analyzed species composition are mainly related to variations in the elevation
and slope of the hillside, which were the most important environmental variables segregating plots and species in the analyzed hillside. Studies on environmental gradients performed on local scales have demonstrated that the distribution of vegetation is more strongly associated with topography and soil (Souza et al. 2003; Rodrigues et al. 2007; Souza et al. 2012; Guerra et al. 2013). Ferreira-Júnior et al. (2012) mentioned that changes in topography provide alterations in the physical and chemical properties of soil, which may influence the distribution patterns of vegetation. However, significant relations between variables associated with chemical and physical properties of soil with variations of vegetation along the analyzed gradient were not verified. The proposition of Klein (1980) was confirmed, verifying that, along the hillside in the region of Vale de Itajaí in Santa Catarina, it was possible to observe a clear differentiation in the composition of vegetation. According to that author, this observation was more evident when the slope was higher. This pattern is probably related to variations in topography, which, in turn, may reflect the high environmental heterogeneity observed in the subtropical rainforest of Southern Brazil (Klein 1980, 1984; Leite 2002; Oliveira-Filho et al. 2013).
Elevation is an environmental variable that indirectly influences a series of other environmental factors intimately related to the distribution patterns of vegetation in the Atlantic Forest (Oliveira-Filho & Fontes 2000; Meireles et al. 2008; Eisenlohr et al. 2013; Oliveira-Filho et al. 2013; Sanchez et al. 2013). In this study, elevation was one of the greatest predictors of the composition of vegetation. In a similar way, Gasper et al. (2013), analyzing distribution patterns of fern species in Santa Catarina, found a significant correlation between elevation and these patterns. These authors verified that variation in elevation conditioned changes in the climatic variables and that these variables related to the distribution patterns of fern species. The
strong relation between elevation and distribution of vegetation is probably related to the topographic position along the hillside. In the base of the hillside, soil conditions and topography, such as microclimatic properties, are different when compared to the middle and top of the slope (Veloso & Klein 1959; Klein 1980, 1984; Ferreira-Júnior
et al. 2007; Jones et al. 2011; Ferreira-Júnior et al. 2012;
Marangon et al. 2013).
Floristic differences in the function of the topographic position in the slope highlight the influence of environmental factors on the distribution of species in the studied area. Plots belonging to less elevated positions of the slope and with a greater slope presented a very characteristic set of species. Similarly, we verified associations of species in plots located in higher positions and with a smaller slope. In the subtropical rainforest of the Vale do Itajaí, SC, these floristic patterns were also observed by Klein (1980; 1984). This author concluded that, in the base of the slopes of the region, groups of species highly adapted to soil conditions and topography characterized the vegetation, and that it was possible to meet different floristic associations while moving to the top of the hillsides. Differences between these floristic associations in the function of topographic conditions are possibly related to variations in elevation and soil topography, which could play an important role in the physical and chemical properties of soil and, consequently, in species distribution (e.g., Ferreira-Júnior et al. 2007; 2012).
Abiotic factors, together with dispersion and biotic interactions, are often suggested to explain species distribution (Boulangeat et al. 2012). Thus, besides
environmental factors, another variable set that can have ecological importance in the distribution patterns of species in environmental gradients of an Atlantic rainforest is space (Eisenlohr et al. 2013; Gasper et al. 2013; Mélo et al. 2013; Oliveira-Filho et al. 2013). In the present study, the heterogeneity of the environment (here represented by edaphic and topographic variations) was not the only process explaining variations in the species composition. The spatial component, for example, revealed a significant fraction of influence on the floristic patterns, indicating that variations in the species composition may be due to biotic and stochastic processes (Hubbell 2001; Diniz-Filho
et al. 2012; Peña-Claros et al. 2012). A fraction related to spatially structured environment (R2 = 8%) may also be
used to justify the distance–decay floristic similarity (Diniz-Filho et al. 2012). Legendre et al. (2009) and Diniz-Filho et al. (2012) suggest that a spatially structured environment has an influence on the spatial distribution of species, because as distance between environments increases, the higher their difference in terms of species composition. In smaller spatial scales, a spatially structured environment may favor limitations in the dispersion of species, and neighboring environments tend to be similar (Karst et al.
2005). This fact is very clear in the studied hillside, because the strongest predictive variables (elevation and slope) were spatially structured along the gradient, as also observed by
João Paulo de Maçaneiro, Laio Zimermann Oliveira, Rafaela Cristina Seubert, Pedro V. Eisenlohr and Lauri Amândio Schorn
Legendre et al. (2009).
Our results also demonstrated that spatial structures could be more sophisticated than a mere analysis of synthetic variables (e.g., species richness) would suggest. In fact, the spatial structure became clearer when the species occurrence was considered in a multivariate framework, i.e., by means of Mantel correlograms. Because species often co-occur in a non-random way — the observed co-occurrence in most natural communities is usually less than expected by chance (Gotelli & McCabe 2002) — a more complete view of the community behavior along gradients requires deeper analysis. This interpretation also agrees with the fact that the variable MEM 1 (coarser scale) was not significant in the overall tb-RDA, but MEM 5 (finer scale) was significant.
Furthermore, Lewis et al. (2014) pointed out that biotic processes like dispersion, facilitation, and competition between species may be attributed to the spatial component. Different species have different dispersion mechanisms that may provide different spatial distribution patterns, which were confirmed by the individual Moran correlograms found in this study. Dispersion by animals, for example, provides greater spatial heterogeneity, which may end in accumulation of seeds in preferred locations or in paths preferred by animals (Schupp et al. 2002). On the other hand, dispersion by wind provides a more uniform distribution pattern in terms of seed dispersion. Furthermore, the density of individuals of one species also has an influence on the spatial distribution pattern and, consequently, on recruiting and mortality rates of individuals (Crawley 1986).
We found a very high percentage of unexplained variation (76%). This result is common in studies considering spatial and environmental variables as predictive of the distribution of species (Souza et al. 2003; Machado et al. 2008; Jones et al. 2011; Peña-Claros et al. 2012; Baldeck et al. 2013; Gasper et al. 2013). It suggests that some variables that were not considered in the model would probably increase the explanation of variation patterns in the vegetation of the studied area. Our results agree with Baldeck et al. (2013) in relation to the hypothesis that variables such as luminosity, microclimate, and soil humidity may be potentially predictive of variations in the vegetation of tropical forests. Legendre et al. (2009) pointed out that non-spatially structured biological processes may also explain part of the residual fraction in ecological models. Besides environmental variables, other factors bound to niche conditions may have an influence on the distribution of species in tropical forests (see Baldeck
et al. 2013). For example, competition is an important factor in the colonization process of species (Gotelli 1999), mainly because some species have shown a preference for determined niche conditions. Stochastic factors such as dispersion, which are bound to neutral processes, are also relevant (Hubbell 2001; Cottenie 2005), because in the Atlantic Forest there are complex interactions between plants and dispersers. Furthermore, dispersion syndromes
and dispersion agents vary with elevation (Almeida-Neto
et al. 2008).
In the present study, the partition of variance indicated a great percentage of unknown fractions in the explanation of composition patterns, but it also revealed the statistical significance of environmental and spatial factors as promoters of species distribution. The fraction related to “pure” environment (13%) highlights that niche processes could act on floristic patterns, because we found environmental variables strongly related to species composition. On the other hand, the low explanation of the fraction “pure” space (3%) could be understood by considering the high spatial structuration of the environmental variables along the hillside. Spatial factors resulting from limitations of seedling dispersion (Peña-Claros et al. 2012) or from neutral processes (Diniz-Filho et al. 2012) show lower influence on the variation of distribution patterns. However, even with a low level of explanation, the contribution of the “pure” spatial component was significant, indicating that factors related to spatial structure have an influence on species composition patterns. Therefore, studies on floristic patterns of the Atlantic Forest must take into consideration the spatial component. Gilbert & Lechowicz (2004) highlight that measurement of dispersion effects may be difficult due to the spatial structure and variability found in ecosystems. Thus, these authors recommend the use of more complex models that consider, for example, the effect of interactions between dispersion and competition, because they can offer greater potential in explaining these results. Environmental factors related to elevation, topography, and soil are important predictive variables for the distribution of tree and shrub species in hillsides of the subtropical rainforest in southern Brazil. In this study, environmental factors related to physical and chemical characteristics of soils did not present a strong relation with distribution patterns of vegetation.
The present work indicates a statistically significant role of environmental and spatial variations in the composition of tree and shrub species in a hillside of the subtropical rainforest in Brazil, as well as the complex role of both sets of predictors. Considering that this study focused on a local scale, other works with the same objective must focus on other locations of the subtropical rainforest. It is important for these other works to investigate association patterns between species, to put these patterns in relation with environmental factors, and to test the influence of other predictive variables like competition, dispersion, luminosity, microclimate, and soil humidity.
Acknowledgments
References
Almeida-Neto M, Campassi F, Galetti M, Jordano P, Oliveira-Filho AT. 2008. Vertebrate dispersal syndromes along the Atlantic forest: broad-scale patterns and macroecological correlates. Global Ecology and Biogeography 17: 503-513.
Alvares CA, Stape JL, Sentelhas PC, Gonçalves JLM, Sparovek G. 2014. Köppen’s climate classification map for Brazil. Meteorologische Zeitschrift 22: 711-728.
Baldeck CA, Harms KE, Yavitt JB, et al. 2013. Soil resources and topography shape local tree community structure in tropical forests. Proceedings of the Royal Society B 280: 20122532.
Blanchet FG, Legendre P, Borcard D. 2008. Forward selection of explanatory variables. Ecology 89: 2623-2632.
Bohlman SA, Laurance WF, Laurance SG, Nascimento HEM, Fearnside PM, Andrade A. 2008. Importance of soils, topography and geographic distance in structuring central Amazonian tree communities. Journal of Vegetation Science 19: 863-874.
Borcard D, Gillet F, Legendre P. 2011. Numerical Ecology with R. New York, Dordrecht London Heidelberg.
Boulangeat I, Gravel D, Thuiller W. 2012. Accounting for dispersal and biotic interactions to disentangle the drivers of species distributions and their abundances. Ecology Letters 15: 584-593.
Budke JC, Jarenkow JA, Oliveira-Filho AT. 2007. Relationships between tree component structure, topography and soils of a riverside forest, Rio Botucaraí, Southern Brazil. Plant Ecology 189: 187-200. Causton DR. 1988. An introduction to vegetation analysis, principles and
interpretation. London, Unwin Hyman.
Cottenie K. 2005. Integrating environmental and spatial processes in ecological community dynamics. Ecology Latters 8: 1175-1182. Crawley MJ. 1986. Plant Ecology. Oxford, Blackwell Scientific Publications. Dale MRT, Fortin MJ. 2009. Spatial Autocorrelation and Statistical Tests: Some Solutions. Journal of Agricultural, Biological, and Environmental Statistics 14: 188-206.
Diniz-Filho JAF, Hawkins BA, Bini LM, Marco JrP, Blackburn TM. 2007. Are spatial regression methods a panacea or a Pandora’s box? A reply to Beale et al. (2007). Ecography 30: 848-851.
Diniz-Filho JAF, Siqueira T, Padial AA, Rangel TF, Landeiro VL, Bini LM. 2012. Spatial autocorrelation analysis allows disentangling the balance between neutral and niche processes in metacommunities. Oikos 121: 201-210.
Dray S, Legendre P, Peres-Neto PR. 2006. Spatial modelling: a comprehensive framework for principal coordinate analysis of neighbour matrices (PCNM). Ecological Modelling 196: 483-493.
Eisenlohr PV. 2014. Persisting challenges in multiple models: a note on commonly unnoticed issues regarding collinearity and spatial structure of ecological data. Brazilian Journal of Botany 37: 365-371. Eisenlohr PV, Alves LF, Bernacci LC, et al. 2013. Disturbances, elevation,
topography and spatial proximity drive vegetation patterns along an altitudinal gradient of a top biodiversity hotspot. Biodiversity and Conservation 22: 2767-2783.
EMBRAPA – Empresa Brasileira de Pesquisa Agropecuária. 2013. Sistema Brasileiro de Classificação de Solos. Brasília, EMBRAPA.
Ferreira-Júnior WG, Silva AF, Schaefer CEGR, et al. 2007. Influence of soils and topographic gradients on tree species distribution in a Brazilian Atlantic Tropical Semideciduous Forest. Edinburgh Journal of Botany 64: 137-157.
Ferreira-Júnior WG, Schaefer CEGR, Silva AFS. 2012. Uma visão pedogeomorfológica sobre as formações florestais da Mata Atlântica. In: Martins SV. (ed.) Ecologia de Florestas Tropicais do Brasil. Viçosa, Editora UFV. p. 141-174.
Fortin MJ, Dale MRT. 2005. Spatial analysis: a guide for ecologists. Cambridge, University Press.
Gasper AL, Eisenlohr PV, Salino A. 2013. Climate-related variables and geographic distance affect fern species composition across a vegetation gradient in a shrinking hotspot. Plant Ecology & Diversity 6: 1-11. Gentry AH. 1988. Changes in Plant Community Diversity and Floristic
Composition on Environmental and Geographical Gradients. Annals of the Missouri Botanical Garden 75: 1-34.
Gilbert B, Lechowicz MJ. 2004. Neutrality, niches, and dispersal in a temperate forest understory. Proceedings of the national Academy of Sciences of the United States of America 101: 7651-7656. Gonçalves IS, Dias HCT, Martins SV, Souza AL. 2011. Fatores edáficos e
as variações florísticas de um trecho de mata ciliar do Rio Gualaxo do Norte, Mariana, MG. Revista Árvore 35: 1235-1243.
Gotelli NJ. 1999. Ecology: How do communities come together? In: Weiher E, Keddy P. (eds.) Ecological Assembly Rules: perspectives, advances, retreats. Cambridge, Cambridge University Press. p. 1684-1685. Gotelli NJ, McCabe DJ. 2002. Species co-occurrence: a meta-analysis of J.
M. Diamond’s assembly rules model. Ecology 83: 2091-2096. Guerra TNF, Rodal MJN, Silva ACBL, Alves M, Silva MAM, Mendes PGA.
2013. Influence of edge and topography on the vegetation in an Atlantic Forest remnant in northeastern Brazil. Journal of Forest Research 18: 200-208.
Higuchi P, Silva AC, Almeida JA, et al. 2013. Florística e estrutura do componente arbóreo e análise ambiental de um fragmento de Floresta Ombrófila Mista alto-montana no município de Painel, SC. Ciência Florestal 23: 153-164.
Hill MO, Gauch HG 1980. Detrended correspondence analysis: an improved ordination technique. Vegetatio 42: 47-58.
Hoffmann A, Moreli LH, Moreli W. 2002. Reserva Particular do Patrimônio Natural - RPPN Chácara Edith. Brusque, Nova Letra.
Howe HF, Smallwood J. 1982. Ecology of seed dispersal. Annual Review of Ecology and Systematics 13: 201-228.
Hubbell SP. 2001. The unified neutral theory of biodiversity and biogeography. Princeton, Princeton University Press.
John R, Dalling JW, Harms KE, et al. 2007. Soil nutrients influence spatial distributions of tropical tree species. Proceedings of the national Academy of Sciences of the United States of America 104: 864-869. Jones MM, Szyska B, Kessler M. 2011. Microhabitat partitioning promotes
plant diversity in a tropical montane forest. Global Ecology and Biogeography 20: 558-569.
Karst J, Gilbert B, Lechowicz MJ. 2005. Fern community assembly: the roles of chance and the environment at local and intermediate scales. Ecology 86: 2473-2486.
Klein RM. 1980. Ecologia da flora e vegetação do Vale do Itajaí. Sellowia 32: 165-389.
Klein RM. 1984. Aspectos dinâmicos da vegetação do sul do Brasil. Sellowia 36: 5-54.
Legendre P. 1993. Spatial autocorrelation: trouble or new paradigm? Ecology 74: 1659-1673.
Legendre P, Gallagher ED. 2001. Ecologically meaningful transformations for ordination of species data. Oecologia 129: 271-280.
Legendre P, Mi X, Ren H, et al. 2009. Partitioning beta diversity in a subtropical broad-leaved forest of China. Ecology 90: 663-674. Legendre P, Legendre L. 2012. Numerical ecology. Amsterdam, Elsevier. Leite PF. 2002. Contribuição ao conhecimento fitoecológico do sul do
Brasil. Ciência Ambiental 24: 51-73.
Lewis RJ, Pakeman RJ, Marrs RH. 2014. Identifying the multi-scale spatial structure of plant community determinants of an important national resource. Journal of Vegetation Science 25: 184-197.
Lichstein JW, Simons TR, Shriner SA, Franzreb KE. 2002. Spatial autocorrelation and autoregressive models in ecology. Ecological Monographs 72: 445-463.
Maçaneiro JP, Seubert RC, Schorn LA. 2015. Phytosociology of a primary Subtropical Rain Forest in southern Brazil. Floresta 45: 555-566. Machado ELM, Oliveira-Filho AT, Berg E, et al. 2008. Efeitos do substrato,
bordas e proximidade espacial na estrutura da comunidade arbórea de um fragmento florestal em Lavras, MG. Revista Brasileira de Botânica 31: 287-302.
Marangon LC, Soares JJ, Feliciano ALP, Lani JL, Matos LV. 2013. Relação entre vegetação e pedoformas na Mata do Paraíso, município de Viçosa, Minas Gerais. Revista Árvore 37: 441-450.
Marcuzzo SB, Araújo MM, Longhi SJ. 2013. Estrutura e relações ambientais de grupos florísticos em fragmento de Floresta Estacional Subtropical. Revista Árvore 37: 275-287.
João Paulo de Maçaneiro, Laio Zimermann Oliveira, Rafaela Cristina Seubert, Pedro V. Eisenlohr and Lauri Amândio Schorn
Meireles LD, Shepherd GJ, Kinoshita LS. 2008. Variações na composição florística e na estrutura fitossociológica de uma Floresta Ombrófila Densa Alto-Montana na Serra da Mantiqueira, Monte Verde, MG. Revista Brasileira de Botânica 31: 559-574.
Mélo MA, Budke JC, Henke-Oliveira C. 2013. Relationships between structure of the tree component and environmental variables in a subtropical seasonal forest in the upper Uruguay River valley, Brazil. Acta Botanica Brasilica 27: 751-760.
O’Brien EM, Field R, Whittaker RJ. 2000. Climatic gradients in woody plant (tree and shrub) diversity: water–energy dynamics, residual variation, and topography. Oikos 89: 588-600.
Oliveira-Filho AT. 2015. Um sistema de classificação fisionômico-ecológico da vegetação neotropical: segunda aproximação. In: Eisenlohr PV, Felfili JM, Melo MMRF, Andrade LA, Neto JAAM. (eds.) Fitossociologia no Brasil: métodos e estudos de casos. Viçosa, Editora UFV.
Oliveira-Filho AT, Fontes MA. 2000. Patterns of floristic differentiation among Atlantic Forests in Southeastern Brazil and the influence of climate. Biotropica 32: 793-810.
Oliveira-Filho AT, Budke JC, Jarenkow JA, Eisenlohr PV, Neves DRM. 2013. Delving into the variations in tree species composition and richness across South American subtropical Atlantic and Pampean forests. Journal of Plant Ecology 6: 1-23.
Pandolfo C, Braga HJ, Silva Júnior VP, et al. 2002. Atlas Climatológico do Estado de Santa Catarina. Florianópolis, Epagri.
Penã-Claros M, Poorter L, Alarcón A, et al. 2012. Soil effects on forest structure and diversity in a moist and a dry Tropical Forest. Biotropica 44: 276-283.
Peres-Neto PR. 2006. A unified strategy for estimating and controlling spatial, temporal and phylogenetic autocorrelation in ecological models. Oecologia Brasiliensis 10: 105-119.
Peres-Neto PR, Legendre P. 2010. Estimating and controlling for spatial structure in the study of ecological communities. Global Ecology and Biogeography 19: 174-184.
Philipp RP, Mallmann G, Bitercourt MF, et al. 2004. Caracterização litológica e evolução metamórfica da porção leste do Complexo Metamórfico Brusque, Santa Catarina. Revista Brasileira de Geociências 34: 21-34. R Core Team. 2013. R: A language and environment for statistical
computing. Viena, R Foundation for Statistical Computing. Ribeiro MC, Martensen AC, Metzger JP, Tabarelli M, Scarano F, Fortin MJ.
2011. The Brazilian Atlantic forest: a shrinking biodiversity hotspot. In: Zachos FE, Habel JC. (eds.) Biodiversity hotspots. Heidelberg: Springer. Rodrigues LA, Carvalho DA, Oliveira-Filho AT, Curi N. 2007. Efeitos de
solos e topografia sobre a distribuição de espécies arbóreas em um fragmento de floresta estacional semidecidual, em Luminárias, MG. Revista Árvore 31: 25-35.
Rosenberg MS, Anderson CD. 2011. PASSaGE: Pattern Analysis, Spatial Statistics and Geographic Exegesis. Version 2. Methods in Ecology and Evolution 2: 229-232.
Sanchez M, Pedroni F, Eisenlohr PV, Oliveira-Filho AT. 2013. Changes in tree community composition and structure of Atlantic rain forest on a slope of the Serra do Mar range, Southeastern Brazil, from near sea level to 1000 m of altitude. Flora 208: 184-196.
Santa Catarina. 1986. Atlas de Santa Catarina. Florianópolis, GAPLAN/ SUEGI.
Santos RD, Lemos RC, Santos HG, Ker JC, Anjos LHC, Shimizu SH. 2013. Manual de descrição e coleta de solo no campo. Viçosa, SBCS. Schulz-Júnior A, Albuquerque LFF. 1969. Geologia da quadrícula Rio do
Sul, Santa Catarina. Porto Alegre, DNPM.
Schupp EW, Milleron T, Russo SE. 2002. Dissemination limitation and the origin and maintenance of species‐rich tropical forests. In: Levey DJ,
Silva WR, Galetti M. (eds.) Seed Dispersal and Frugivory: Ecology, Evolution and Conservation. São Pedro, CAB International. p. 19-33. Silva AC, Berg E, Higuchi P, et al. 2009. Florística e estrutura da comunidade
arbórea em fragmentos de floresta aluvial em São Sebastião da Bela Vista, Minas Gerais, Brasil. Revista Brasileira de Botânica 32: 283-297. Soares CPB, Paula Neto F, Souza AL. 2012. Dendrometria e Inventário
Florestal. Viçosa, Editora UFV.
Souza JS, Espírito-Santo FDB, Fontes MAL, Oliveira-Filho AT, Botezelli L. 2003. Análise das variações florísticas e estruturais da comunidade arbórea de um fragmento de Floresta Semidecídua às margens do Rio Capivari, Lavras-MG. Revista Árvore 27: 185-206.
Souza PB, Lelis JJ, Schaefer CEGR, Souza AL, Neto JAAM. 2012. Distribution of tree species in a geomorphological and pedological gradient of submontane Semidecidual Seasonal Forest in the Vicinity of Rio Doce State Park, Minas Gerais. Revista Árvore 36: 707-718. Thuiller W. 2013. On the importance of edaphic variables to predict plant
species distributions – limits and prospects. Journal of Vegetation Science 24: 591-592.
Toledo M, Peña-Claros M, Bongers F, et al. 2012. Distribution patterns of tropical woody species in response to climatic and edaphic gradients. Journal of Ecology 100: 253-263.
Veloso HP, Klein RM. 1959. As comunidades e associação vegetais da mata pluvial do sul do Brasil. II. Dinamismo e fidelidade das espécies em associações do município de Brusque, Estado de Santa Catarina. Sellowia 10: 9-124.
Vieira LTA, Polisel RT, Ivanauskas NM, et al. 2015. Geographical patterns of terrestrial herbs: a new component in planning the conservation of the Brazilian Atlantic Forest. Biodiversity and Conservation 24: 2181-2198.