Science &
Technology
PAPER
Cite this:Catal. Sci. Technol., 2018,
8, 443
Received 11th August 2017, Accepted 27th November 2017
DOI: 10.1039/c7cy01640a
rsc.li/catalysis
Copper promoter effect on acid
–
base and redox
sites of Fe/Al
2
O
3
catalysts and their role in
ethanol
–
acetone mixture conversion
Antonio Narcisio Pinheiro,
aRegina Claudia Rodrigues dos Santos,
*
abSarah Brenda Ferreira dos Santos,
aMoacir José da Silva Júnior,
aTiago Pinheiro Braga,
cValder Nogueira Freire
band Antoninho Valentini
*
aActive species of copper and iron oxide (Cu–Fe) catalysts supported on alumina were prepared by combin-ing Pechini and wet impregnation methods. The effect of combined acid–base and redox sites of Cu and Fe species on gas-phase ethanol–acetone mixture conversion was investigated. The catalysts were charac-terized by chemical analyses, XRD, H2-TPR, Mössbauer spectroscopy, N2physisorption, CO2-TPD,
SEM-EDS, TG/DTA and pyridine adsorption isotherms. N2adsorption/desorption isotherms and SEM-EDS
analy-sis showed that the addition of copper caused an increase of BET surface area and Cu and Fe oxide disper-sion. H2-TPR characterization showed that interactions between Cu and Fe oxides shift the reducibility of
Fe3+species to lower temperature improving the redox properties of the catalyst. The partial reduction of the Cu and Fe oxide species was found to be efficient in inhibiting the side decomposition reactions, im-proving the catalytic efficiency towards dehydrogenation and hydrogen transfer processes. It was found that acid–base pairs play an important role in the formation of dehydrogenation, dehydration and conden-sation products from ethanol, while redox sites are decisive for hydrogen transfer reactions with reduction of acetone to isopropanol. H2-TPR and Mössbauer spectroscopy results for the spent catalysts revealed
that the highest catalytic performance of the Cu–FeAl catalysts may be attributed to the good dispersion of the Cu oxide and the site generated by the partial reduction which produces Cu+/Cu0and Fe2+active spe-cies. A reaction pathway with the participation of the acid–base and redox sites in the formation of prod-ucts by consecutive dehydrogenation–condensation or dehydrogenation–hydrogenation reactions has been proposed.
1. Introduction
Nowadays, major research effort has been given to the devel-opment of green processes and use of alternative feedstock, mainly from renewable biomass resources, to produce fuels and fine chemical products.1 Biofuels and chemicals
pro-duced from biomass could help to reduce both the world's de-pendence on petroleum and CO2emission.2,3Currently,
etha-nol is an important energy source in Brazil, which is directly used as fuel or blended with fossil fuels, where it is produced from sugar cane.4However, bio-ethanol, which is ethanol
pro-duced from renewable biomass resources, represents almost 90% of the global biofuel production.3 Therefore, ethanol
may become available as a sustainable and renewable plat-form molecule for the production of value-added chemicals such as 1-butanol, ethylene, ethyl acetate, acetaldehyde, ethyl ether, acetone, butadiene and hydrogen.3,5,6
The conversion of ethanol to useful chemicals can com-prise both parallel and consecutive reaction pathways, includ-ing dehydrogenation, condensation, dehydration and decom-position.3 Dehydrogenation and dehydration are typically
endothermic reactions, while condensation presents exother-mic thermodynaexother-mic character; thus, the reaction pathway should depend on the reaction temperature.3,7In addition to
reaction temperature, the acid–base properties also have a meaningful effect on the catalytic performance, such as prod-uct selectivity and catalyst stability. The ethanol dehydration process has been extensively studied over a variety of acidic or amphoteric catalysts;8,9
γ-Al2O3 and zeolites (e.g., ZSM-5)
have received the most attention due to their high activity and selectivity.10,11 However, transition metal oxides, mainly
copper-based catalysts, also exhibited a high selectivity to de-hydrogenation products.7,12 Another interesting catalytic aDepartment of Analytical Chemistry and Physical Chemistry, Federal University
of Ceará, Campus of Pici, Fortaleza - CE, 60440-554, Brazil. E-mail: reginaclaudiasantos@yahoo.com.br, valent@ufc.br
bDepartment of Physics, Federal University of Ceará, Campus of Pici, Fortaleza
-CE, 60440-554, Brazil
cInstitute of Chemistry, Federal University of Rio Grande do Norte, Campus
Universitário, Natal - RN, 59078-970, Brazil
Published on 27 November 2017. Downloaded by Federal University of Ceará on 22/05/2018 19:56:14.
process, wherewith ethanol may be used as a platform mole-cule, is the condensation reaction, which forms a carbon–
car-bon car-bond between two aldehyde or ketone molecules. This process is generally carried out at mild reaction tempera-tures, on acidic or basic catalysts.3,13–15The reaction of
etha-nol condensation can occur through the initial formation of aldehydes, which sequentially are subjected to an aldol con-densation reaction. Therefore, it is reasonable to propose that sequential reaction pathways require a catalyst system possessing bifunctionality of active sites to achieve greater re-action rates and product selectivity.15,16 It is especially
rele-vant if a ketone is added to the reaction mixture (ethanol–
ke-tone), where the condensation reaction can occur between the alcohol and the ketone.17Therefore, factors such as
reac-tion temperature, the reactant molar ratio, the structure of re-actant molecules, and the nature of the catalyst can deter-mine the selectivity of the process toward important oxygenate compounds.3,15A recent publication by Onyestyák et al.with an acetone–ethanol mixture has stated that under
a hydrogen atmosphere, acetone could be reduced to isopro-pyl alcohol over Pd catalysts.18However, it is likely that this
process should involve a gas-phase hydrogen transfer step from the dehydrogenation reaction of ethanol to aldehydes, which is similar to the Meerwein–Ponndorf–Verley
reduction.18,19
Catalysts containing iron oxide are active in various reac-tions. Fe-based oxides supported on alumina were found to be promising in the dehydrogenation of ethylbenzene with carbon dioxide.12,20Catalysts such as Ni/Fe
2O3, Cu/Fe2O3and
Pd/Fe2O3have been investigated for production of bioderived
compounds21in a catalytic hydrogen transfer system with
al-cohols as hydrogen donors. Additionally, bimetallic MxOy–
FeOx catalysts can catalyse the conversion of biomass
re-sources through the dehydration process and consecutive hy-drogen transfer reaction.22However, mixed oxides with
inad-equately balanced surface acid–base properties and redox
sites would catalyse the secondary reactions (cracking and coking) leading to rapid deactivation of the catalyst by losing active sites as well as affecting the product distribution.23,24
Therefore, considering the bi-functional mechanism of the ti-tle reaction, there is a need to develop catalysts, which pres-ent a uniform dispersion of the active acid–base and redox
sites. Interestingly, the addition of Cu oxide into Fe oxide-based catalysts can induce structural changes on the catalyst and improve the iron dispersion.25,26Furthermore, the
inter-actions between the Cu and Fe species have an effect on the catalyst reducibility, enhancing the reactivity of the surface sites.26,27
Despite the wide application range of Cu- or Fe-based catalysts, no studies of Cu–Fe catalysts dispersed on Al2O3
for the conversion of an ethanol–acetone mixture have yet
been carried out. Additionally, to the best of our knowledge, the role of both acid–base and redox sites on bimetallic
Cu–Fe catalysts in ethanol and/or acetone conversion to
chemicals has not yet been fully demonstrated based on ex-perimental results.
Therefore, it is interesting to present the discussion of the effect of combined structural, textural, acid–base and redox
properties on the catalytic performance of the Fe/Al2O3
cata-lyst, with and without a copper promoter. The effects of the reaction temperature, ethanol-to-acetone (Et/Ac) molar ratio and copper content of the catalyst on the catalytic mance were studied. The explanation for the catalytic perfor-mance is based on characterization of several physical and chemical properties of the fresh and spent catalysts. There-fore, in the light of the results obtained, a reaction pathway for the formation of products from an ethanol–acetone
mix-ture with participation of both acid–base and redox sites is
proposed.
2. Experimental
2.1. Catalyst synthesis
The reference monometallic catalyst with 10 wt% iron oxide supported on Al2O3 (10FeAl) was prepared according to the
polymeric precursor method previously described.28This
syn-thesis route allows preparation of a solid sample with a high dispersion of the active metal oxide.29 Aluminium nitrate
nonahydrate {AlIJNO3)3·9H2O}, iron nitrate nonahydrate
{FeIJNO3)3·9H2O}, citric acid monohydrate (CA) {C6H8O7·H2O}
and ethylene glycol (EG) {C2H6O2} were used as starting
chemicals. An EG/CA/metal molar ratio of 2 : 3 : 1 was used in the synthesis of the samples. In brief, an aqueous solution of metal precursors and CA were mixed and stirred for 1 h at room temperature for the formation of a metal citrate com-plex. Subsequently, EG was added, and the mixture was kept under vigorous stirring at 90 °C until it became a viscous resin. The resin was heat treated at 250 °C for 1 h in an air atmosphere. The resulting precursor composite was ground and heat treated at 500°C under air flow for 1 h.
The bimetallic CuFeAl catalysts with two different amounts of copper oxide (0.5 and 1 wt%) were prepared using a wet impregnation method from the 10FeAl sample, as previously reported.12,25The 10FeAl solid was placed in contact with an
aqueous solution containing appropriate amounts of copper nitrate. This system remained under magnetic stirring at 70 °C until the total evaporation of the solvent. The calcina-tion process for the dried solids was performed at 500°C in a muffle furnace under air flow for 1 h. The bimetallic catalyst composed of iron and copper oxides supported on Al2O3was
denominated as 0.5CuFeAl or 1CuFeAl.
2.2. Catalyst characterization
The relative amount of iron and copper (wt%) was deter-mined by using atomic absorption spectroscopy (GBC933 AA model). Previously, the solids were digested in concentrated nitric acid under heating at 200 °C. The obtained solutions were diluted to 50 mL to perform the measurements. The crystalline structure of the solids was characterized by X-ray diffraction (XRD) using an X'Pert PANalytical diffractometer operated at 40 kV and 40 mA employing a Cu-Kα radiation source (λ = 1.5418 Å). The experiments were performed at
high diffraction angles (2θ from 10 to 90°). The crystalline phases were identified using the software X'Pert HighScore Plus® (PANalytical), and the crystallographic data for all phases were determined using the Inorganic Crystal Structure Database (ICSD).
The textural properties of the catalysts were determined by adsorption/desorption at−196°C on a Quantachrome instru-ment, Autosorb-1B model. The samples were degassed at 250 °C prior to the measurement. The specific surface area of the samples was determined using the BET method. The pore size distribution was derived from the adsorption branches of the isotherms using the Barrett–Joyner–Halenda (BJH)
method.30 The
t-plot method (Harkins and Jura equation)
was applied to determine the volume and area of the micro-pores.31Scanning electron micrographs (SEM) were recorded
using a TESCAN VEGA XMU electron microscope equipped with a Bruker QUANTAX EDS system coupled to the SEM microscope. Previously, the samples were deposited on an al-uminium sample holder and sputtered with gold, and then SEM measurements were conducted, using an accelerating voltage of 20 kV.
The fresh and spent catalysts were characterized using the temperature-programmed reduction technique (TPR) in the range of 50–950°C in a quartz reactor using an 8% H2/N2 mix-ture flow (30 mL min−1) at a heating rate of 10 °C min−1. Be-fore the TPR tests, the samples (50 mg) were subjected to heat treatment at 300°C under N2flow for 0.5 h. A thermal conduc-tivity detector (TCD) monitored the hydrogen consumption.
The acid properties of the samples were evaluated using pyridine adsorption isotherms, and experiments were carried out in the liquid phase with a non-polar solvent (cyclohex-ane). Previously, the samples were heat treated at 250°C un-der N2 flow for 60 min and cooled down to room
tempera-ture. Pyridine adsorption experiments were carried out at 25 °C using a closed glass flask containing 50 mg of the solid sample and 4 mL of cyclohexane. Solutions of known pyri-dine and n-heptane (used as the internal standard)
concen-trations in cyclohexane were added by injection with a micro-syringe. After each injection, the pyridine concentration in the solution was determined by gas chromatography, using a flame ionization detector (FID) and a capillary DB-5 column (20 m × 0.18 mm × 0.4 μm). The amount of pyridine adsorbed by the solid surface area was calculated according to the equation described in a previous work.24
The presence of basic sites was determined by temperature-programmed desorption of CO2(CO2-TPD). Prior to TPD, the
samples were heat treated under He flow (20 mL min−1) at 500 °C for 30 min and cooled under the same gas flow to 25°C. CO2 adsorption was carried out by using a flow of pure CO2
through the reactor for 30 min at 25°C. After baseline stabili-zation under He flow (20 mL min−1) at room temperature, the CO2-TPD run was carried out with a heating rate of 10 °C
min−1 from room temperature up to 500°C. CO
2 desorption
was monitored using a thermal conductivity detector (TCD).
57Fe Mössbauer spectroscopy measurements were taken at
room temperature for fresh and spent catalysts with a
spectrometer working in constant acceleration mode. The measurements were carried out using standard transmission geometry with57Co/Rh as the radioactive source. The spectra
were fitted to discrete Lorentzian functions evaluated by means of a non-linear routine that uses the least squares method. All the values of isomeric displacement are relative to those obtained forα-Fe. Thermogravimetric analysis (TGA) and differential thermal analysis (DTA) were carried out on spent catalysts to examine the amounts of carbon deposits using Shimadzu DTA-60H equipment. The TG measurements were made under air flow (40 ml min−1) from room tempera-ture to 1000°C, with a heating rate of 10°C min−1.
2.3. Catalytic tests
The catalytic reaction between ethanol and acetone was performed using a conventional gas-phase system with a fixed bed reactor at atmospheric pressure. A reaction mixture containing ethanol and acetone vapours was generated by passing N2 (total flow of 30 mL min−1) through two flasks
with controlled temperature, one at 25 °C (ethanol) and the other at 5 °C (acetone). The catalysts were previously acti-vated in situ under N2 flow (30 mL min−1) at 450 °C for 60
min. The catalytic tests were carried out at 350 °C using an ethanol (Et) and acetone (Ac) mixture at molar ratios of 0.5 and 2. The amount of reactant fed per unit time to the inlet of the reactor was 9.87 mmol h−1and 5.40 mmol h−1for etha-nol and acetone, respectively, for the Et/Ac ratio of 2 and 4.96 mmol h−1 and 10.75 mmol h−1 for ethanol and acetone, re-spectively, for the Et/Ac ratio of 0.5. In order to evaluate the effect of temperature on the catalytic behaviour, catalytic tests at temperatures of 300 and 350°C were carried out for the bimetallic 0.5CuFeAl catalyst. The products generated were identified using a gas chromatograph coupled with a mass spectrometer (GC-MS, QP 2010 Plus model from Shimadzu). The product quantification and the catalytic frac-tional conversion of reagents were monitored by means of a gas chromatograph equipped with a FID and a DB-5 capillary column (20 m×0.18 mm×0.4μm). Taking into account the difference between the amount of reactant introduced and the amount that left the reactor and the division by the amount of reactant introduced, the fractional conversion was determined. The reactant conversion was taken in a specific rate inμmol gcat−1h−1.7
3. Results and discussion
3.1. Chemical composition and structural features of the catalysts
Table 1 shows the results of chemical analysis by atomic ab-sorption spectroscopy. The monometallic 10FeAl and bime-tallic CuFeAl catalysts show iron and copper content very close to the nominal values, which are 10 wt% Fe and 0.5 or 1 wt% Cu. This suggests that no Fe loss occurred during the Cu impregnation process to obtain bimetallic solids. The higher Fe wt% for the samples 0.5CuFeAl and 1CuFeAl relative to the sample 10FeAl (Table 1), point out to the Al3+leaching
during the Cu2+impregnation process. However, take into
ac-count the content of iron oxide value used (10 wt%), this change in the iron oxide percentage is not significant.
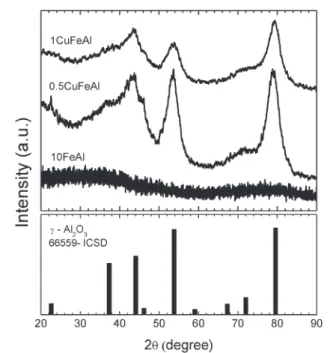
The powder XRD patterns of the samples after the calcina-tion process at 500 °C are shown in Fig. 1. The profiles clearly point out a structural change due to copper impregna-tion. The diffraction pattern of the monometallic 10FeAl cata-lyst points to a poorly crystalline material, typical of an amor-phous solid. Considering the calcination temperature of 500 °C, the result suggests a high dispersion of Fe oxide species on the Al2O3matrix.
This feature is commonly found in materials prepared by the polymeric precursor method.12,20
The addition of the copper precursor by a wet impregnation method revealed the formation of broader peaks correspond-ing to the cubic crystalline phase of γ-Al2O3 (ICSD – 66559)
with main peaks at 2θ= 36.4, 43.9, 53.5, 71.2 and 79.1° for both bimetallic samples. Moreover, the diffractograms do not point to any reflections belonging to crystalline Fe or Cu oxide phases, indicating that both metal oxides are present in an amorphous state or with a high dispersion on the alumina ma-trix. On the other hand, if the crystalline phase of Fe2O3 is
present, the crystallite diameter is very small.
Mössbauer spectroscopy measurement was performed in order to obtain additional information about the structural
properties of the solids, as well as to observe changes in the oxidation state of the iron oxide due to the reaction condi-tions employed. Fig. 2 shows the Mössbauer spectra of the fresh samples while the hyperfine parameters of the doublets observed are summarised in Table 2.
The Mössbauer spectra of the 10FeAl sample displayed in Fig. 2 show the presence of two doublets, which is typical of the Fe3+present in the structure of the iron oxide phase
(he-matite).32,33However, the presence of a second doublet may
be due to the effect of the aluminum oxide on the iron oxide structure, which results in a different chemical environment. On the other hand, the Mössbauer spectra of the sample 1CuFeAl show three doublets, which may be due to the pres-ence of the hematite phase (Fe2O3) and copper ferrite
(CuFe2O4),34in addition to the aluminium oxide effect.
Therefore, in the 1CuFeAl sample, the iron oxide is in a dif-ferent chemical environment, resulting in the presence of three doublets. The presence of doublets in the Mossbauer spectra suggests that the iron oxide is well dispersed with particles hav-ing nanometer diameter as indicated by the XRD results (Fig. 1), which probably has superparamagnetic properties.32,34
3.2. Evaluation of reduction behaviour of the catalysts by H2-TPR
Temperature-programmed reduction (H2-TPR) has been a
powerful tool for examining the reduction behaviour and also the interaction effect between two metal oxide species of cata-lysts.34,35 Thus, the H
2-TPR technique was used to evaluate
the effects of CuO on the reduction properties of bimetallic CuFeAl catalysts, and the results are shown in Fig. 3.
The monometallic 10FeAl sample exhibits two broad peaks of H2consumption. The first is in the range of 250 to 650°C
and the second, which overlaps with the first, extends to 970 °C. Indeed, this is a common feature of Fe-based catalysts,
Table 1 Iron (Fe) and copper (Cu) contents in catalysts determined by atomic absorption spectroscopy analysis
Metal content (wt%)
Samples
10FeAl 0.5CuFeAl 1CuFeAl
Fe 9.36 9.48 10.66
Cu — 0.75 1.17
Fig. 1 XRD patterns of catalysts calcined at 500°C under air flow.
Fig. 2 Mössbauer spectra of the fresh samples at room temperature (300 K).
where the phases of iron oxide present support effects.12The
first peak with a maximum near 566 °C is assigned to the partial reduction of Fe3+to Fe2+species on structures of iron
oxide present as hematite and/or magnetite.12,36 However,
the non-symmetrical profile, which starts near 250 °C, sug-gests that a fraction of the iron oxide is reduced to metallic iron in the first H2 consumption band. This is consistent
with the relative amount of H2 consumed in the first band
(250–650 °C), which is similar to that in the second band. The second large H2consumption band, centred at about 800
°C, can be ascribed to the reduction of the residual Fe2+ to produce metallic iron.36
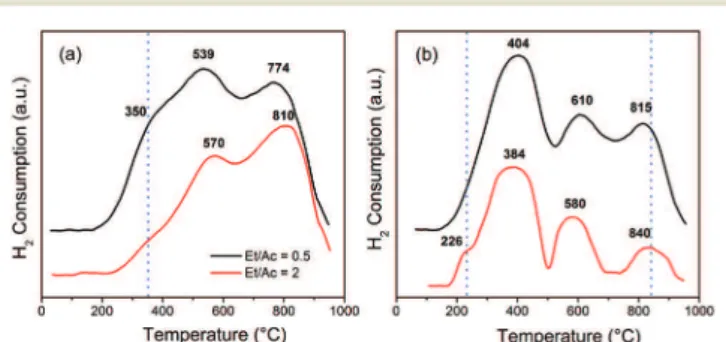
Interestingly, it is evident from Fig. 3 that the addition of copper affected the reducibility of the iron species, and the effect on the reduction is more significant in the sample with higher Cu content. The TPR profile shows an expressive shift for the reduction peaks of iron species to lower temperature in both bimetallic Cu–Fe catalysts. This indicated that the
re-ducibility of the iron oxide species is modified by Cu addi-tion. The 0.5CuFeAl sample displays only one broad peak of H2consumption with a maximum at 380°C, which is due to the simultaneous reduction of copper and iron oxide spe-cies.37 However, the H
2 consumption signal of the catalyst
with higher Cu content (1CuFeAl) exhibits a strong and sharp
peak with a maximum at the lowest temperature (251 °C). This indicates a characteristic temperature reduction for CuO. Following the process, it is observed that H2 was
con-sumed up to 600°C. The shift of the temperature of H2 con-sumption in the profiles of both samples (0.5CuFeAl and 1CuFeAl) may be interpreted as a strong Cu–Fe interaction,
with the possible formation of a CuFe2O4 phase.25
Further-more, the sample 1CuFeAl should present a higher amount of Cu2+exposed on the surface, which facilitates the
reduc-tion of oxides. It is known that the reducibility of bimetallic catalysts is strongly affected by the interaction between two metal species, where the copper (for instance) can catalyse the reduction of the other transition metal.24,35 Therefore,
the addition of CuO to FeAl significantly changes the redox properties of the catalyst with the main peaks shifting to lower reduction temperatures. It is reasonable to propose that the displacement of the entire iron oxide reduction band is only possible if the copper oxide is well dispersed, besides the strong interaction between Cu2+and Fe3+species on the
catalysts. The 1CuFeAl sample shows a weak H2consumption
peak at high temperature (800–950 °C), which suggests the reduction of the iron spinel structure formed by a stronger interaction with the support alumina.38
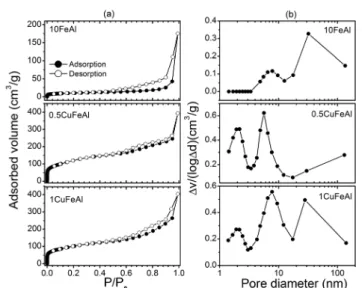
3.3. Textural and morphological properties of the solids Fig. 4 presents the N2 adsorption/desorption isotherms and
pore size distribution profiles of the samples calcined at 500 °C. The sample 10FeAl presents a typical isotherm profile of a macroporous material containing a low fraction of meso-pores, which is responsible for the type H3 hysteresis loop observed.39
Interestingly, after the wet impregnation with copper, the isotherm profiles changed significantly. The isotherm of the 10FeAl sample practically does not present a point of identifi-able monolayer formation, while for the 0.5CuFeAl and
Table 2 Hyperfine parameters of the Mössbauer spectra for the fresh mono- and bimetallic catalysts recorded at room temperature (300 K)
Samples IS, mm s−1 QS, mm s−1 R.A.% Fe species
10FeAl 0.218 1.02 61.2 Fe3+
0.193 1.60 38.8 Fe3+
0.5CuFeAl 0.197 0.82 49.7 Fe3+
0.198 1.32 50.3 Fe3+
1CuFeAl 0.207 0.78 56.8 Fe3+
0.198 1.19 27.4 Fe3+
0.204 1.62 15.7 Fe3+
IS = isomer shift, QS = quadrupole shift and R.A. = relative spectral area.
Fig. 3 H2-TPR profiles of the fresh samples calcined at 500°C. The
intensity of the signal for the 10FeAl sample was multiplied by 2.5.
Fig. 4 N2 adsorption/desorption isotherms (a) and BJH pore size
distribution from the desorption branch (b) for the fresh samples.
1CuFeAl samples, it is easily identified. Therefore, the sam-ples 0.5CuFeAl and 1CuFeAl should present a higher surface area, as presented in Table 3. Based on the IUPAC classifica-tion, the samples 0.5CuFeAl and 1CuFeAl show isotherm pro-files that seem to be a combination of types I and II, with an H4 hysteresis loop, which is typical of a mesoporous structure.39–41 However, the profiles also resemble the H3
hysteresis loop,39suggesting samples with a complex mixture
of pore shapes. For the 10FeAl sample, significant hysteresis loops at relative pressure (P/P0) above 0.50 and no distinct
uptake at low relative pressure are observed, which strongly suggests the predominance of macropores with the presence of mesopores and absence of microporosity.
On the other hand, the incorporation of copper by wet im-pregnation into the 10FeAl catalyst led to a notable change in the form of the isotherm. An increase in the volume of N2
adsorbed at a low relative pressure (P/P0<0.1) and a contin-uous increase of N2 adsorption along the entire adsorption
branch are observed. This indicates the formation of a new micro- and mesoporous structure on both bimetallic solids.41
From the pore size distributions (according to the BJH method) in Fig. 4(b), it can be seen that the 10FeAl sample is essentially a macroporous sample with a fraction of meso-pores. After impregnation of the 10FeAl catalyst with copper, it still shows the presence of macropores. On the other hand, the profiles point to the presence of micropores, in addition to the amount of mesopores improving for both bimetallic solids, 0.5CuFeAl and 1CuFeAl, if compared to that in the 10FeAl catalyst.
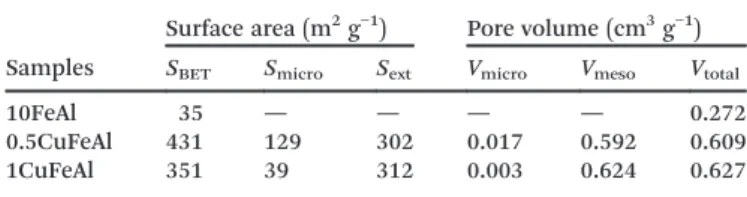
Table 3 shows the detailed textural characteristics of the catalysts. It is shown that the 10FeAl catalyst has a rather low surface area and pore volume, pointing to a predominance of macropores.
The copper impregnation has a large effect on the textural properties of the catalysts, such as the increase in BET sur-face area and pore volume. However, as supported by the presence of the point of identifiable monolayer formation and by thet-plot results (Table 3), after the addition of
cop-per, the sample presented the presence of micropores. This textural change can favour the formation of highly disperse copper species over the 10FeAl catalyst, the effect of which could be attributed to the rehydration/recrystallization pro-cess over surface alumina during the impregnation with
cop-per precursors, where small pores with a size of 3–4 nm are
generated.42 These modifications in textural properties
(Table 3) are consistent with the XRD changes (Fig. 1) ob-served for the CuFeAl catalysts. Therefore, during the wet im-pregnation with Cu2+, aluminium oxide rehydration occurs,
and with the slow water evaporation, the crystallization pro-cess takes place. The Al2O3rehydration process is consistent
with the increase in Fe content observed in Table 1, since a fraction of the Al may be lost during the process.
On the other hand, it is noticed that the sample with the highest copper content (1CuFeAl) shows a smaller surface area relative to the 0.5CuFeAl sample, and such a decrease is observed in the micropore range. Thus, the above results sug-gest that wet impregnation with a low amount of copper should improve the morphological properties of the alumin-ium oxide. However, a higher copper content could lead to deposition of a certain amount of oxide species into the po-rous structure of the support resulting in partial blocking of the pores, mainly micropores, and formation of larger meso-pores, as can be seen on the 1CuFeAl catalyst (Table 3).
The morphological aspects and elemental distribution of the solids are shown by SEM-EDS analyses (Fig. 5 and 6). The pure 10FeAl sample is composed of irregular and inhomoge-neous pores with a wide range of shapes and sizes (Fig. 5a). It has a typical shape due to the synthesis route applied.27The
majority of the pore width detected by N2adsorption belongs
to a range lower than that detectable by the magnification ap-plied in Fig. 5. However, the pore width observed by SEM for the 10FeAl sample is consistent with the pore distribution (Fig. 4), which pointed to the predominance of macropores.
Fig. 5 shows the evident change in the morphology of the samples after the incorporation of copper (Fig. 5b and c). Af-ter wet impregnation, the sponge-like morphology (Fig. 5a) is completely modified to platelet-shaped particles, whose aver-age size is evidently larger for the sample 1CuFeAl (Fig. 5c). The morphology change shown by SEM suggests that, in ad-dition to the recrystallization process, the increasing surface area and pore volume (Table 3) are also due to the change of the particle size and shape. The micropore volume decrease observed for the sample 1CuFeAl relative to the sample 0.5CuFeAl points to a significant contribution of the space between the particles, since a large particle size results in a lower total pore volume between the particles.
In order to evaluate the distribution of copper and iron species, SEM-EDS analyses were conducted (Fig. 6). Despite the low magnification of the EDS mapping image, the 10FeAl sample (Fig. 6a and b) demonstrates the presence of areas with predominance of aluminium (blue spots), which suggests that the sample has an inhomogeneous surface. For the bimetallic 0.5CuFeAl catalyst, the elemental EDS mapping also shows blue spots (Fig. 6c and d); however, they are small and lower in number. Similar properties are also observed for the 1CuFeAl sample (Fig. 6e). Therefore, the wet impregnation with Cu2+ should promote the
redispersion of the aluminium oxide by means of dissolu-tion of a fracdissolu-tion of the sample followed by recrystallizadissolu-tion.
Table 3 Textural characteristics of the solids studied, from the N2
ad-sorption/desorption isotherms
Samples
Surface area (m2g−1) Pore volume (cm3g−1)
SBET Smicro Sext Vmicro Vmeso Vtotal
10FeAl 35 — — — — 0.272
0.5CuFeAl 431 129 302 0.017 0.592 0.609 1CuFeAl 351 39 312 0.003 0.624 0.627
SBET = BET surface area. Smicro and Vmicro = micropore area and
volume calculated by thet-plot method.Vmeso= volume of mesopores
estimated from the equation:Vmeso=Vtotal−Vmicro.Vtotal= pore
vol-ume at aP/P0of 0.99.
In addition, the amount of copper added has an effect on the morphological properties of the sample, as suggested by the SEM-EDS images (Fig. 6). The sample 1CuFeAl presented a larger size of platelets, in addition to the higher ratio of aluminium/iron, pointing to the iron ratio decrease (spectral analysis). This is consistent with the dissolution followed by recrystallization, since the Al2O3 recrystallization process
may cover the iron oxide with the aluminium oxide. More-over, this surface property change can somehow affect the EDS signal. Indeed, it is important to emphasize that the atomic absorption spectroscopy results (Table 1) pointed to a higher iron amount for the sample 1CuFeAl.
3.4. The acidic and basic properties
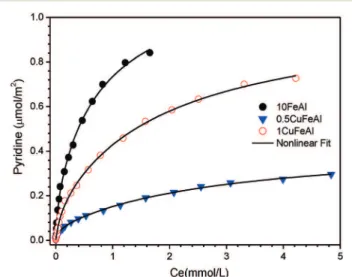
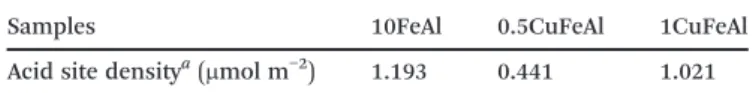
Equilibrium adsorption isotherms of pyridine at 25 °C were used to investigate the acidic properties of the catalysts. Fig. 7 shows the results of the amount of pyridine adsorbed per surface area with the corresponding curves, and Table 4
summarizes the total acid site densities calculated from the fit curves in Fig. 7, which correspond to the maximum amount of pyridine adsorption or complete monolayer forma-tion. The adsorption isotherm data of pyridine on the sam-ples can be adequately interpreted by nonlinear fitting to a Langmuir isotherm model (Fig. 7).
The profiles presented in Fig. 7 show a higher amount of pyridine adsorption on the 10FeAl sample. In addition, it shows a more pronounced slope at the lowest equilibrium concentration, suggesting the presence of stronger acid sites in the sample 10FeAl (Fig. 7). It is known that pyridine mole-cules interact with surface hydroxyl groups by hydrogen bonding forming pyridinium ions as well as with Lewis acid sites involving metal ions,43–45and both sites can exist on the
surface of the samples presented here. The addition of cop-per affects the acid site densities, as pointed out in Fig. 7. It is known that the Cu2+ interaction in the wet impregnation
process occurs on surface oxygen.46This process may result
in Brønsted acid site elimination with new Lewis acid site for-mation. However, the electronic properties of copper may also affect the strength of the nearest sites.47In fact, with the
addition of copper, the inclination of the curve and pyridine sorption capacity decrease, indicating weaker acid sites on the bimetallic copper–iron catalyst.
Fig. 5 SEM microphotographs of the catalysts: 10FeAl (a), 0.5CuFeAl (b) and 1CuFeAl (c).
Fig. 6 EDS mapping images with respective spectra of 10FeAl (a and b), 0.5CuFeAl (c and d) and 1CuFeAl (e and f) catalysts.
Fig. 7 Adsorption isotherms of pyridine measured on the catalysts at 25°C. The lines represent the Langmuir model isotherm.
A more significant change in the amount of pyridine adsorbed is observed for the sample with lower copper con-tent. The superior effect of copper for the sample with a lower amount is possible if the copper dispersion in the 0.5CuFeAl sample is higher than that in the 1CuFeAl sample, which is consistent with the TPR profile (Fig. 3).
Therefore, according to the literature,48,49these results
in-dicated that the addition of CuO should promote mainly a decrease in Brønsted acidity (acidic hydroxyl group) and lead to an increase of Lewis acid sites. Thus, it is reasonable to as-sume that this effect is dependent on the dispersion and interaction between the copper and iron oxide species on the alumina surface.
The surface basicity of the as-prepared 10FeAl and Cu–
FeAl composites was evaluated by CO2-TPD experiments, and
the corresponding curves are displayed in Fig. 8.
The CO2-TPD curves of all samples showed two types of
CO2 desorption peaks, one with the maximum temperature
range of 25 to 230°C and another broader peak between 230 and 430°C, which have been attributed to weak and moder-ate strength basic sites, respectively.24As proposed previously
by various authors,10,25,50,51 the peak at lower temperature
may be assigned mainly to CO2desorption from weakly basic
monodentate bicarbonate species formed due to the reaction of CO2 with the OH groups. The moderate strength basic
sites, however, are ascribed to the interaction of CO2with the
Lewis acid–base pairs (M+–O−), which form the monodentate
or the bidentate carbonate species. The CO2-TPD profiles
point to the effect of wet impregnation with copper on the CO2 adsorption ability. Considering the weak strength, a
higher amount of CO2 adsorption on the 10FeAl sample is
observed, in the proportion of 1.0, 0.74 and 0.86 for 10FeAl, 0.5CuFeAl and 1CuFeAl, respectively. These data suggest a higher density of–OH groups (hydroxyls) for these samples.
This result is consistent with the pyridine adsorption results (Fig. 7), since the addition of copper promotes a decrease of the –OH groups on the surface of the sample. However, the
modification of the 10FeAl catalyst with different amounts of copper oxide leads to a shift of the first peak of CO2
desorp-tion to a higher temperature region (from 80°C for 10FeAl to 134°C after copper loading). This suggests an increase of the strength of the basic sites on the surface for the Cu–FeAl
cata-lysts, which is consistent with the superior homogeneity of the surface suggested by the EDS mapping (Fig. 6). Therefore, the bimetallic Cu–FeAl composites with higher pore volume
pos-sess a more homogeneous surface basic site distribution, in ad-dition to their high surface area (see Table 3). However, despite the small amount of the moderate strength sites, the samples containing copper show a shift to higher temperature, which is more pronounced for the sample 1CuFeAl. Thus, the addition of copper plays an important role in both acidic and basic prop-erties of the Cu–Fe catalysts supported on alumina.52
3.5. Catalytic evaluation in ethanol–acetone conversion Here, the relationship of the surface acid–base and redox
properties with reaction activities of the mono- and bimetal-lic copper–iron-based catalysts for gas-phase ethanol–acetone
mixture conversion is discussed.
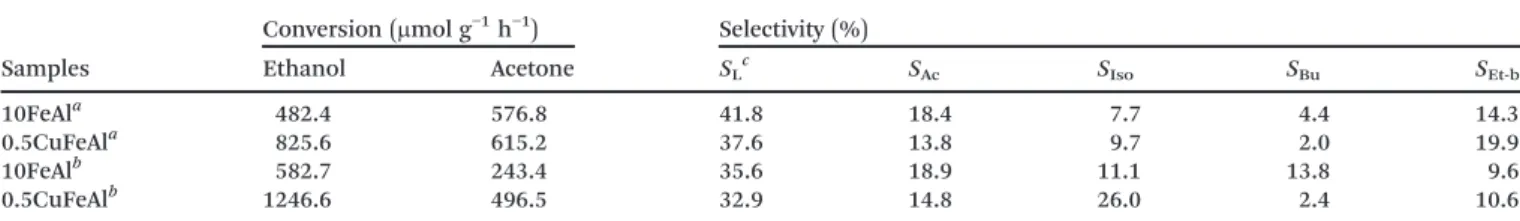
Effect of the ethanol/acetone molar ratio and nature of catalyst. The catalytic properties of the samples 10FeAl and 0.5CuFeAl were firstly examined by changing the composition of the reaction mixture. The ethanol (Et)-to-acetone (Ac) molar ratio (Et/Ac) was changed from 0.5 to 2.0, and the average cat-alytic conversion and product selectivity are shown in Table 5. As seen in Table 5, the 0.5CuFeAl sample, which presented the highest surface area (Table 3), as well as a lower surface density of acid sites (Fig. 7), shows a superior catalytic activ-ity for the conversion of both reactants (ethanol and/or ace-tone) in comparison to the single 10FeAl oxide. In addition, it is also clearly shown that the ethanol conversion is higher than the acetone conversion for both Et/Ac molar ratios stud-ied. This suggests that the bimetallic 0.5CuFeAl catalyst has a greater ability to adsorb ethanol, resulting in a solid with su-perior activity for gas-phase ethanol conversion.
The change of the surface properties due to the addition of copper is evident in the TPR experiments carried out on solids (Fig. 3). It was observed that copper makes the reduc-tion of iron oxide species (Fe3+to Fe2+) easier. Thus, the
com-bined redox and acid–base properties of the 0.5CuFeAl
cata-lyst can contribute to the highest activity observed. Considering the catalysts separately, it is observed that in-creasing the Et/Ac molar ratio from 0.5 to 2 resulted in an
Table 4 Surface acid site density determined from isotherms of pyridine adsorption, considering the Langmuir model for complete monolayer adsorption
Samples 10FeAl 0.5CuFeAl 1CuFeAl
Acid site densitya(μmol m−2) 1.193 0.441 1.021 aAmount of pyridine estimated by nonlinear fitting to the Langmuir
model.
Fig. 8 CO2-TPD curves of the 10FeAl and bimetallic Cu–FeAl catalysts.
The TCD signal from CO2-TPD was normalized by the surface area
(BET model, Table 3).
increase of the catalytic conversion of ethanol and a decrease of the acetone conversion. This may be due to the highest re-activity of ethanol as a polar protic reactant.
Another possibility is the competitive adsorption of etha-nol and acetone, which is also consistent, since an increase of the ethanol concentration should favour ethanol adsorp-tion to the detriment of acetone adsorpadsorp-tion. The increase of the ethanol conversion, due to the Et/Ac molar ratio increase, is more pronounced for the sample 0.5CuFeAl, and it is con-sistent with the ability of copper to catalyse dehydration/de-hydrogenation reactions of alcohols.4,7,24
Table 5 shows that both catalysts (10FeAl and 0.5CuFeAl) present higher selectivity to light products (methane, ethane, CO2). It is known that at high temperature (>300°C), side re-actions such as decomposition or cracking with cleavage of the carbon–carbon bond of reactants (ethanol and/or
ace-tone) are predominant.22 However, with the combination of
the acid–base and redox properties of the solids investigated,
the formation of useful chemicals, including acetaldehyde, isopropanol, butanal and 2-ethylbutanal, is observed, which are products of dehydrogenation with subsequent aldol con-densation and/or hydrogenation through a hydrogen transfer reaction using ethanol as the hydrogen donor.
Moreover, the results presented in Table 5 show that changing the composition of the reaction mixture has an ef-fect on the distribution of the products. For both Et/Ac molar ratios studied, the Lewis acid–base site pairs of the iron oxide
catalyst should dehydrogenate ethanol to acetaldehyde lead-ing to condensation products (butanal and 2-ethylbutanal). These condensation compounds are generatedviaa sequence
of complex mechanisms, combining consecutive dehydroge-nation/aldol condensation/dehydration and hydrogenation re-actions, as proposed elsewhere.15,53 Firstly, ethanol is
de-hydrogenated producing acetaldehyde, then it goes through cross-condensation to form the acetaldol (3-hydroxybutanal), which dehydrates to 2-butenal, followed by a hydrogenation reaction of the CC double bond to give butanal.16,54
Considering the 10FeAl catalyst, the increase in the Et/Ac molar ratio induced the increase in the selectivity to butanal, to the detriment of the selectivity to 2-ethylbutanal. There-fore, we propose that the synthesis of 2-ethylbutanal may go through a series of reactions. One possibility is the abstrac-tion of an acidic hydrogen atom at theα-position to the car-bonyl group of butanal, which may react with acetaldehyde
viaaldol condensation followed by a sequence of consecutive
dehydration/hydrogenation reactions (Scheme 1). In this reac-tion pathway, the combined pair of Lewis acid–base sites
plays an important role in the dehydration/dehydrogenation process, while redox species are known to be active for hydro-gen transfer reactions.55 The second possibility is the
2-butenal undergoing a new condensation reaction with acet-aldehyde, leading to 2-ethylbutanal, after the dehydration/de-hydrogenation reaction step (Scheme 1). This last reaction pathway is more likely since 2-butenal is more reactive than butanal. Additionally, the increase of the Et/Ac molar ratio fa-vours the hydrogen transfer process, which increases the butanal selectivity, similarly to isopropanol.
Therefore, the reactant conversion may be dependent on an adequate balance of active pairs of acid–base and redox
sites. In such a system, copper may play a significant role in the redox sites, leading to better catalytic performance of the
Table 5 Average catalytic activity and selectivity to light (SL), acetaldehyde (SAc), isopropanol (SIso), butanal (SBu) and 2-ethylbutanal (SEt-bu) products obtained with the 10FeAl and 0.5CuFeAl catalysts for different ethanol–acetone mixtures
Samples
Conversion (μmol g−1h−1) Selectivity (%)
Ethanol Acetone SLc SAc SIso SBu SEt-bu
10FeAla 482.4 576.8 41.8 18.4 7.7 4.4 14.3
0.5CuFeAla 825.6 615.2 37.6 13.8 9.7 2.0 19.9
10FeAlb 582.7 243.4 35.6 18.9 11.1 13.8 9.6
0.5CuFeAlb 1246.6 496.5 32.9 14.8 26.0 2.4 10.6
Reaction conditions:T= 350°C;w= 0.1 g; time on stream: 5 h; total flow: 30 mL min−1.aEt/Ac molar ratio = 0.5.bEt/Ac molar ratio = 2. cLight products: methane, ethane, ethene, CO
2.
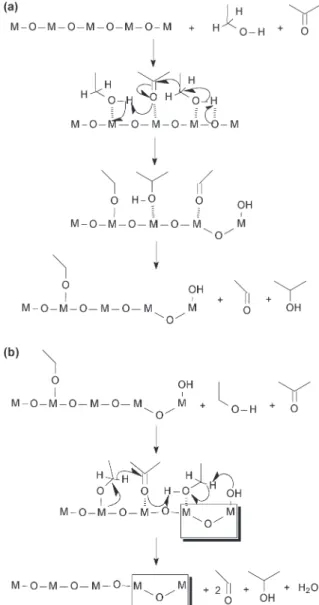
Scheme 1 Proposed consecutive reactions for the conversion of ethanol–acetone (350 °C) over bimetallic 0.5CuFeAl catalysts
containing acid–base and redox sites.
bimetallic catalyst. This result can be confirmed by H2-TPR
experiments and acid–base data of the solids (Fig. 3 and
8 and Table 4).
It should also be noted that the increase in the Et/Ac mo-lar ratio leads to changes in the product distribution over the 0.5CuFeAl catalyst, with a meaningful increase in the forma-tion of isopropanol. Furthermore, the selectivity to iso-propanol increases with the addition of copper and with the Et/Ac molar ratio increase. This result seems to have a direct correlation with the ethanol conversion; thus, the iso-propanol selectivity depends strongly on the molar ratio be-tween the reactants. According to the literature,17,19
iso-propanol is generated from acetone via a hydrogen transfer
mechanism, which comes from dehydrogenation of ethanol to acetaldehyde with effective participation of Lewis acid–
base site pairs (Scheme 2a). However, the occurrence of a drogen transfer process with the participation of surface hy-droxyl groups is also possible (Scheme 2b).
On the other hand, it is well known that copper-based cat-alysts are very active for dehydrogenation reactions of alco-hols to aldehydes.7 Additionally, we have reported recently
that Cu species play an important role in the redox and acid–
base properties of transition metal oxides, which could catal-yse hydrogen transfer reactions with reduction of intermedi-ate chemicals.23Therefore, the higher conversion of acetone
observed for the 0.5CuFeAl sample may be due to decomposi-tion reacdecomposi-tions, but mainly to the increase in isopropanol pro-duction. Based on the experimental results and the literature information, we propose a reaction sequence for ethanol–
ace-tone mixture conversion with the participation of acid–base
and redox sites present on the catalysts studied (see Schemes 2a and b). The portion highlighted with a rectangle represents a partially reduced site.
In Scheme 2a, it is proposed that a hydrogen (hydride) transfer from the ethanol adsorbed on the Lewis acid–base
site pairs to the acetone adsorbed on a Lewis acid site occurs. Concomitantly, the acetone's oxygen abstracts the hydrogen (H+) from the second ethanol molecule adsorbed, which may
form an ethoxy on the catalyst surface, with the formation of isopropanol. The adsorption of a new acetone molecule, near the ethoxy, and a hydride transfer may occur and, with the participation of a new ethanol molecule, another isopropanol is formed with partial reduction of the catalyst (Scheme 2b).
On the other hand, although hydrogen transfer reactions can indeed take place in both mono- and bimetallic catalysts, with low or high Et/Ac molar ratios, the selectivity to iso-propanol is considerably lower for the unmodified 10FeAl cat-alyst. Based on this result, ethanol can be dehydrogenated to acetaldehyde over a catalyst containing copper or iron oxide, but the improved redox properties of dual sites play a key role in the hydrogen transfer reaction mechanism, where ace-tone can be easily reduced to isopropanol with the metal re-dox site (Cu+/Cu0and Fe2+) supports.
Effect of reaction temperature and copper content. After choosing the better feed composition (Et/Ac ratio), the effect of the temperature on the catalytic performance was
evalu-ated for the bimetallic (0.5CuFeAl) catalyst and the results are depicted in Fig. 9.
The results in Fig. 9a show that the conversion of both re-actants (ethanol and acetone) decreased with time-on-stream at both temperatures of the reaction (300°C or 350°C). Gen-erally, this result is attributed to loss of the active sites caused by the deposition of carbon species on the catalyst surface, which is mainly observed at high reaction tempera-tures.56In addition, acetone is a polar aprotic chemical and
consequently is less reactive than ethanol in any temperature studied. Reactant conversion increases with increasing perature due to thermodynamic reasons, since higher tem-peratures favour the endothermic reactions such as decompo-sition, dehydrogenation and dehydration.7,53
Fig. 9b shows the effect of temperature on the selectivity to main reaction products. As can be seen, at higher reaction temperature (350 °C), the selectivity to light products obtained from decomposition of the reactants is superior
Scheme 2 Proposed reaction mechanism for hydrogen transfer from ethanol to acetone over catalysts containing acid-basic and redox sites. (a) Lewis acid-base site pairs, (b) hydroxyl groups.
compared to the dehydrogenation (acetaldehyde), hydrogena-tion (isopropanol) and aldol condensahydrogena-tion (2-ethylbutanal and butanal) products. In contrast, decreasing the reaction temperature to 300°C results in an increase in the selectivity to acetaldehyde and butanol. However, the isopropanol selec-tivity achieved is nearly the same, while the selecselec-tivity to light products decreases by nearly 1/3 (Fig. 9b). At 300°C, a higher amount of acetaldehyde is formed, despite the dehydrogena-tion reacdehydrogena-tions being typically endothermic.7,57,58This change
in the product selectivity points to ethanol as the main source of the light products (methane, ethane, and ethene). The dehydrogenation of ethanol may generate acetaldehyde and adsorbed hydrogen59 or ethoxy (Schemes 3a and b).
Thus, ethanol acts as a hydrogen source, resulting in the rapid reduction of acetone to isopropanol over active Cu+/Cu0
and/or Fe2+redox sites of the Cu
–FeAl catalyst. This is
consis-tent with the TPR results, which point to an easier reducibil-ity of the CuFeAl catalyst. The direct hydrogen transfer to ace-tone (Schemes 2a and b) should not be ruled out. Therefore, our experiments show that acetone acts as the reactant for isopropanol formation, the reaction of which is limited by the hydrogen obtained from dehydrogenation of ethanol to acetaldehyde. Additionally, experiments carried out at 300°C also show a noticeable amount of butanol (6.7%). In accor-dance with the findings,53,54butanol formation involves
path-ways which proceed through acetaldehyde self-aldolization with consecutive dehydration and hydrogenation of interme-diates (Scheme 1).
Fig. 9b suggests that the selectivity to butanol and butanal becomes negligible compared to the other chemicals formed,
such as acetaldehyde, isopropanol and 2-ethylbutanal. How-ever, by decreasing the reaction temperature, the selectivity to butanol increases from 3% to 6%, which is prejudicial to the posterior aldol condensation for 2-ethylbutanal forma-tion. Consequently, it may increase the acetaldehyde selectivity.
In heterogeneous catalysis, the combined multi-functional pathway requires an active site with different functionality and chemical nature in order to complete the complex net-work of reaction mechanisms very efficiently.60The
combina-tion of redox and acid–base active sites on the CuFeAl
cata-lyst should provide the required bi-functionality for the ethanol–acetone conversion to highly valuable chemicals.
Thus, we have investigated the effect of the copper content increase from 0.5 to 1% over bimetallic copper–iron catalysts
on the reactant conversion and product distribution, and the results are shown in Fig. 10.
The catalytic performance of the solids presented in Fig. 10a and b clearly indicates better catalytic activity (con-version of both reactants), for the sample with higher copper content (1CuFeAl). In addition, the data also suggests that the increase in copper amount also contributes to an im-provement in the catalytic stability. According to the N2
ad-sorption experiments (Fig. 4 and Table 3), both samples are mesoporous; however, the increase of copper content in the catalyst composition promotes a decrease in the total (BET) and microporous surface area with a consequent increase of the pore size. Therefore, the catalytic conversion results are consistent with the highest porosity of the 1CuFeAl catalyst, which contributes to easier reactant and product diffusion in the catalyst pores leading to better catalytic performance. Ad-ditionally, its higher activity for reactant conversion should also be due to the higher density of acid–base active sites on
the surface of the 1CuFeAl catalyst than that of the 0.5CuFeAl sample (Fig. 7 and 8). Consequently, the catalytic perfor-mance highlights the contribution of both catalyst acid–base Fig. 9 Effect of reaction temperature on the catalytic performance of
the 0.5CuFeAl sample: (a) conversion, (b) product selectivity. Et/Ac ratio = 2.
Scheme 3 Proposed reaction mechanism for ethanol dehydrogenation over catalysts containing acid-basic and redox sites. (a) Acetaldehyde or (b) ethoxy formation.
characteristics and porosity to the conversion of reactants (ethanol and acetone).
As pointed out previously (Fig. 10b), the higher Cu content improved the catalytic conversion and stability for both reac-tants. Unfortunately, there is an increase in the selectivity to decomposition products (Fig. 10d) and a decrease in the 2-ethylbutanal ratio. This result confirms again that at the high reaction temperature employed, the decomposition reac-tions of reactant molecules are favoured, mainly for the 1CuFeAl catalyst. However, this higher selectivity for decom-position products is consistent with the relative acidic site density determined using pyridine adsorption isotherms (Fig. 7), which showed that the 1CuFeAl sample has much more acid sites than the 0.5CuFeAl sample.
Interestingly, both samples (0.5CuFeAl and 1CuFeAl) pres-ent the same selectivity to acetaldehyde, but a little increase of isopropanol selectivity is observed for the sample 1CuFeAl (Fig. 10d). It is known that the reduced copper species (Cu+/
Cu0) generated during the process present a good
dehydroge-nation ability.7 Hence, the interaction between copper and
iron species in the bimetallic Cu–Fe catalyst may result in the
formation of a higher concentration of reduced metal species (Cu+, Cu0 and Fe2+) highly active in the catalytic process
to-ward dehydrogenation/dehydration as well as hydrogen trans-fer reactions. The maintenance of selectivity to acetaldehyde and isopropanol with suppression of that to 2-ethylbutanal, due to the copper content increase, points to the requirement of a catalyst with a higher copper dispersion in order to pro-duce a superior amount of condensation products.
The product selectivity profile for the sample with a higher amount of copper (Fig. 10d) clearly points out the effect of the formation of reduced species on the hydrogen transfer. The partial reduction process, which occurs mainly on the first hour of time-on-stream, improves the isopropanol pro-duction. In the same range of reaction time, a little decrease in acetaldehyde and 2-ethylbutanal and an increase in the light products are observed. This behaviour may suggest that the partially reduced catalyst presents a lower dehydrogena-tion activity, which decreases the acetaldehyde selectivity. Consequently, the amount of products from acetaldehyde condensation also decreases. However, the partially reduced catalyst presents superior isopropanol production by the hy-drogen transfer process.
Therefore, the little increase of the selectivity for the light products, followed by the decrease of the ethanol conversion (Fig. 10b), points to a surface property change of the catalyst.
3.6. Characterization of spent catalysts
In order to find a correlation between the catalyst properties and catalytic performance, characterization of the spent cata-lysts by thermal analysis (TGA/DTA), H2-TPR and Mössbauer
spectroscopy was carried out.
Fig. 11 shows the thermal analysis profiles. All the cata-lysts present a first mass loss event (endothermic) up to near 220 °C, followed by a second event (exothermic), which ex-tends up to 600 °C. The first, at lower temperature, is due to desorption of the physically adsorbed water, ethanol or ace-tone. The second range (220–600°C) is due to carbonaceous material burning (alkoxides on the surface), whereas the
Fig. 10 Effect of Cu content on the catalytic performance of CuFeAl catalysts: (a and c) ethanol and acetone conversion; (b and d) product selectivity.T= 350°C, time = 5 h, Et/Ac molar ratio = 2.
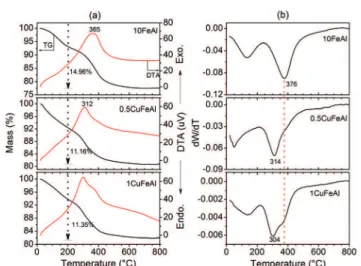
Fig. 11 TGA/DTA (a) and DTG (b) curves of the spent catalysts obtained under synthetic air flow. Reaction temperature of 350°C and
Et/Ac molar ratio of 2.
inflexion point at 300°C or 370°C is relatively low to be con-sidered coke burning.25,61 All the catalysts show nearly the
same amount of mass loss in the temperature range of 220 to 600 °C: 15 wt% for the 10FeAl sample and 11 wt% for the samples containing copper. Interestingly, the samples 0.5CuFeAl and 1CuFeAl present two inflexion points (DTA and DTG) in the range of 220 to 600 °C, while the sample 10FeAl shows only one in the same temperature range. The new inflexion point near 310°C suggests burning of the alk-oxide, which is formed at the copper surface. Therefore, the burning of the alkoxide at the copper surface occurs at lower temperature comparatively to the alkoxide on the surface of the iron site. Additionally, since the event near 310°C is at-tributed to the alkoxide burning from the copper surface, a careful analysis of the profile change due to the copper amount increase shows that the burning event near 310°C is more pronounced for the sample 0.5CuFeAl. This is consis-tent with the higher copper dispersion suggested by the TPR profile for the sample 0.5CuFeAl.
This behaviour, together with the lower surface area, can explain the lower catalytic conversion for the sample 10FeAl, since a stronger interaction means a lower desorption rate and consequently fewer available sites.
The TPR profiles of the spent catalysts, 10FeAl and 0.5CuFeAl, are presented in Fig. 12. The 10FeAl sample shows two maxima of H2 consumption, the first near 560 °C and
the second near 800 °C, which are similar to those of the fresh sample (Fig. 3). However, the spent catalyst (10FeAl) presents a shoulder at 350 °C, which is not evident in the fresh sample. The temperature of 350°C for iron oxide reduc-tion is characteristic of Fe3+ partial reduction,12,27 without
the support effect. Therefore, the H2consumption profile
ob-served for the 10FeAl sample points to the occurrence of a sintering process, at lower extension. The sintering process causes an increase of the iron oxide particle diameter, which consequently presents a lower support effect on the redox properties. Increasing the Et/Ac molar ratio results in a lower amount of H2 consumption in the range of 200 to 600 °C,
and the shoulder at 350 °C is less significant. This profile change, to lower H2 consumption, points to superior partial
reduction of the iron oxide during the catalytic process with Et/Ac = 2.
The TPR profile of the sample 0.5CuFeAl presents a signif-icant change after the catalytic process. While the fresh sam-ple presents only one H2 consumption band (Fig. 3), which
was assigned to the high copper oxide dispersion, the TPR profile of the spent sample shows three H2 consumption
bands. The first, near 400°C which is the temperature corre-sponding to maximum H2consumption, is similar to that in
the fresh sample (Fig. 3). The H2 consumption peaks near
600°C and higher than 800 °C are ascribed to iron oxide re-duction. The last one is due to Fe2+reduction to Fe0, while
the band at 600°C is due to Fe3+reduction to Fe2+and reduc-tion of a fracreduc-tion of Fe2+to Fe0.
Therefore, similarly to the 10FeAl sample, the TPR profile points to the sintering process during the catalytic reaction.
The sintering promotes the copper dispersion decrease, which is consequently ascribed to the typical reduction of iron oxide in the TPR profile. As pointed out for the 10FeAl sample, the Et/Ac molar ratio has an effect on the sintering process, since a higher ethanol amount results in a shoulder at 226 °C, which is characteristic of CuO reduction (Cu2+),62,63pointing out that this species (CuO) is formed
un-der reaction conditions of higher ethanol/acetone molar ratio (Fig. 12b).
That is, during the catalytic process, the surface properties of the 0.5CuFeAl sample are modified to a certain extent. However, the superior H2consumption with a maximum near
400 °C points to the maintenance of a high fraction of sites with the same properties as the fresh sample (Fig. 3).
On the other hand, the presence of Cu+ should not be
ruled out since the reduction of Cu+may occur in the
temper-ature range of 300 to 430 °C.63 The new sites, with H2 con-sumption in a temperature range higher than 500 °C (Fig. 12b), are similar to those observed in the 10FeAl sample, with lower relative intensity, however.
Therefore, these surface changes observed by TPR experi-ments are consistent with the TG results, which showed two inflexion points in the range of 220 to 600°C for the samples containing copper oxide (Fig. 11). The inflexion point at 375 °C is due to the alkoxide burning from the iron oxide surface, while that at 310 °C is due to the alkoxide from the region rich in copper oxide.
The partial reduction of the iron oxide during the catalytic process is also evidenced in the Mössbauer spectra obtained at room temperature for the spent samples (Fig. 13).
The corresponding hyperfine parameters are summarized in Table 6. The profile spectra and the hyperfine parameters are similar to those of the fresh samples. However, all the samples show the formation of at last one new doublet, which is due to the presence of Fe2+, as pointed out in
Table 6.
On the other hand, the relative spectral area of Fe2+and
Fe3+ shows that the addition of copper produces a lower
amount of Fe2+during the reaction process. This suggests a
rather reduction of the copper oxide under the experimental conditions applied. The Fe2+relative spectral area is 33.8, 8.2
and 19.9% for 10FeAl, 0.5CuFeAl and 1CuFeAl, respectively
Fig. 12 H2-TPR analysis of spent catalysts in the reaction carried out
at 350 °C and an Et/Ac molar ratio of 0.5 or 2: (a) 10FeAl and (b)
0.5CuFeAl samples.
(Table 6). The non-linear correlation may be due to the lower iron oxide dispersion of the sample 1CuFeAl suggested by the Mössbauer spectra, which present a doublet with a lower QS (0.80) and an RA of 47.8%. This suggests a higher iron oxide fraction with a superior symmetric environment,64,65which is
consistent with a higher particle diameter, despite the fact that the XRD patterns (Fig. 1) do not present any diffraction peak from the Fe2O3 phase. It is important to note that this
finding is consistent with the TPR results (Fig. 3 and 12). Therefore, the decrease in catalytic activity observed in Fig. 9 and 10 may be due to several factors. The deposition of carbonaceous materials may cause catalyst deactivation (Fig. 12). Similarly, the sintering or segregation phenomenon during the catalytic reaction has an effect on the active sur-face area. Additionally, the partial reduction of the active phase during the catalytic process, as pointed out by Mössbauer spectroscopy (Fig. 13), should contribute to the
fall in stability, which is consistent with the reaction pathway proposed in Schemes 2b and 3.
The partial reduction of the metal oxide (CuO or Fe2O3)
in the dehydrogenation of ethanol may occur by various ways, with participation of the surface hydroxyl groups (Schemes 2b and 3), or in the Lewis acid–base site pair
(Scheme 2a). All of the proposed reaction pathways imply a redox process with the oxidation of ethanol and the reduction of acetone and/or the metal oxide.
4. Conclusion
The role of combined acid–base and redox sites on copper–
iron catalysts supported on γ-alumina in ethanol–acetone
mixture conversion was investigated by consecutive dehydro-genation–condensation or by dehydrogenation–
hydrogena-tion through hydrogen transfer reachydrogena-tions, leading to valuable chemicals. The results point out that reaction parameters such as the temperature and reactant molar ratio affect the catalytic performance; however, the modification of textural, acidic/basic and redox properties on the surface of the cata-lysts has a strong effect. The characterisation of the samples shows that the high surface area and dispersion of copper and iron species produce an adequate balance between the acid–base and redox active sites towards an efficient catalyst.
Furthermore, the addition of an adequate CuO amount posi-tively modifies the surface properties such acid–base pairs
on the FeAl catalyst, which results in lower decomposition of the reactants. TPR and Mössbauer measurements after the catalytic test for the 0.5CuFeAl catalyst pointed out the role of the reduced species (Cu1+/Cu0and Fe2+) in the
hydro-gen transfer reaction, which resulted in an increase of the isopropanol selectivity, to the detriment of the condensation products.
Conflicts of interest
There are no conflicts to declare.
Acknowledgements
The authors acknowledge the “Federal University of Ceará”,
the Brazilian research-funding support agency CNPq (427684/ 2016-1), UFC/CT-INFRA/MCTI-SISNANO/CAPES, Dr. J. M. Sasaki (X-ray laboratory) and Central Analytical of UFC for SEM-EDX analyses.
References
1 A. Galadima and O. Muraza, J. Taiwan Inst. Chem. Eng.,
2016,67, 29–44.
2 P. S. Nigam and A. Singh, Prog. Energy Combust. Sci.,
2011,37, 52–68.
3 J. Sun and Y. Wang,ACS Catal., 2014,4, 1078–1090.
4 J. M. R. Gallo, J. M. C. Bueno and U. Schuchardt, J. Braz. Chem. Soc., 2014,25, 2229–2243.
Fig. 13 Room-temperature Mössbauer spectra (300 K) of spent catalysts in the reaction carried out at 350°C and an Et/Ac molar ratio of 2.
Table 6 Hyperfine parameters of the Mössbauer spectra for the spent mono- and bimetallic catalysts recorded at room temperature (300 K). Reaction conditions:T= 350°C, Et/Ac = 2
Samples IS, mm s−1 QS, mm s−1 R.A.% Fe species
10FeAl 0.298 0.96 66.2 Fe3+
0.722 2.32 24.2 Fe2+
1.053 2.35 9.6 Fe2+
0.5CuFeAl 0.210 0.82 58.7 Fe3+
0.212 1.31 33.0 Fe3+
0.789 2.12 8.2 Fe2+
1CuFeAl 0.226 0.80 47.8 Fe3+
0.230 1.28 32.2 Fe3+
0.727 2.26 19.9 Fe2+
IS = isomer shift, QS = quadrupole shift, R.A. = relative spectral area.
5 A. J. Vizcaíno, A. Carrero and J. A. Calles, Int. J. Hydrogen Energy, 2007,32, 1450–1461.
6 D. Z. Mezalira, L. D. Probst, S. Pronier, Y. Batonneau and C. Batiot-Dupeyrat,J. Mol. Catal. A: Chem., 2011,340, 15–23.
7 R. M. Rioux and M. A. Vannice, J. Catal., 2003, 216, 362–376.
8 T. K. Phung, L. P. Hernández, A. Lagazzo and G. Busca,Appl. Catal., A, 2015,493, 77–89.
9 W. Alharbi, E. Brown, E. F. Kozhevnikova and I. V. Kozhevnikov,J. Catal., 2014,319, 174–181.
10 R. C. R. Santos, A. N. Pinheiro, E. R. Leite, V. N. Freire, E. Longhinotti and A. Valentini,Mater. Chem. Phys., 2015,160, 119–130.
11 B. Chen, J. Lu, L. Wu and Z. Chao,Chin. J. Catal., 2016,37, 1941–1948.
12 T. P. Braga, A. N. Pinheiro, C. V. Teixeira and A. Valentini,
Appl. Catal., A, 2009,366, 193–200.
13 L. Faba, E. Díaz and S. Ordóñez,Appl. Catal., B, 2013,142–
143, 387–395.
14 O. Kikhtyanin, D. Kubička and J. Čejka, Catal. Today, 2015,243, 158–162.
15 L. Wu, T. Moteki, A. A. Gokhale, D. W. Flaherty and F. D. Toste,Chem, 2016,1, 32–58.
16 Z. D. Young, S. Hanspal and R. J. Davis,ACS Catal., 2016,6, 3193–3202.
17 H. V. Fajardo, L. F. D. Probst, A. Valentini, N. L. V. Carreño, A. P. Maciel, E. R. Leite and E. Longo, J. Braz. Chem. Soc.,
2005,16, 607–613.
18 G. Onyestyák, G. Novodárszki, Á. Farkas Wellisch and A. Pilbáth,Catal. Sci. Technol., 2016,6, 4516–4524.
19 V. A. Ivanov, J. Bachelier, F. Audry and J. C. Lavalley,J. Mol. Catal., 1994,91, 45–59.
20 T. P. Braga, A. N. Pinheiro, E. R. Leite, R. C. R. dos Santos and A. Valentini,Chin. J. Catal., 2015,36, 712–720.
21 D. Scholz, C. Aellig and I. Hermans,ChemSusChem, 2014,7, 268–275.
22 A. Konaka, T. Tago, T. Yoshikawa, A. Nakamura and T. Masuda,Appl. Catal., B, 2014,146, 267–273.
23 J. Sun, R. A. L. Baylon, C. Liu, D. Mei, K. J. Martin, P. Venkitasubramanian and Y. Wang, J. Am. Chem. Soc.,
2016,138, 507–517.
24 R. C. R. Santos, D. M. V. Braga, A. N. Pinheiro, E. R. Leite, V. N. Freire, E. Longhinotti and A. Valentini, Catal. Sci. Technol., 2016,6, 4986–5002.
25 T. P. Braga, N. Essayem and A. Valentini,RSC Adv., 2015,5, 93394–93402.
26 X. Lin, R. Li, Y. Zhang, Y. Zhan, C. Chen, Q. Zheng and J. Ma,Int. J. Hydrogen Energy, 2015,40, 1735–1741.
27 Z. Bao, K. Xiao, X. Qi, X. Wang, L. Zhong, K. Fang, M. Lin and Y. Sun,J. Energy Chem., 2013,22, 107–113.
28 A. Valentini, N. L. V. Carreño, L. F. D. Probst, A. Barison, A. G. Ferreira, E. R. Leite and E. Longo, Appl. Catal., A,
2006,310, 174–182.
29 T. P. Braga, B. M. C. Sales, A. N. Pinheiro, W. T. Herrera, E. Baggio-Saitovitch and A. Valentini, Catal. Sci. Technol.,
2011,1, 1383–1392.
30 E. P. Barrett, L. G. Joyner and P. P. Halenda, J. Am. Chem. Soc., 1951,73, 373–380.
31 W. D. Harkins and G. Jura,J. Am. Chem. Soc., 1944,66, 1362–1366.
32 I. V. Murin, V. M. Smirnov, G. P. Voronkov, V. G. Semenov, V. G. Povarov and B. M. Sinel'nikov, Solid State Ionics,
2000,133, 203–210.
33 M. Liu, H. Li, L. Xiao, W. Yu, Y. Lu and Z. Zhao, J. Magn. Magn. Mater., 2005,294, 294–297.
34 I. Nedkov, T. Merodiiska, L. Milenova and T. Koutzarova,
J. Magn. Magn. Mater., 2000,211, 296–300.
35 K. Al-Dalama and A. Stanislaus,Thermochim. Acta, 2011,520, 67–74.
36 M. Jabłońska,Catal. Commun., 2015,70, 66–71.
37 J. L. Pinilla, R. Utrilla, R. K. Karn, I. Suelves, M. J. Lázaro, R. Moliner, A. B. García and J. N. Rouzaud, Int. J. Hydrogen Energy, 2011,36, 7832–7843.
38 Z. Z. Qin, X. H. Zhou, T. M. Su, Y. X. Jiang and H. B. Ji,
Catal. Commun., 2016,75, 78–82.
39 A. H. Fakeeha, A. A. Ibrahim, W. U. Khan, K. Seshan, R. L. Al and A. S. Al-fatesh, Arabian J. Chem., 2016, DOI: 10.1016/j.
arabjc.2016.06.012.
40 M. Thommes, K. Kaneko, A. V. Neimark, J. P. Olivier, F. Rodriguez-Reinoso, J. Rouquerol and K. S. W. Sing, Pure Appl. Chem., 2015,87, 1051–1069.
41 T. K. Phung, A. Lagazzo, M. Á. Rivero Crespo, V. Sánchez Escribano and G. Busca,J. Catal., 2014,311, 102–113.
42 S. Storck, H. Bretinger and W. F. Maier, Appl. Catal., A,
1998,174, 137–146.
43 G. Li, Y. Liu, Z. Tang and C. Liu,Appl. Catal., A, 2012,437–
438, 79–89.
44 S. Zhu, P. R. F. Bell and P. F. Greenfield, Fuel, 1988, 67, 1316–1320.
45 H. Bouyarmane, S. El Asri, A. Rami, C. Roux, M. A. Mahly, A. Saoiabi, T. Coradin and A. Laghzizil, J. Hazard. Mater.,
2010,181, 736–741.
46 L. del R. Silva-Calpa, P. C. Zonetti, D. C. de Oliveira, R. R. de Avillez and L. G. Appel,Catal. Today, 2017,289, 264–272.
47 H. Zhan, S. Huang, Y. Li, J. Lv, S. Wang and X. Ma, Catal. Sci. Technol., 2015,5, 4378–4389.
48 Z. Fu, J. Wang, N. Zhang, Y. An and Z. Yang,Int. J. Hydrogen Energy, 2015,40, 2193–2198.
49 W. Yu, J. Zhu, L. Qi, C. Sun, F. Gao, L. Dong and Y. Chen,
J. Colloid Interface Sci., 2011,364, 435–442.
50 W. Peng, J. Li, B. Chen, N. Wang, G. Luo and F. Wei,Catal. Commun., 2016,74, 39–42.
51 J. I. Di Cosimo, V. K. Díez, M. Xu, E. Iglesia and C. R. Apesteguía,J. Catal., 1998,178, 499–510.
52 T. Wang, L. Qi, H. Lu and M. Ji, Biochem. Pharmacol.,
2017,17, 162–169.
53 F. C. Meunier, J. Scalbert and F. Thibault-Starzyk, C. R. Chim., 2015,18, 345–350.
54 K. K. Ramasamy, M. Gray, H. Job, C. Smith and Y. Wang,
Catal. Today, 2016,269, 82–87.
55 Y. Liu, H. Tüysüz, C.-J. Jia, M. Schwickardi, R. Rinaldi, A.-H. Lu, W. Schmidt and F. Schüth, Chem. Commun., 2010,46, 1238–1240.