BI
BL
IOM
ETRI
C
FA
C
TORS
ASSO
CI
ATE
D
WI
TH
H-IN
DE
X
143
1Universidad San Ignacio de Loyola, Unidad de Ranking. Av. La Fontana 550, La Molina, Lima, Peru. E-mail: <[email protected]>. Received in 10/30/2012, resubmitted on 10/19/2013 and approved in 1/27/2014.
Bibliometric factors associated with h-index
of Peruvian researchers with publications
indexed on Web of Science and
Scopus databases
Fatores bibliométricos associados ao índice h
de pesquisadores peruanos com publicações
indexadas nas bases de dados
Web of Science e Scopus
Carlos VÍLCHEZ-ROMÁN1
Abstract
The objective of this article is: a) to identify Peruvian researchers with high, medium and low impact factor according to Web of Science and Scopus databases; b) to identify the bibliometric factor with the highest influence on h-index of Peruvian researchers; c) to compare h-index between Web of Science and Scopus, at an individual and institutional level. Data were collected from Web of Science and Scopus (189 Peruvian researchers, 28 institutions on Web of Science and 33 on Scopus), between September 18-23, 2013. Then, institutional registries were created and linear regression analysis with stepwise procedure was run to identify bibliometric factors with higher influence on the h-index of Peruvian researchers. Web of Science and Scopus showed interesting simmilarities in the h-index of Peruvian academic institutions. At individual level, documents indexed in citation database had the highest influence on the h-index. Regression model identified bibliometric factors with higher influence on the h-index of Peruvian researchers, however further large scale studies are needed to improve external validity.
Keywords:Bibliometrics indicators. H-index. Peruvian researchers. Scientific production.
Resumo
Os objetivos deste artigo são: a) identificar os pesquisadores peruanos com alto, médio e baixo impacto de acordo com as bases de dados Web of Science e Scopus; b) identificar o fator bibliométrico com maior influência sobre o índice h dos pesquisadores peruanos; c) comparar o índice h entre Web of Science e Scopus, em âmbito individual e institucional. Foram recuperados dados das bases Web of Science e Scopus entre 18 e 23 de setembro de 2013 (189 pesquisadores peruanos em Scopus, 28 instituições no Web of Science e 33 no Scopus). Foram criados registros individuais e institucionais e se realizada análise de regressão linear com procedimento passo a passo para identificar os fatores bibliométricos com maior influência no índice h de pesquisadores peruanos. As bases de dados Web of Science e Scopus mostraram similitudes interessantes no índice h das instituições peruanas. A nível individual, os documentos indexados na base de dados de citação tiveram maior influência sobre o índice h. O modelo de regressão identificou fatores bibliométricos com alta influência no índice h de pesquisadores peruanos, porém recomenda-se a realização de estudos de grande escala para melhorar a validade observada.
C.
VÍ
LCHE
Z-ROM
ÁN
144
Introduction
When it comes to measuring the influence - from a bibliometric point of view - of individual researchers or academic institutions, the recommended indicator is an index proposed by the Argentinean physicist Jorge Hirsch in 2005: Hirsch index or h-index, which is based on the number of published papers and citations for such work. As an example, if an author has an h-index of 5, he/she has published, on average, five papers, each of which has been cited in other papers at least 5 times (Hirsch, 2005). In that sense, it is a measure that summarizes in a single indicator the output impact of each researcher.
Based on the h-index, other indicators have been developed (g-index, h weighted index, etc.) as publication speed and size of the research community is not the same across all disciplines. Because new indicators have been criticized for their limited scope and have not been tested as intensively as h-index, Bibliometrics and Scientometrics specialists still base their calculations on the index proposed by Jorge Hirsch.
Advantages and disadvantages of h-index
The first positive aspect of the h-index is the easy interpretation of data since a single indicator can show the productivity and impact of the published work of a researcher. Secondly, it is an easy-to-calculate indicator because if you have reliable citation databases containing the names of authors and registrated institutions properly normalized, computation is fairly straightforward; furthermore, in some citation databases (Web of Science ( WoS) and Scopus), the h-index is calculated automatically. The indicator is harder to manipulate than the impact factor (although it should be noted that all measurements are subject to manipulation and bias) because it is based on individual tracking of each researcher’s academic output, which makes it a robust indicator. Finally, it is possible to calculate different values of expected ranges ([5 - 15], [10 - 20], etc.) for different disciplines since the publication rate and size of the research community differ among disciplines.
The main negative aspect is that the h-index tends to penalize young researchers or those who are at the beginning of their scientific careers. Researchers who
have more publications (i.e., senior researchers or those with a longer careers) will have an advantage over those who have fewer papers published (Bornmann & Daniel, 2005; Van Raan, 2006; Costas & Bordons, 2007; Oppenheim, 2007). On the other hand, rather than a weakness, the risk of using the Hirsch index is that some institutions that do not have enough time or capital to establish peer-review-based evaluation committees will prefer to use a single indicator to evaluate the impact of individual researchers. This trend will likely continue in coming years as there will be: a) less skilled researchers whose time will be more expensive; and b) more projects submitted by a growing number of researchers with postgraduate degrees.
Identification of high-impact researchers
and academic institutions
Due to the previous mentioned advantages, the Hirsch index is a bibliometric indicator that has been increasingly used by academic institutions to promote scientific research (Abbott et al., 2010; Braun et al., 2010; Van Noorden, 2010) to the degree that in some European countries it has been incorporated into the national legislation that promotes scientific and technological development. H-index has been used to evaluate the productivity of researchers in Biomedicine, Ecology, Physics and Chemistry (Bornmann & Daniel, 2005; Hirsch, 2005; Kelly & Jennions, 2006; Van Raan, 2006; Bornmann et al., 2008). When Jorge Hirsch proposed the index, he applied it to a sample of physicists in high energy particles and specialists in Molecular Biology and found that h-index values are related to the publication rates of each discipline, citation patterns, as well as the size of the research community.
BI
BL
IOM
ETRI
C
FA
C
TORS
ASSO
CI
ATE
D
WI
TH
H-IN
DE
X
145
similar study, but unlike the previous work, his research focused on British researchers and used the Eugene Garfield’s h-index, the creator of the impact factor (Oppenheim, 2007). Oppenheim found that the h-index value was not affected by the inclusion of citations of publications not indexed in WoS. The range of the index values for the British researchers in Information Science was 6-31.
However, the most interesting applications of h-index have occurred within the context of institutional evaluation, especially when measuring the research impact. Within this perspective, h-index is useful as it was conceived precisely as an indicator of impact. J. Molinari and A. Molinari (2007) selected studies published from 1994-2003 by world-class universities in the fields of Materials Science, Physics, Engineering, Mathematics, Mechanics and Chemistry, and found that top universities also obtained the highest institutional h-index in the 2006 Shanghai university ranking. With regard to the evaluation of departments or programs, Mariana Pires Da Luz and her team calculated the h-index for Psychiatry graduate programs provided by Brazilian universities for studies published by faculty members from 1998-2006. The range of values of the institutional h-index for the six programs was 3-15. In addition, researchers found that the institutional h-index achieved a statistically significant correlation with papers published in journals with impact factor > 1 (Da Luz et al., 2008).
On the other hand, Themis Lazaridis calculated the h-index of researchers affiliated with the departments of Materials Science, Physics, Chemistry and Chemical Engineering at Greek universities whose studies were indexed in WoS (Lazaridis, 2009). From these data, Lazaridis obtained an institutional h-index for the graduate programs in the above-mentioned fields. The h-index obtained was associated with the subjective perception of the quality of these departments, although there were slight differences in some areas. These findings show that the Hirsch index is a suitable and valid measure within the context of institutional evaluation. Therefore, it can be considered as part of the bibliometric tools that contribute to the peer-review process when it comes to establishing the impact of research of academic institutions engaged in scientific and technological development.
Despite all the studies conducted since 2005, the Hirsch index has not yet been used to analyze production and impact within the Peruvian scientific community. Thus, the three objectives of the study are as follows: a) to identify Peruvian researchers with high, medium and low impact according to WoS and Scopus databases; b) to identify the bibliometric factor with the highest influence on h-index of Peruvian researchers; c) to compare h-index between WoS and Scopus at an individual and institutional level.
Methods
Citation databases used for information collection
Given the information duplicity and lack of standardization, Google Scholar was not considered in the study; even it is a free academic citation database, the problems already mentioned are not easily solved by using a software program such as “Publish or Perish” because names of authors and institutions still need to be standardized, which is a time consuming job.
Web of Science: During the 1990s, WoS was heavily criticized due to the overrepresentation of academic production originated from English speaking countries (Sancho, 1992; Spinak, 1996; Shrum, 1997) in comparison with academic production from developing countries. However, over the last past years, WoS citation indexes (Science Citation Index, Social Science Citation Index, Arts and Humanities Citation Index, Conference Proceedings Citation Index and Book Citation Index) improved coverage of non-English speaking countries, broadening its initial representation, as more scientific production from developing countries has been indexed (Vieira & Gomes, 2009; Speare, 2010). For this reason, WoS was considered as an information source for this study.
C.
VÍ
LCHE
Z-ROM
ÁN
146
coverage (almost 19,500 peer-reviewed journals, including more than 1,900 Open Access journals, 5.3 million conference proceedings, and over 50% of content coming from Europe, Latin America and the Asia Pacific, etc.) was the main reason for considering it as the second information source for this study.
Data collection procedure
Web of Science: To work with updated data of scientific production from Peru, the author searched for studies in which the country affiliation of the researcher was Peru (CU=Peru). The country affiliation was chosen because WoS does not have an author registry containing the academic profile for each researcher. For this reason, a list of authors with an h-index equal to or greater than three was obtained. We first intended to identify the authors affiliated to a Peruvian research institute, based on the previous registered data.
However, lack of a standardized registry for authors and multiple institutional affiliations made it hard to use this citation database for recording bibliometric data of each individual researcher. Although there is a software program called Thomson Data Analyzer, designed for analyzing normalized data of authors, it is an expensive commercial tool, which made it impossible to use during this research. At the end, WoS was used only to record data of institutionals (n=28). To obtain data for each Peruvian institution, after the initial search (CU=Peru), the “Analyze Results” option was used to group different entries for the same institution and record them in an Excel spreadsheet.
Scopus: we followed a similar procedure as described for WoS. First we searched for documents with Peru as the affiliation country (Affilcountry(Peru)), then a list of authors with an h-index equal to or greater than three was obtained. Concerning the multiple affiliation data, the history of institutional data was reviewed to decide which would be the preferred institutional affiliation. Two criteria were taken into account: if Peruvian institutions were mentioned at least five times or at least 20% of afiiliations mentioned a Peruvian institution in the full list of affiliations. Bibliometric data from 189 authors were registered in an Excel spreadsheet.
Given that Scopus has a standardized registry for authors and institutions, it was not hard to obtain and record data for individuals (n=189) and institutionals (n=33). In case an institution did not have an institutional profile, the “Affiliation search” option was used to find documents affiliated with it. When the results were displayed, the “View citation overview” tool was used to compute the h-index for this institution. Self-citations were not excluded when computing individual or institutional h-index since previous studies have shown an insignificant, almost imperceptible, effect of self-citations on the h-index of researchers (Cronin & Meho, 2006).
Data were compiled from September 18-23, 2013; then recorded into an Excel spreadsheet and exported to the MLwiN program, version 2.15, which is used for multilevel modeling. From MLwiN, the Statistical Package for the Social Sciences (SPSS) data matrix was generated to run regression analysis.
Information collected at the end of this stage was entered into three databases:
Scopus-individual level (seven fields): researcher’s name, documents indexed, citations, institutional affiliation, h-index of researcher, h-index of the selected institutional affiliation, academic age of researcher.
WoS and Scopus institutional level (the same five fields): name of institution, h-index, documents indexed, citations, foundation date of academic institution.
Exploration techniques and data analysis
As previously mentioned, three datasets were created with the bibliometric data for Peruvian researchers and institutions, which consisted of raw data for conducting statistical analysis of entire databases (Scopus with individual data =189 records; WoS with institutional data =28 records and Scopus =33 records), the three databases are available on request.
BI BL IOM ETRI C FA C TORS ASSO CI ATE D WI TH H-IN DE X 147
statistics was obtained to verify whether the data was close to a normal curve distribution. Although in multilevel modeling it is possible to control the effect of skewed distributions, through a process known as variable centering, this works well if the variables do not have high dispersion, since the data could produce biased analysis. Next, a correlation matrix was generated to determine if it was appropriate to run the Ordinary Least Squares (OLS) regression analysis first, followed by the multilevel modeling.
Data were analyzed according to a two-level design: individual and institutional.
h-indexij = 0j + 1Documents + 2Citations +
3AcademicAge + 4InstitutionalH-indexj + eij
0 = Y1 + u0j
4 = Y2 + u1j
Note: subscript letters i y j show variation at the individual and institutional level.
According to this formula, the h-index for each researcher changes at the individual and institutional level, so the intercept and regression coefficient for the h-index of the academic institutional showed variation at this second level. After this, the next step was to calculate the Intraclass Correlation Coefficient (ICC) (ICC=2
u0 / 2
u0 + 2
e) - known as partitioned variance
coefficient in the MLwiN software - and change the model fit according to the -2-log likelihood. One hundred
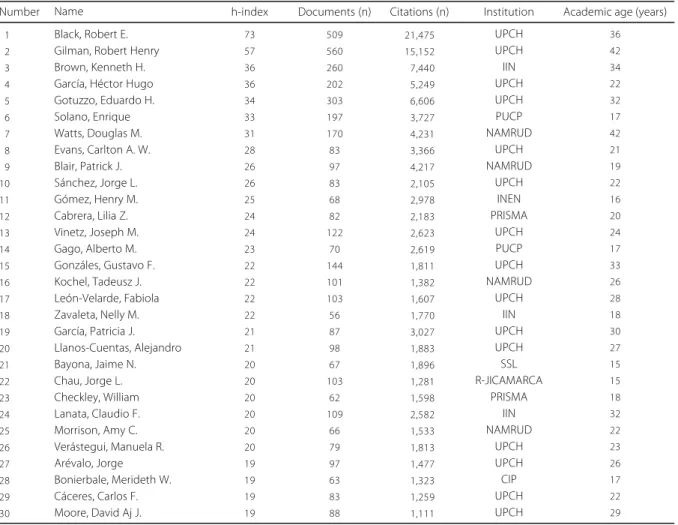
Table 1. Peruvian researchers with high- and medium-impact publications in Scopus.
01 02 03 04 05 06 07 08 09 10 11 12 13 14 15 16 17 18 19 20 21 22 23 24 25 26 27 28 29 30
Black, Robert E. Gilman, Robert Henry Brown, Kenneth H. García, Héctor Hugo Gotuzzo, Eduardo H. Solano, Enrique Watts, Douglas M. Evans, Carlton A. W. Blair, Patrick J. Sánchez, Jorge L. Gómez, Henry M. Cabrera, Lilia Z. Vinetz, Joseph M. Gago, Alberto M. Gonzáles, Gustavo F. Kochel, Tadeusz J. León-Velarde, Fabiola Zavaleta, Nelly M. García, Patricia J. Llanos-Cuentas, Alejandro Bayona, Jaime N. Chau, Jorge L. Checkley, William Lanata, Claudio F. Morrison, Amy C. Verástegui, Manuela R. Arévalo, Jorge Bonierbale, Merideth W. Cáceres, Carlos F. Moore, David Aj J.
73 57 36 36 34 33 31 28 26 26 25 24 24 23 22 22 22 22 21 21 20 20 20 20 20 20 19 19 19 19 509 560 260 202 303 197 170 83 97 83 68 82 122 70 144 101 103 56 87 98 67 103 62 109 66 79 97 63 83 88 21,475 15,152 07,440 05,249 06,606 03,727 04,231 03,366 04,217 02,105 02,978 02,183 02,623 02,619 01,811 01,382 01,607 01,770 03,027 01,883 01,896 01,281 01,598 02,582 01,533 01,813 01,477 01,323 01,259 01,111 UPCH UPCH IIN UPCH UPCH PUCP NAMRUD UPCH NAMRUD UPCH INEN PRISMA UPCH PUCP UPCH NAMRUD UPCH IIN UPCH UPCH SSL R-JICAMARCA PRISMA IIN NAMRUD UPCH UPCH CIP UPCH UPCH 36 42 34 22 32 17 42 21 19 22 16 20 24 17 33 26 28 18 30 27 15 15 18 32 22 23 26 17 22 29
Number Name h-index Documents (n) Citations (n) Institution Academic age (years)
Note: CIP: Centro Internacional de la Papa; IIN: Instituto de Investigación Nutricional; INEN: Instituto Nacional de Enfermedades Neoplásicas; NAMRUD: U.S. Naval Medical Research Center Detachment Lima; PRISMA: Asociación Benéficia Prisma; SSL: Socios em Salud Lima; PUCP: Pontificia Universidad Católica del Peru; R-JICAMARCA: Radio Observatorio de Jicamarca; UPCH: Universidad Peruana Cayetano Heredia.
C.
VÍ
LCHE
Z-ROM
ÁN
148
and eight-nine cases were considered for the multilevel analysis. Once the tests were finalized, data were analyzed using a random components model. If the values of ICC and the model fit were not appropriate, an OLS linear regression, using the stepwise procedure, was used to identify factors associated with the h-index of the Peruvian researchers.
Results
Researchers with high and medium impact in the Peruvian scientific community
Peruvian researchers with high impact factors come from foreign universities and they publish academic work as coauthors with other native Peruvian scholars, which explain why the top ten researchers appear as the six foreign authors registered in Peru as the country of affiliation in some of their publications.
Considering the three levels of impact (high = h-index 31, medium =30 h-index 21, low =20 h-index), it can be observed that few researchers (n=7) have high impact in the Peruvian scientific community, a bigger group (n=13) has a medium impact and the majority of Peruvian researchers has low impact (n=169). In terms of academic age (years since the first academic publication indexed in citation databases) not all high impact authors are senior researchers because two young Peruvian authors (Héctor Hugo García and Enrique Solano) are among the top ten researchers (Table 1).
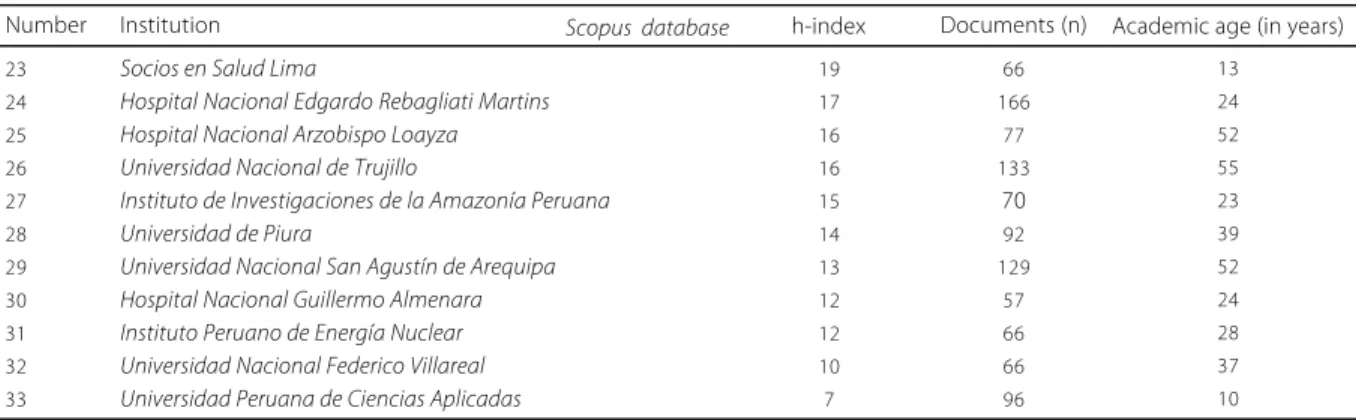
Peruvian institutions with high and medium research impact
With regard to the academic institutions, only a few of them have high research impact (6 in Wos and 6 in Scopus), while a bigger group reached a medium research impact (10 in WoS and 14 in Scopus) and the vast majority of institutions showed a low research impact. Due to limited space, only the top institutions are shown, but it must be noted that the full list of the Peruvian institutions indexed on citation databases is larger than the one shown in Table 2.
Since WoS and Scopus do not use the same criteria for indexing academic work, we expected to find some differences between the two databases; however, it is important to note that among the top ten research institutions there are seven matches, but not in same position. Moreover, among the 20 research institutions with the highest h-index, 17 institutions were in common, which shows that despite their differences both citation databases are quite similar (WoS and Scopus are used to determine the impact of research institutions). Previous studies have found an important similarity between the h-index values assigned by WoS and Scopus, as shown in studies in Information Science (Cronin & Meho, 2006). Different factors explain the high academic impact of universities and research institutes; for example, in WoS, the institutional h-index was correlated with indexed documents and academic age, whereas Scopus associates documents, number of affiliated authors and academic age (Table 3).
The number of affiliated authors suggests that a research institution can not restrict itself to local authors, but coauthorships with foreign institutions are needed because collaborative work with other institutions increases probability of achieving high academic visibility.
Bibliometric factors associated with the h-index of researchers
The h-index of Peruvian researchers showed non-biased distribution (12,053 ± 8,7615). With regard to the institutional h-index, both WoS and Scopus showed non-biased distribution: 24,893 ± 14,841 and 24,697 ± 12,516, respectively.
BI BL IOM ETRI C FA C TORS ASSO CI ATE D WI TH H-IN DE X 149
Table 2. Institutions with more high-impact researchers in WoS and Scopus.
01 02 03 04 05 06 07 08 09 10 11 12 13 14 15 16 17 18 19 20 21 22 23 24 25 26 27 28 01 02 03 04 05 06 07 08 09 10 11 12 13 14 15 16 17 18 19 20 21 22
Universidad Peruana Cayetano Heredia Universidad Nacional Mayor de San Marcos Instituto de Investigación Nutricional Centro Internacional de la Papa Pontificia Universidad Católica del Perú Instituto Geofísico del Perú
Instituto Nacional de Ciencias Neurológicas Instituto Nacional de Enfermedades Neoplásicas Ministerio de Salud
Instituto del Mar del Perú Asociación Benéfica Prisma Universidad Nacional de Ingeniería Instituto Nacional de Salud Instituto Nacional de Salud del Niño Universidad Nacional Agraria La Molina
U.S. Naval Medical Research Center Detachment Lima Universidad Nacional de la Amazonía Peruana Universidad Nacional San Antonio Abad Hospital Nacional Cayetano Heredia Asociación Civil Impacta Salud y Educación Universidad Nacional de Trujillo
Universidad de Piura
Universidad Nacional San Agustín Instituto Peruano de Energía Nuclear Universidad Particular Ricardo Palma Hospital Nacional Edgardo Rebagliati Martins Universidad de Lima
Universidad Nacional de Piura
Universidad Peruana Cayetano Heredia Universidad Nacional Mayor de San Marcos Centro Internacional de la Papa
Pontificia Universidad Católica del Perú Instituto de Investigación Nutricional
U.S. Naval Medical Research Center Detachment Lima Instituto del Mar del Perú
Universidad Nacional San Antonio Abad Instituto Nacional de Enfermedades Neoplásicas Hospital Nacional Dos de Mayo
Instituto Nacional de Ciencias Neurológicas Asociación Benéfica Prisma
Ministerio de Salud
Radio Observatorio de Jicamarca Universidad Nacional Agraria La Molina Universidad Nacional de Ingeniería Hospital Nacional Cayetano Heredia Instituto Geofísico del Perú Instituto Nacional de Salud Museo de Historia Natural de Lima
Universidad Nacional de la Amazonía Peruana Instituto Nacional de Salud del Niño
75 51 45 39 39 33 29 29 29 28 26 24 23 23 22 21 20 18 18 17 16 13 13 11 11 10 8 6 74 43 41 38 36 35 30 29 28 27 27 26 26 24 24 24 23 23 23 23 21 19 2531 1515 406 804 705 193 174 248 213 150 170 169 195 95 160 224 99 76 140 50 98 61 57 50 69 61 55 41 2,440 1,318 700 896 251 267 199 117 215 126 165 106 109 122 267 280 220 130 337 225 96 92 46 46 40 39 41 41 22 40 40 36 22 41 41 26 39 13 38 23 22 11 47 26 40 31 31 20 33 27 51 71 39 39 40 43 34 26 58 52 24 20 51 50 39 46 40 50 40 60 37 40
1 of 2
Number Institution Web of Science database h-index Documents (n) Academic age (in years)
C.
VÍ
LCHE
Z-ROM
ÁN
150
de Investigación Nutricional (IIN), most Peruvian research institutions had a medium or low h-index. The power distribution observed with the institutional h-index led us to reconsider the original hypothesis because according to the preliminary data, it was not appropriate to run a multilevel analysis.
As expected, according to theory, individual h-index achieved a strong positive correlation with documents and citations, but a medium and weak association with academic age and institutional h-index (Table 4). This was the second reason for assessing the relevance of running a multilevel modeling using institutional h-index, given the small covariation among variables and institutional h-index.
However, the main criterion for not running a multilevel modeling was the calculation of the Intraclass Correlation Coeffient (ICC). In any multilevel analysis, Table 2. Institutions with more high-impact researchers in WoS and Scopus.
23 24 25 26 27 28 29 30 31 32 33
Socios en Salud Lima
Hospital Nacional Edgardo Rebagliati Martins Hospital Nacional Arzobispo Loayza Universidad Nacional de Trujillo
Instituto de Investigaciones de la Amazonía Peruana Universidad de Piura
Universidad Nacional San Agustín de Arequipa Hospital Nacional Guillermo Almenara Instituto Peruano de Energía Nuclear Universidad Nacional Federico Villareal Universidad Peruana de Ciencias Aplicadas
19 17 16 16 15 14 13 12 12 10 7
66 166
77 133
70 92 129
57 66 66 96
13 24 52 55 23 39 52 24 28 37 10
2 of 2
Number Institution Scopus database h-index Documents (n) Academic age (in years)
Source: Prepared by author (2013).
Table 3. Correlation matrix of bibliometric variables (institutional level), A) Web of Science database and B) Scopus database
Institutional h-index Documents
0.887** 0.491**
0.439**
Note: WoS (n=28), *p<0.05, **p<0.001; Scopus (n=33).
Souce:Prepared by author (2013).
A) Web of Science database Documents Academic age
B) Scopus database Documents Affiliated authors Academic age
researchers begin with simple models and progress to more complex models. In this study, when author went from a fixed components model to a random components model, the ICC was very low (0.05), which means that variance explained by multilevel modeling was 5%. Additionally, model fit did not achieve significant improvement, since the value of - 2-log likelihood did not show great variation.
As shown by the preliminary analysis, since it was inappropriate to conduct a multilevel analysis for the h-index of Peruvian researchers, a linear multiple regression was run to identify bibliometric factor with the highest influence on the h-index of the researcher (Table 5). Regression coefficients of indexed documents and citations were statistically significant (p<0.05), although only the first one presented considerable influence. In brief, for each new document indexed on the citation Institutional h-index
Documents Affiliated authors
0.872** 0.789**
0.967**
0.358** 0.343**
BI
BL
IOM
ETRI
C
FA
C
TORS
ASSO
CI
ATE
D
WI
TH
H-IN
DE
X
151
database and for every increase in citations, the h-index of the researcher increased 0.063 and 0.002 units, respectively. With regard to the model fit, R2 was relatively
high (82% of explained variance).
Discussion
A first issue is that the Matthew effect appeared both for the individual and institution: only a few scholars have high impact publications while the majority reaches medium- or low impact publications. This means that to improve academic impact, Peruvian research institutions must identify those high impact centers and develop collaborative projects with them. Therefore, impact rankings such as the annually published Scimago International Report can be a valuable tool.
The second issue refers to the transnational nature of scientific knowledge. Although the purpose of this study was to analyze the h-index of Peruvian researchers, co-authorship network (visible to a greater extent in some specializations than in others) makes several authors become involved in the development of a research paper. This trend towards co-authorship has been analyzed in previous studies that have identified it as being one factor Table 4. Correlation matrix of bibliometric variables (individual level).
Individual h-index Documents Citations Academic age
Note: Scopus (n=189), *p<0.05, **p<0.001.
Source: Prepared by author (2013).
Academic age Documents
0.889**
0.928**
Citations
0.890** 0.305**
0.395**
0.297**
0.179** 0.192**
0.138** 0.245**
Institutional h-index
Table 5. Bibliometric factors associated with the h-index of the researcher in Scopus.
Documents Citations Academic age Institutional h-index
Note: Scopus (n=189). *p<0.05; **p<0.001; t: coefficient divided by its standard error; R2: coefficient of determination; F: mean square (regression)
divided bu the mean square (residual). Source: Prepared by author (2013).
t Regression coefficient
0.471 0.452 Standardized coefficient
-0.063
-0.002 -0.018
-0.027
-5.660** -5.434**
-0.518** -0.847**
425.113**
F
Factors R2
0.821
that influences citation of researchers (Glanzel, 2002; Aksnes, 2003; Leimu & Koricheva, 2005).
On the other hand, although the h-index of researchers showed no biased distribution-which made it possible to develop the ranking of researchers with high impact publications-it would be a risk to make a comparative analysis based only on the h-index as this bibliometric indicator depends, among other variables, on the size of the research community, publication habits, and citation patterns of each discipline.
C.
VÍ
LCHE
Z-ROM
ÁN
152
(Rodríguez-Navarro & Imperial-Cárdenas, 2006). Within this range the h-index of researchers from related fields can be compared and the basic principle of achievement is that only what is comparable can be compared. Thus, the h-index of a researcher can not be interpreted as an absolute measure, but it depends on context, which is given by the area or field of specialization.
Furthermore, to understand the impact of the h-index within the Peruvian research community, it would be advisable to define the expected range of the h-index values so that only one evaluation criterion would exist for the accreditation of Education and Medicine schools, as well as Peruvian graduate programs. The Consejo de Evaluación, Acreditación y Certificación de la Calidad de la Educación Superior Universitaria (CONEAU), whose purpose is to ensure the quality of higher education, has developed quality models for the accreditation process, defining a comprehensive set of standards and indicators. In these models, from almost 100 indicators, only 4-6 indicators assess scientific production of undergraduate and graduate faculties. Even these indicators establish a high priority to works published in indexed journals, but they do not specify what is meant by indexed journals, whether it only considers WoS and Scopus journals or if journals indexed on Scientific Electronic Library Online (SciELO) or available on Google Scholar would suffice. No CONEAU models consider individual impact indicators such as the h-index or any of its related indexes. Therefore, decisions concerning faculty tenure and promotions, as well as research funding, are solely based on subjective opinions or social relationships between the researcher and university authorities (dean, provost, etc.). For this reason, it is imperative to rely on quantitative criteria as they are less vulnerable to personal bias or favoritism due to political affinities.
With regard to the institutions, Peruvian universities in partnership with foreign institutions achieved the highest institutional h-index, as shown by number of papers published due to collaborative agreements: from 2,447 studies published by UPCH and indexed in Scopus, 267 were published in partnership with Johns Hopkins Bloomberg School of Public Health and 102 with Prins Leopold Institute voor Tropische Geneeskunde; from 1,347 works published by UNMSM,
86 were conducted in collaboration with one of schools of Public Health at Johns Hopkins University and 41 with the Center for Disease Control and Prevention. This trend was also noted in Peruvian research centers: from 700 studies produced by CIP, 45 were published in collaboration with the University of Wisconsin Madison and 30 with Cornell University; in turn, from 251 documents produced by IIN, 41 were published in partnership with Johns Hopkins Bloomberg School of Public Health and 19 with the World Health Organization.
The trend toward international collaboration is understandable because of the size and broad coverage of the fields of knowledge and universities often carry out many projects in cooperation with national and international institutions. In research centers, collaboration occurs due to the need for funding as financial support from the state is limited. Given that universities and research centers with a higher h-index show a significant partnership agreements with high-impact international institutions, Peruvian universities and research centers with a lower impact would do well to carry out projects in collaboration with high-impact institutions. Thus, they would not only ensure the transfer of skills and expertise, but institutions with lower research capacity could progressively improve their academic impact.
BI
BL
IOM
ETRI
C
FA
C
TORS
ASSO
CI
ATE
D
WI
TH
H-IN
DE
X
153
Public Peruvian universities are not the only ones absent from the list of centers focused on production of science and technology; Peruvian private universities also do not appear among the institutions with moderate research capacity. This is a troubling issue because, in theory, the private sector should be a key component that streamlines national innovation systems as they do not face the burden of bureaucracy and complex procedures that are common in the public sector. However, it appears that the contribution of the private sector to R+D+I, at least with regard to the bibliometric indicators, is almost nonexistent. This means that the private sector does not generate scientific and technological innovation, but mainly imports technology from other countries, and in the area of R+D+I it focuses primarily on implementing existing solutions.
With regard to the bibliometric factors associated with the impact of research, despite the moderate dispersion of variables considered for analysis, model fit achieved statistical significance even when only a few cases were analyzed. Correlation analyses for the institutional h-index showed different association coefficients in WoS and Scopus. This difference between both databases is explained due to the standardization of the names of authors and institutions on the Scopus database, an improvement that can be verified by using the authors/institutions search feature. Since both scientific databases have a high degree of similarity in terms of indexed publications, advances such as the standardization of authors and institutions allow Scopus to generate more consistent results.
Given that one of the purposes of this study was to identify the bibliometric factors with a higher influence on the h-index of Peruvian researchers, results showed that indexed documents and citations have a greater effect on the publication impact of the researcher. Thus, when authors cite an academic reference in their work, they do not only consider which are the most cited papers, but mainly the total production and work quality of each researcher. This is understandable because during the development of conceptual framework and problem backgrounds, the researchers know which authors are the most representative or renowned in the field (those
who are often the most productive). Therefore, when researchers refine background and analyze the results comparing them with previous studies, they examine each paper in depth and identify the contributions of more sophisticated studies, which are usually those that achieve the highest average citation rates per document.
With regard to the researcher’s work, these findings show that the mantra “publish or perish” is still important, but not sufficient. In some cases, the academic strategy for publication focused on partnerships with foreign institutions has worked, so it is a recommended path for authors working to improve their academic output and impact. Given that authors strive to produce high quality work, rather than just publishing the largest number of studies, their research impact will improve steadily.
Conclusion
The approach used in this research made it possible to identify Peruvian researchers with high and medium academic impact (the full list does not show authors with low impact due to limitation of space). In order to obtain a complete picture using individual data available in WoS, it would be advisable if the Thomson Data Analyzer were purchased to normalize the data of authors.
With regard to the bibliometric factors associated with the h-index of Peruvian researchers, OLS regression identified two variables that are highly related to the definition of h-index: indexed documents and citations. This initial finding can be improved if further large scale studies include more academic variables in addition to the institutional h-index or academic age (postgraduate degrees in a foreign university, number of works published in co-authorship, area of specialization, etc.).
C.
VÍ
LCHE
Z-ROM
ÁN
154
References
Abbott, A. et al. Do metrics matter? Nature, v.465, n.7300, p.860-862, 2010.
Aksnes, D.W. Characteristics of highly cited papers. Research Evaluation, n.12, p.159-170, 2003.
Archambault, E. et al. Comparing bibliometric statistics obtained from the Web of Science and Scopus. Journal of the American Society for Information Science and Technology, v.60, n.7, p.1320-1326, 2009.
Bornmann, L.; Daniel, H. Does the h-index for ranking of scientists really work? Scientometrics, v.65, n.3, p.391-392, 2005. Bornmann, L.; Wallon, G.; Ledin, A. Is the h index related to (standard) bibliometric measures and to the assessments by peers? An investigation of the h index by using molecular life sciences data. Research Evaluation, n.17, p.149-156, 2008. doi: 10.3152/095820208X319166
Braun, T. et al. How to improve the use of metrics. Nature,
v.465, n.17, p.870-872, 2010.
Burnham, J. Scopus database: A review. Biomedical Digital Libraries, v.3, n.8, p.1-8, 2006.
Costas, R.; Bordons, M. Una visión crítica del índice h: algunas consideraciones derivadas de su aplicación práctica. El Profesional de la Informacion, v.5, n.16, p.427-432, 2007. doi: 10.3145/epi.2007
Cronin, B.; Meho, L. Using the h-index to rank influential information scientists. Journal of the American Society for Information Science and Technology, v.57, n.9, p.1275-1278, 2006. doi:10.1002/asi.20354
Da Luz, M. et al. Institutional h-index: The performance of a new metric in the evaluation of Brazilian Psychiatric Post-graduation Programs. Scientometrics, v.77, n.2, p.361-368, 2008. doi: 10.1007/s11192-007-1964-9
Glänzel, W. Coauthorship patterns and trends in the sciences (1980-1998): A bibliometric study with implications for database indexing and search strategies. Library Trends, v.50, n.3, p.461-473, 2002.
Hirsch, J. An index to quantify an individual’s scientific research output. 2005. Available from: <http://arxiv.org/abs/physics/ 0508025>. Cited: Jul. 14, 2010.
Kelly, C.; Jennions, M. The h index and career assessment by numbers. Trends in Ecology & Evolution, n.21, p.167-170, 2006. doi: 10.1016/j.tree.2006.01.005
Lazaridis, T. Ranking university departments using the mean h-index. Scientometrics, v.82, n.2, p.211-216, 2009. doi: 10.1007/ s11192-009-0048-4
Leimu, R.; Koricheva, J. Does scientific collaboration increase the impact of ecological articles? BioScience, v.55, n.5, p.438-443, 2005.
Molinari, J.; Molinari, A. A new methodology for ranking scientific institutions. Scientometrics, v.75, n.1, p.163-174, 2007. doi:10.1007/s11192-007-1853-2
Oppenheim, C. Using the h-index to rank influential British researchers in Information Science and Librarianship. Journal of the American Society for Information Science and Technology,
v.58, n.10, p.297-301, 2007. doi: 10.1002/asi.20460
Rodríguez-Navarro, A.; Imperial-Rodenas, J. Índice h: guía para la evaluación de la investigación española en ciencia y tecnología utilizando el índice h. Madrid: Dirección General de Universidades e Investigación, 2006.
Sancho, R. Misjudgements and shortcomings in the measurement of scientific activities in less developed countries. Scientometrics, v.23, n.1, p.221-233, 1992. Shrum, W. View from afar: ‘Visible’ productivity of scientists in the developing world. Scientometrics, v.40, n.2, p.215-235, 1997.
Speare, M. Environmental microbiology: A database coverage study. Science & Technology Libraries, v.29, n.1, p.1-15, 2010. Spinak, E. Los análisis cuantitativos de la literatura científica y su validez para juzgar la producción latinoamericana. Boletín de la Oficina Sanitaria Panamericana, v.120, n.2, p.139-146, 1996.
Van Noorden, R. A profusion of measures. Nature, v.465, n.7300, p.864-866, 2010.
Van Raan, A. Comparison of the Hirsch-index with standard bibliometric indicators and with peer judgment for 147 chemistry research groups. Scientometrics,v.67, n.3, p.491-502, 2006. doi: 10.1007/s11192-006-0066-4