ISSN 0104-6632 Printed in Brazil
www.abeq.org.br/bjche
Vol. 26, No. 04, pp. 641 - 648, October - December, 2009
Brazilian Journal
of Chemical
Engineering
EFFECTS OF ULTRASOUND ON THE
PERFORMANCE IMPROVEMENT OF
WASTEWATER MICROFILTRATION
THROUGH A POROUS CERAMIC FILTER
I. C. C. Rocha, J. J. Marques
*and A. S. Silva
Universidade Federal de Sergipe, Phone: + (55) (79) 2105-6687, Fax: + (55) (79) 2105-6679, Av. Marechal Rondon, s/n. Rosa Elze, São Cristóvão - SE, Brasil.
E-mail: [email protected], *E-mail: [email protected]
(Submitted: March 23, 2009 ; Revised: June 5, 2009 ; Accepted: June 8, 2009)
Abstract - Filtration under an ultrasonic field is a technique that is gaining importance in the wastewater treatment research field, not only due to its ability as a cleaning mechanism, but also as a filtration intensifier. The main objective of this research was the study of the influence of ultrasonic waves on the filtration of the oilfield wastewater (known as produced water) in order to increase the operation performance and filter
medium regenerative effectiveness. A 0.016 m2 hollow cylindrical porous ceramic filter was submitted to the
filtration of produced water by two mechanisms: conventional filtration under vacuum and filtration under the influence of ultrasonic waves. Experiments were carried out using synthetic produced water by analyzing the variables oil and grease content (O&G) and total suspended solids (TSS) for each filtration run. Backwashing of the filter medium with distilled water was also performed to evaluate the regeneration efficiency. During
conventional filtration, permeate flux decreased gradually, becoming stable around 0.06 cm3.cm-2.s-1.
Furthermore, in the filtration assisted by ultrasound, the permeate flux was around 0.15 cm3.cm-2.s-1.
Therefore, ultrasonic waves provided an increase of about 150% in the permeate flux. Moreover, the sonication improved filter medium regeneration effectiveness, even under conditions of high TSS and O&G contents. Taking into consideration the very positive results associated with the application of ultrasonic waves, this filtration technique is likely to become an important industrial process.
Keywords: Filtration; Ultrasound; Produced water.
INTRODUCTION
The petroleum industry - the main oily wastewater generator - produces a mixture known as “produced water”, during the exploration of oil. Its composition is very complex and depends on the geological formation characteristics, the oil recovery technique and the chemical additives used in the production (Gabardo, 2007).
According to the official US Energy Information
Administration (EIA, 2008) estimates, the demand
for oil will grow by 26% from 2005 to 2030. Besides the problem of its composition, the volume of produced water generally increases during the oilfield lifecycle. It is estimated that, during the economic life of an oilfield, the volume of water can
reach more than ten times the volume of oil produced (Ekins et al., 2007). According to the Brazilian petroleum company (Petrobras), for each cubic meter of oil, 1.1 cubic meter of brackish water is produced (Schuhli, 2007).
Çakmakci et al. (2008) argued that the successful treatment of produced water generally requires pre-treatments in which various contaminants are removed. Among the most investigated techniques for removal of O&G and TSS contents are filtration through granular and fixed bed filter media and cross-flow microfiltration through ceramic filters.
surface, clogging the pores and reducing its hydraulic conductivity (Sondhi and Bhave, 2001). In most cases, the regeneration of filter medium is carried out by reverse flow, but the use of sonication to clean the filter medium is becoming increasingly important (Tran et al., 2007).
According to Muthukumaran et al. (2005), this technique has four specific effects that may contribute to the optimization of filtration processes: agglomeration of fine particles that cause pore blockage and cake deposition; promotion of free channels by maintaining particulate matter suspended; cleanness of filter surface and internal channels through cavitation; cleanness of filter surface due to turbulence near the cake layer. Moreover, ultrasonic cleaning does not require chemical agents, reducing interruptions (CHEN et al., 2006).
In this context, this study analyzes the fouling effect on the permeate flux. Cake formation and pore blockage are still the crucial problems found in filtration. They can reduce drastically the conventional filtration flow, causing interruption of the operation to perform filter medium cleaning.
The use of an ultrasound field as an auxiliary filtration mechanism applied to synthetic produced water treatment is the main objective of this paper, focusing on its on site or off site reuse or even its environmentally safe disposal.
MATERIAL AND METHODS
This study was performed using a 0.016 m2
hollow cylindrical porous ceramic filter media immersed in a UNIQUE ultrasonic bath, Ultracleaner model that worked simultaneously as a suspension reservoir and ultrasound source. The filter medium was submitted to conventional and ultrasonic filtration mechanisms.
Synthetic produced water used in the tests was prepared according to the following procedure: distilled water was mixed with sodium chloride (to provide a salinity of 3.0 % in weight, in order to make it similar to real oilfield produced water); sodium sulfide (sufficient to supply the concentration levels of suspended solids) and petroleum (to give the right contents of O&G) emulsified in the medium through a vigorous mixing using a Black & Decker propeller stirrer, model SB40. Suspended solids were generated through the oxidation reaction between sulfide and sodium hypochlorite, followed by coagulation-flocculation using aluminum sulfate and pH correction with sulfuric acid. The supernatant phase was collected to be filtered.
Total suspended solids contents (TSS) in the feed were proportional to the colloidal sulfur generation determined by the amount of sodium sulfide added. The following nominal levels were studied: high
(1000mg.L-1), medium (500mg.L-1) and low
(250mg.L-1).
As for the oil and grease content (O&G) in the feed, 3 nominal concentration levels were also
studied: high (180 mg.L-1), medium (100 mg.L-1),
and low (20mg.L-1).
Conventional Vacuum Filtration
The filtration system depicted in Figure 1 was operated without the influence of the ultrasonic field. The ultrasonic bath was fed using a peristaltic pump and it was connected to a graduated cylinder (permeate container) and a vacuum pump. All the tests were performed under a vacuum of approximately 700 mmHg.
After each operation, the filter medium was backwashed with distilled water (Figure 2) driven by compressed air. The liquid generated by the reverse flow was then discarded.
Figure 1: Schematic diagram of the filtration system
Vacuum Filtration Under the Influence of the Ultrasonic Field
In this filtration mechanism, the experimental setup was very similar to the apparatus used in the conventional vacuum filtration described above (see Figure 1). The only difference was the operation under the influence of an ultrasonic field provided by turning the ultrasonic bath frequency to 40 kHz. The backwashing under ultrasonic effect was carried out according to the scheme shown in Figure 2. All the tests were performed under a vacuum of approximately 700 mmHg.
The determination of the filtration rate was made through the bucket-and-stopwatch technique,
measuring the drained volume (ΔV) at a certain
operation time (Δt).
The evaluation of permeate quality was based on the parameters turbidity (by the nephelometric method) and oil and grease content (gravimetric method), according to Standard Methods for the Examination of Water and Wastewater (SMEWW) (Clesceri et al., 1998).
RESULTS AND DISCUSSION
Experimental results were grouped into two sets: conventional vacuum filtration and vacuum filtration under the influence of an ultrasonic field. All the experiments were performed using synthetic produced water whose composition was varied
according to a 3n factorial experimental design in
terms of the factors TSS and O&G contents, keeping NaCl content around 3% in weight.
Filtration curves are presented in terms of two sets of plots: permeate flux (J) versus filtration time (t) and the ratio time-to-volume (t/V) versus volume (V). The last plot has the main purpose of evaluating cake compressibility and filtration resistance in a semi-qualitative way.
Conventional Vacuum Filtration
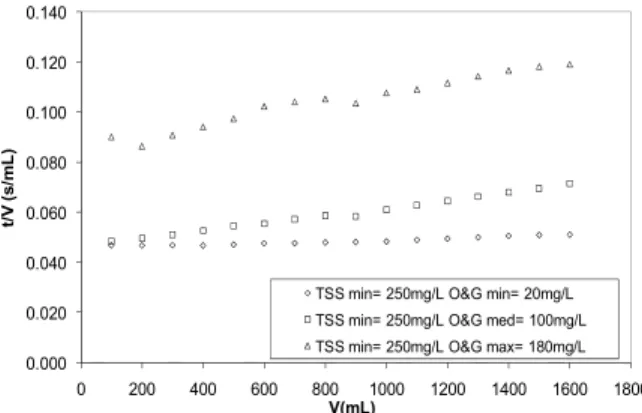
Figures 3 and 4 show the results for conventional filtration runs under the minimum TSS content, varying O&G concentration.
Figure 3 shows very clearly that the O&G content exerts a negative influence on the permeate flux magnitude. This behavior is probably due to the preferential adhesion of emulsified oil to the filter surface, increasing the filtration resistance. Another important aspect observed in Figure 4 is the low cake compressibility indicated by the strong linear tendency of the curves.
Figures 5 and 6 show plots similar to the two above obtained from the experiments performed under medium TSS content, varying O&G concentration.
By comparing Figures 3 and 5, it can be observed that the increase in TSS content made the filtration curves come closer to one another, showing that solid content was an important factor. The agglomeration of oil droplets onto suspended solid particles is the most probable explanation because this combination inhibits oil adhesion to the filter medium surface.
A slight curvature can be observed in the two upper curves in Figure 6 – a signal of cake compressibility as it becomes thicker. Filtration resistance increases with the blocking of filter medium pores when cake thickness increases or compresses.
0.0E+00 2.0E-02 4.0E-02 6.0E-02 8.0E-02 1.0E-01 1.2E-01 1.4E-01
0 50 100 150 200 250
J
(c
m
³/
c
m
².
s
)
t(s)
TSS min= 250mg/L O&G min= 20mg/L
TSS min= 250mg/L O&G med= 100mg/L
TSS min= 250mg/L O&G max= 180mg/L
0.000 0.020 0.040 0.060 0.080 0.100 0.120 0.140
0 200 400 600 800 1000 1200 1400 1600 1800
t/
V
(
s
/m
L
)
V(mL)
TSS min= 250mg/L O&G min= 20mg/L TSS min= 250mg/L O&G med= 100mg/L TSS min= 250mg/L O&G max= 180mg/L
Figure 3: Permeate flux versus time for conventional
vacuum filtration; TSS=250 mg.L-1
Figure 4: Darcy´s filtration curve for conventional
0.0E+00 2.0E-02 4.0E-02 6.0E-02 8.0E-02 1.0E-01 1.2E-01 1.4E-01
0 50 100 150 200
J
(c
m
³/
c
m
².
s
)
t(s)
TSS med= 500mg/L O&G min= 20mg/L
TSS med= 500mg/L O&G med= 100mg/L
TSS med= 500mg/L O&G max= 180mg/L
0.000 0.020 0.040 0.060 0.080 0.100 0.120
0 500 1000 1500 2000 2500
t/
V
(
s
/m
L
)
V(mL)
TSS med= 500mg/L O&G min= 20mg/L
TSS med= 500mg/L O&G med= 100mg/L
TSS med= 500mg/L O&G max= 180mg/L
Figure 5: Permeate flux versus time for conventional
vacuum filtration; TSS=500 mg.L-1
Figure 6: Darcy´s filtration curve for conventional
vacuum filtration; TSS=500 mg.L-1
Another set of plots is presented in Figures 7 and 8, corresponding to the highest TSS level. Again, O&G contents ranged from 20 to 180 mg.L-1.
Conclusions very similar to the previous plots can be derived from these results. In spite of the same O&G content difference between the curves, when
the O&G content changed from 100 mg.L-1 to 180
mg.L-1, the effect was more intense. This might
indicate that a saturation of the oil to solid particle interaction may have occurred. Moreover, the curvature observed in the upper curve in Figure 8
shows that the cake produced at the highest TSS and O&G contents was significantly compressible.
Table 1 shows residual turbidity and O&G removal efficiencies for each experimental run.
The aspects that call more attention in Table 1 are a significant increase in effluent residual turbidity and O&G removal efficiency as SST content increases. The probable explanation to this behavior is a synergistic interaction between oil and solid particles, forming a kind of slurry that is more efficient in terms of oil removal, but this hypothesis requires further studies.
0.0E+00 2.0E-02 4.0E-02 6.0E-02 8.0E-02 1.0E-01 1.2E-01 1.4E-01
0 20 40 60 80 100 120 140
J
(c
m
³/
c
m
².
s
)
t(s)
TSS max= 1000mg/L O&G min= 20mg/L
TSS max= 1000mg/L O&G med= 100mg/L
TSS max= 1000mg/L O&G max= 180mg/L
0.000 0.020 0.040 0.060 0.080 0.100
0 200 400 600 800 1000 1200 1400 1600
t/
V
(s
/m
L
)
V(mL)
TSS max= 1000mg/L O&G min= 20mg/L
TSS max= 1000mg/L O&G med= 100mg/L
TSS max= 1000mg/L O&G max= 180mg/L
Figure 7: Permeate flux versus time for conventional
vacuum filtration; TSS=1,000 mg.L-1
Figure 8: Darcy´s filtration curve for conventional
vacuum filtration; TSS=1,000 mg.L-1
Table 1: Residual turbidity and O&G removal for conventional filtration
TSS (mg.L-1) O&G (mg.L-1) Residual turbidity (NTU) O&G Removal efficiency (%)
250 20 0.51 NA
250 100 0.57 87.9 250 180 0.60 93.2
500 20 2.4 71.0
Filter Medium Regeneration Performance After Conventional Vacuum Filtration
The plot in Figure 9 shows the experimental curves of filtrate volume (V) versus time (t), under constant pressure, to evaluate filter medium regeneration performance through backwashing with distilled water. The number that follows the label “Backw” identifies the filtration/regeneration cycle. For example, “Backw 5” means that the filter cartridge was being backwashed after the completion of the fifth filtration cycle.
y = 22.984x y = 21.188x y = 22.403x y = 21.706x y = 19.004x y = 21.605x y = 21.49x y = 21.893x y = 14.512x y = 21.311x
0 100 200 300 400 500 600 700 800
0 10 20 30 40 50 60
t(s)
V(
m
L
)
Backw 1 Backw 2 Backw 3 Backw 4 Backw 5 Backw 6 Backw 7 Backw 8 Backw 9 Clean
Figure 9: Comparison of backwashings for conventional vacuum filtration
Note: The “clean” curve data were obtained by using
a new filter cartridge.
It can be observed in Figure 9 that backwashing had good regenerative efficiency up to "Backw 4". From "Backw 5" forward, filtrate flow dropped
considerably, attaining 14.51 mL.s-1 at “Backw 9”,
against an average flow of 21.31 mL.s-1 with the
clean filter medium. This experiment was particularly important for determining the right time to discard the filtration cartridge.
Vacuum Ultrasonic Filtration
In order to evaluate ultrasound effects on filtration performance and make a comparison with
conventional vacuum filtration, another set of tests were performed by submitting the filter cartridge to a 40 Hz electromagnetic field, as shown below.
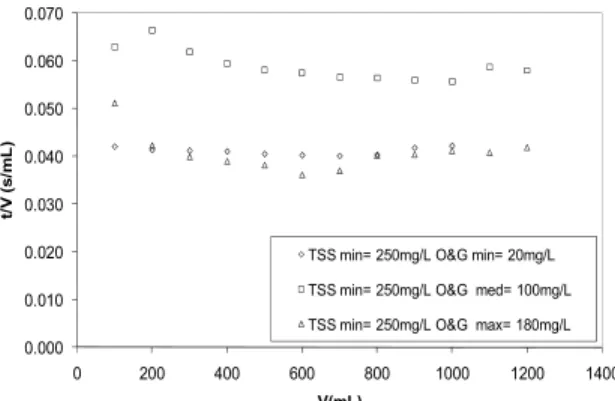
Figures 10 and 11 show the results for vacuum ultrasonic filtration tests under the minimum TSS content, varying O&G concentration.
These results reproduce the situation presented in Figures 3 and 4, except the influence of ultrasonic waves. The point that is most noteworthy is the flatness of the curves. It is a meaningful fact that reflects the maintenance of filtration resistance around a certain value due to the sonication effects.
Figures 12 and 13 show vacuum ultrasonic filtration data at medium TSS content, changing O&G concentration levels.
The tendency exhibited by the curves reinforces the aspect previously discussed. Independent of the TSS and O&G contents, the permeate flux remained around 0.15 cm3.cm-2.s-1 over the entire filtration cycle, as can be confirmed by inspection of the plot on the right.
The last set of results is shown in Figures 14 and 15, corresponding to the highest TSS level and variable O&G contents.
All the results presented in Figures 10 to 15 show that sonication clearly increases the filtration rate and enhances filter performance in comparison with the conventional vacuum filtration previously studied. According to Lim and Bai (2003), the acoustic energy provided by sonication dislodges materials from the filter surface, leaving more free channels for solvent percolation.
The filtration of flocculated suspensions under this mechanism proved to be consistent with the results obtained by Tuori (1996), who studied the filtration of an aqueous pyrite suspension, under intermittent ultrasound effect. It was found that the performance of the system was superior to that obtained under conventional filtration. According to the author, the effectiveness of this technique depends on the characteristics of the solid-fluid system and its operating conditions.
0.0E+00 5.0E-02 1.0E-01 1.5E-01 2.0E-01 2.5E-01 3.0E-01 3.5E-01
0 20 40 60 80
J
(c
m
³/
c
m
².
s
)
t(s)
TSS min= 250mg/L O&G min= 20mg/L
TSS min= 250mg/L O&G med= 100mg/L
TSS min= 250mg/L O&G max= 180mg/L
0.000 0.010 0.020 0.030 0.040 0.050 0.060 0.070
0 200 400 600 800 1000 1200 1400
t/
V
(s
/m
L
)
V(mL)
TSS min= 250mg/L O&G min= 20mg/L
TSS min= 250mg/L O&G med= 100mg/L
TSS min= 250mg/L O&G max= 180mg/L
Figure 10: Permeate flux versus time for ultrasonic
vacuum filtration; TSS=250 mg.L-1
Figure 11: Darcy´s filtration curve for ultrasonic
0.0E+00 5.0E-02 1.0E-01 1.5E-01 2.0E-01 2.5E-01 3.0E-01
0 10 20 30 40 50 60
J
(c
m
³/
c
m
².
s
)
t(s)
TSS med= 500mg/L O&G min= 20mg/L
TSS med= 500mg/L O&G med= 100mg/L
TSS med= 500mg/L O&G max=180mg/L
0.000 0.010 0.020 0.030 0.040 0.050
0 200 400 600 800 1000 1200 1400
t/
V
(
s
/m
L
)
V(mL)
TSS med= 500mg/L O&G min= 20mg/L
TSS med= 500mg/L O&G med= 100mg/L
TSS med= 500mg/L O&G max=180mg/L
Figure 12: Permeate flux versus time for ultrasonic
vacuum filtration; TSS=500 mg.L-1
Figure 13: Darcy´s filtration curve for ultrasonic
vacuum filtration; TSS=500 mg.L-1
0.0E+00 5.0E-02 1.0E-01 1.5E-01 2.0E-01 2.5E-01
0 10 20 30 40 50 60 70
J
(c
m
³/
c
m
².
s
)
t(s)
TSS max=1000mg/L O&G min= 20mg/L
TSS max=1000mg/L O&G med= 100mg/L
TSS max=1000mg/L O&G max= 180mg/L
0.000 0.010 0.020 0.030 0.040 0.050 0.060
0 200 400 600 800 1000 1200 1400 1600
t/
V
(
s
/m
L
)
V(mL)
TSS max= 1000mg/L O&G min= 20mg/L
TSS max= 1000mg/L O&G med= 100mg/L
TSS max= 1000mg/L O&Gmax= 180mg/L
Figure 14: Permeate flux versus time for ultrasonic
vacuum filtration; TSS=1,000 mg.L-1
Figure 15: Darcy´s filtration curve for ultrasonic
vacuum filtration; TSS=1,000 mg.L-1
Table 2 presents the results of residual turbidity and O&G removal efficiencies for the experiments performed under the ultrasonic mechanism.
All of the experiments showed good results in terms of TSS and O&G removals. On the average, for a given
O&G content, the increase of TSS content lowered filtrate flow turbidity, showing a possible synergistic effect between TSS and O&G interaction. In some situations, the turbidities of the clarified liquid were as low as drinking water turbidity.
Table 2: Residual turbidity and O&G removal for ultrasonic filtration
TSS
(mg.L-1)
O&G
(mg.L-1)
Residual turbidity (NTU)
O&G Removal efficiency %
250 20 87.5 99.5 250 100 94.6 97.3 250 180 4.24 98.0
500 20 2.5 85.0
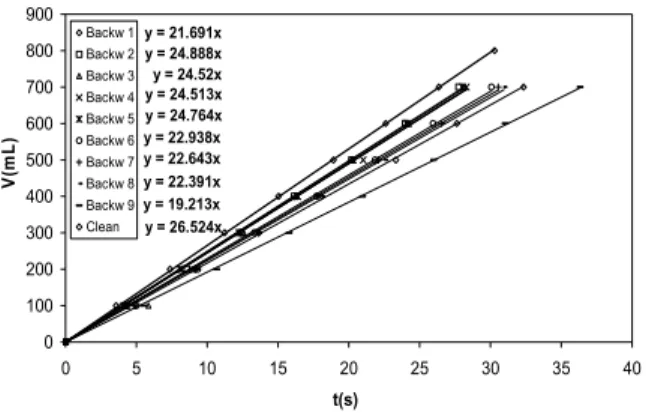
Evaluation of Filter Medium Regeneration by an Ultrasonic Mechanism
Filter medium backwashing under an ultrasonic effect showed an excellent performance, since the filtrate flow rate, after cleaning the filter medium, remained almost constant over the first 8 out of 9 filtration cycles, as shown in Figure 16.
y = 21.691x y = 24.888x y = 24.52x y = 24.513x y = 24.764x y = 22.938x y = 22.643x y = 22.391x y = 19.213x y = 26.524x
0 100 200 300 400 500 600 700 800 900
0 5 10 15 20 25 30 35 40
t(s)
V(
m
L
)
Backw 1 Backw 2 Backw 3 Backw 4 Backw 5 Backw 6 Backw 7 Backw 8 Backw 9 Clean
Figure 16: Comparison of backwashings for ultrasonic vacuum filtration.
The ideal regeneration performance would be attained if all the curves fit to the clean filter curve (superior curve). In fact, the slope reduction reflects an irreversible accumulation of solids that, under long term operation can cause full bore blockage, making the filter cartridge useless.
According to Muthukumaran et al. (2004), who developed studies of dairy effluent filtration assisted by ultrasound, the successful regeneration under this kind of mechanism is due to the effect of particle displacement from the filter surface by cavitation, which facilitates the water flow after sonicated-backwashing. Kobayashi et al. (2003) also reported that the use of sonication in water suspension filtration increases filter medium permeability.
Shu et al. (2007) performed effluent demulsification studies by using ceramic filter media, having tested four filter regeneration methods, among them backwashing with and without ultrasound influence. It was found that the regeneration assisted by ultrasound is more efficient because it avoids particle deposition on the surface.
CONCLUSIONS
Under a conventional vacuum filtration mechanism, the O&G content severely affected the behavior of filtration curves. The increase in this parameter caused a decrease in filtrate flow mainly
in the early stages of filtration at all levels of O&G and TSS studied. Thus, in t/V versus V plots, it is clear that, when the O&G content assumed higher values, the respective curves showed more intense bends. This is related to cake thickness and compressibility.
It is relevant to point out that the results presented above were obtained with an established ultrasonic frequency of 40 kHz. Thus, the use of frequencies other than 40 kHz needs further studies.
All the curves in the J versus t plots from the
experiments using conventional vacuum filtration converged to a limiting flux around 0.06 cm3.cm-2.s-1, whereas the application of ultrasonic waves increased the permeate flux to 0.15 cm3.cm-2.s-1, which represents an increment of about 150 % in filter capacity. Moreover, the ultrasonic field improved the filter medium regeneration effectiveness.
Another meaningful result was the maintenance of the permeate flux during the filtration time, which motivates further research in order to develop a filtration system suitable for application on an industrial scale, resulting in an innovative technology in this field. This is very promising for the development of continuous filtration equipments.
The application of ultrasound reported in this paper proved that ultrasound has great potential for further studies in the field of produced water treatment and filter media regeneration, providing higher filtration rates and prolonging filter cartridges lifetime. However, this process still needs additional studies in order to develop a competitive, full-scale technology.
ACKNOWLEDGEMENTS
The authors are thankful to Financiadora de Estudos e Projetos (FINEP) and Petroleo Brasileiro S/A (PETROBRAS) for the sponsorship of the study.
NOMENCLATURE
Symbols
J permeate flux cm3.cm-2.s-1
O&G oil and grease content mg.L-1
V filtrate volume cm3
t operation time s
TSS total suspended
solids
REFERENCES
Çakmakci, M., Kayaalp, N. and Koyuncu, I., Desalination of produced water from oil production fields by membrane process, Desalination, 222: 176-186 (2008).
Chen, D., Weavers, L. K. and Walker, H. W., Ultrasonic control of ceramic fouling by particles: effect of ultrasonic factors, Ultrasonics Sonochemistry, 13: 379-387 (2006).
Clesceri, L. S., Greenberg, A. E. and Eaton, A. D., Standard Methods for the Examination of Water and Wastewater, American Public Health Association, American Water Works Association
& Water Pollution Control Federation, 20th
edition, Washington, D.C. (1998).
EIA, Energy Information Administration – Official Energy Statistics from the U.S. Government, Report DOE/EIA-0484. Available from: http://www.eia.doe.gov/oiaf/ ieo/oil.html. (Accessed: 5 July, 2008).
Ekins, P., Vanner, R. and Firebrace, J., Zero emissions of oil in water from offshore oil and gas installations: economic and environmental implications, Journal of Cleaner Production, 15: 1302-1315 (2007).
Gabardo, I. T., Caracterização química e toxicológica da água produzida descartada em plataformas de óleo e gás na costa brasileira e seu comportamento dispersivo no mar, Ph.D. Thesis, PPGQ/UFRN, Rio Grande do Norte - RN, Brasil (2003).
Kobayashi, T., Kobayashi, T. and Hosaka et al., Ultrasound-enhanced membrane-cleaning processes
applied water treatments: influence of sonic frequency on filtration treatments, Ultrasonics, 41: 185-190 (2003).
Lim, A. L. and Bai, R., Membrane fouling and cleaning in microfiltration of activated sludge wastewater, Journal of Membrane Science, 216: 279-290 (2003). Muthukumaran, S., Yang, K. and Seuren et al., The
use of ultrasonic cleaning for ultrafiltration membranes in the dairy industry, Separation and Purification Technology, 39: 99-107 (2004). Muthukumaran, S., Kentish, S. E. and Ashokkumar et
al., Mechanisms for the ultrasonic enhancement of dairy whey ultrafiltration, Journal of Membrane Science, 258: 106-114 (2005).
Shu, L., Xing, W. and Xu, N., Effect of Ultrasound on the Treatment of Emulsification Wastewater by Ceramic Membranes, Chin. J. Chemical Engineering, 15: 855-860 (2007).
Schuhli, J. B. Previsão de equilíbrio líquido vapor de misturas contendo água-hidrocarboneto-sal, Dissertação de Mestrado em Engenharia Química, Rio de Janeiro - RJ, Brasil (2007).
Sondhi, R. and Bhave, R., Role of backpulsing in fouling minimization in crossflow filtration with ceramic membranes, Journal of Membrane Science, 186: 41-52 (2001).
Tran, T., Gray, S. and Bolto et al., Ultrasound enhancement of microfiltration performace for natural organic matter removal, Organic Geochemistry, 38: 1091-1096 (2007).