ISSN 0104-6632 Printed in Brazil
www.abeq.org.br/bjche
Vol. 31, No. 04, pp. 913 - 923, October - December, 2014 dx.doi.org/10.1590/0104-6632.20140314s00002655
Brazilian Journal
of Chemical
Engineering
WET OXIDATION OF GLYCEROL INTO FINE
ORGANIC ACIDS: CATALYST SELECTION AND
KINETIC EVALUATION
J. E. N. Brainer
1*, D. C. S. Sales
1, E. B. M. Medeiros
2, N. M. Lima Filho
1and
C. A. M. Abreu
11
Universidade Federal de Pernambuco, Laboratório de Processos Catalíticos, LPC, Departamento de Engenharia Química, Universidade Federal de Pernambuco, 50740-520, Recife - PE, Brazil.
Phone: + 55 (81) 94088082, Fax: +55 (81) 2126-7289 *
E-mail: [email protected]
E-mail: [email protected], [email protected], [email protected]
2Universidade Federal da Paraíba, Centro de Tecnologia de Desenvolvimento Regional,
Campus I, 58051-900, João Pessoa - PB, Brazil.
(Submitted: April 12, 2013 ; Revised: November 5, 2013 ; Accepted: November 26, 2013)
Abstract - The liquid phase oxidation of glycerol was performed producing fine organic acids. Catalysts based on Pt, Pd and Bi supported on activated carbon were employed to perform the conversion of glycerol into organic acids at 313 K, 323 K and 333 K, under atmospheric pressure (1.0 bar), in a mechanically agitated slurry reactor (MASR). The experimental results indicated glycerol conversions of 98% with production of glyceric, tartronic and glycolic acids, and dihydroxyacetone. A yield of glyceric acid of 69.8%, and a selectivity of this compound of 70.6% were reached after 4 h of operation. Surface mechanisms were proposed and rate equations were formulated to represent the kinetic behavior of the process. Selective formation of glyceric acid was observed, and the kinetic parameter values indicated the lowest activation energy (38.5 kJ/mol) for its production reaction step, and the highest value of the adsorption equilibrium constant of the reactant glycerol (10-4 dm3/mol).
Keywords: Glycerol oxidation; Catalysts; Glyceric acid; Kinetics; Modeling.
INTRODUCTION
Glycerol is an important renewable resource de-rived from biomass and is currently used in pharma-ceutical, food and cosmetics applications (Corma et al., 2007; Luo et al., 2008; Ferretti et al., 2010; Lehr
et al., 2007; Guo et al., 2009). The conversion of glycerol is of interest because it is a byproduct of biodiesel production from plant and animal oils (Tullo, 2007). The rapid expansion of biodiesel pro-duction capacity around the world has caused a major surplus of glycerol (McCoy, 2006).
This increasing production of biodiesel has re-sulted in a price decline of crude glycerol, making aqueous glycerol an attractive compound for the synthesis of fine chemicals (Behr et al., 2008).
(Mallat and Baiker, 1995; Kimura et al., 1993; Kimura, 1993; Fordham et al., 1996). Tartronic acid and oxalic acid are also formed by oxidation of glyceric acid and dihydroxyacetone (Fordham et al., 1996; Worz, 2009). An increasing number of studies on oxidation of glycerol with oxygen in aqueous solution have been conducted with catalysts based on palladium and platinum (Kimura et al., 1993; Kimura, 1993; Fordham et al., 1996). The addition of bismuth as a promoter incorporated to the palladium and platinum catalysts had an influence on the catalyst selectivity (Alardin et al., 2001). The mechanism of glycerol oxidation on theses catalysts has been shown to in-volve oxidative dehydrogenation. Thus, it was ob-served that the presence of NaOH was important for the initiation of the catalytic glycerol oxidation (Carrettin et al., 2001; Demirel et al., 2005; Ketchie
et al., 2007; Ketchie et al., 2007).
The knowledge of a phenomenological kinetic model that can correctly predict the transformation of glycerol will be useful for selection of operating conditions depending on the desired goal. Phenome-nological models to represent experimental results of glycerol oxidation, in order to obtain selective or-ganic acids, have been proposed, (Ketchie et al., 2007; Demirel et al., 2007).
The purpose of this work was to develop the cata-lytic oxidation of glycerol in alkaline media in the presence of platinum, palladium and bismuth cata-lysts supported on activated carbon with different metal compositions. The selectivity of the process was evaluated in terms of the main products glyceric and tartronic acids. The experimental evidences allowed the formulation of a reaction scheme based on ki-netic modeling according to the Langmuir-Hin-shelwood approach.
EXPERIMENTAL
Catalyst Preparation
The carbon-supported catalysts were prepared by wet impregnation, followed by calcination and re-duction. The choice of the method was due to indica-tions of oxidation activities for glycerol conversion (Verde et al., 2004; Gallezot, 1997). The catalysts were formulated based on the following composi-tions: Pt(3.0 wt.%)/C and Pd(0.2 Pt(1.0 wt.%)-Bi(2.0 wt.%)/C. The activated carbon (Ref. C-119) used as support was from Carbomafra (Brazil). The pH was adjusted to values above or below the isoelectric point of activated carbon, about 6.8, due
to the need to incorporate metal in the form of anions or cations during impregnation.
The salts H2PtCl6·6H2O (>99%) and Bi(NO3)3.5H2O
(>98%) were supplied by VETEC (Brazil) and PtCl2
(99.99%) and PdCl2(99.99%) were supplied by Acros
Organics. Glyceric acid (GCA, 99.9%) and 1,3-dihy-droxyacetone dimer (DHA, 97%) were obtained from Sigma-Aldrich Corporation (USA), tartronic acid (TTA, 98%) from ALFA AESAR (USA), glycolic acid (GLYCA, 70 wt.% in water) and oxalic acid (OXA, 99.9%) from VETEC (Brazil).”
The platinum catalyst was prepared by wet im-pregnation of the activated carbon with an acidic solu-tion of [PtC16]
ions at 298 K for 24 h. The water was evaporated at an increased temperature under vacuum. The catalyst was dried in air at 333 K for 12 h and then reduced in a hydrogen atmosphere for 2 h at 533 K.
The Pd-Pt-Bi/C catalyst was prepared by wet co-impregnation of the support with acidic solutions of PtCl2, PdCl2 and Bi(NO3)3.5H2O. The activated carbon
(AC) was previously washed with distilled water, fil-tered off and dried overnight at 333 K. The catalysts were impregnated with salt solutions and dried under vacuum. First, the salt precursor Bi(NO3)3.5H2O
deposited on the support was decomposed upon heat-ing under a nitrogen stream at 723 K durheat-ing 18 h. Then, the catalysts were reduced under a hydrogen atmosphere. The system was heated with a ramp rate of 5 K/min until 533 K, with a hydrogen flow of 60 cm3/min and then was kept under isothermal conditions for 5 hours.
Catalysts Characterization
The X-ray diffraction (XRD) analyses of the cata-lysts were performed using a Rigaku DMAX model 2400 X-ray diffractometer (Cu Kα radiation, 40 kV, 20 mA). Diffraction data was recorded using a con-tinuous scanning at 0.02º/s, step 0.02º. The crystal-line phases were identified by reference to the JCPDS data file. The chemical composition of the samples was determined by X-ray fluorescence analysis (XRF), using a Rigaku spectrometer, model Rix 3100, controlled by software Rix 3100, with an X-ray tube of Rh anode. The textural characteristics, spe-cific surface area and pore volume (BJH method) were determined by N2 physisorption at 77 K in a
Micromeritics ASAP 2020.
Acid sites of the support were identified by the results of the determination of superficial groups by Boehm titrations with NaHCO3, NaOH, Na2CO3 for
Oxidation Experiments
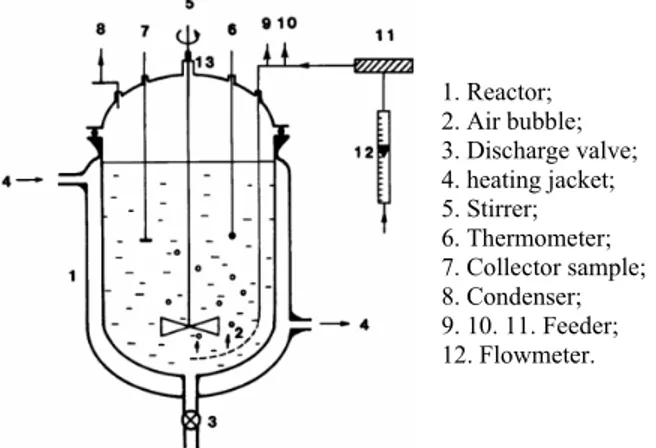
The glycerol oxidation experiments were per-formed in a borosilicate glass reactor of the mechani-cally agitated slurry reactor (MASR) type (Figure 1) equipped with a two-bladed turbine-type impeller mixer.
1. Reactor; 2. Air bubble; 3. Discharge valve; 4. heating jacket; 5. Stirrer; 6. Thermometer; 7. Collector sample; 8. Condenser; 9. 10. 11. Feeder; 12. Flowmeter.
Figure 1: Scheme of the mechanically agitated slurry
reactor (MASR).
The system was operated in batch mode for the solid and liquid phases under continuous gas flow during 4 hours. First, the Pt(3.0 wt.%)/C catalyst was evaluated in terms of the glycerol conversion with selectivities in acids. Then, a commercial trimetallic (Pt-Pd-Bi/C) catalyst, supplied by Evonik (USA), was tested as a reference for glycerol conversion by selective oxidation to acids. Based on the results obtained, the Pt-Pd-Bi catalyst with low content of metals (3.2% weight) was evaluated.
An aqueous solution of glycerol (1.08 M, 700 cm3) was prepared and mixed with NaOH at the molar ratio [NaOH]/[glycerol] =1.5. Catalyst was added in masses of 5 and 10 g. Oxygen was bubbled through the solution at a constant flow rate of 43 dm3/h through a valve located at the top of the reactor. Atmospheric pressure (1.0 bar) was maintained. A thermal sensor in the reactor and an external heating element controlled the temperature at 333 K with the accuracy of ±1.0 K.
Analyses of the Reaction
The samples taken each 30 min were analyzed by High Performance Liquid Chromatography (RI de-tector, Waters, USA). The separation was performed with an Aminex HPX 87H column at 323 K with 0.005 M aqueous sulfuric acid solution (0.6 cm3/min) as eluent. The identification and quantification of the reactant and products (glycerol, glyceric acid, tartronic
acid, glycolic acid, oxalic acid) were done by com-parison with standard solutions.
RESULTS AND DISCUSSION
Characterization of Catalysts
The diffractograms of the trimetallic Pd(4.0 wt.%)-Pt(1.0 wt.%)-Bi(5.0 wt.%)/C commercial catalyst from Evonik and of the Pd(0.2 wt.%)-Pt(1.0 wt.%)-Bi(2.0 wt.%) catalyst prepared from inorganic ligands indi-cated the presence of metallic Pd(2θ=40.1). The XRD analysis showed the presence of an intermetallic compound with the composition BiPd3(2θ=28.5),
metallic bismuth(2θ=24.6) and minor amounts of Bi2O3 (2θ=30.3). Moreover, XRD characterization of
the monometallic Pt/C and trimetallic Pd-Pt-Bi/C catalysts prepared confirmed the presence of metallic Pt(2θ = 39.8).
The chemical composition of the constituent metal components determined by X-ray fluorescence (XRF) analyses was found to be Pd:Pt:Bi: 0.18:1.00:1.95 for the trimetallic catalyst prepared and Pd:Pt:Bi: 3.80: 1.00:4.70 for the commercial catalyst. The error as-sociated with the analysis was ±0.01. The surface area measurements showed that deposition of the precur-sors on the support initially caused a decrease in sur-face area, followed by an increase after their thermal decomposition. The values of the BET surface areas of the Pd-Pt-Bi/C and Pt/C are presented in Table 1.
Acid functional groups on the support surface, determined by Boehm titrations, presented 0.051 mEq.g-1 of lactonic acid groups and 0.352 mEq.g-1 of phenolic acid groups.
Table 1: Surface area of catalysts.
Catalyst SBET
(m2/g)
Pd(4.0 wt.%)-Pt(1.0 wt.%)-Bi(5.0 wt.%)/C 930
Pd(0.2 wt.%)-Pt(1.0 wt.%)-Bi(2.0 wt.%)/C 640
Pt(3.0 wt.%)/C 680
The process was initially evaluated with the mono-metallic platinum catalyst, then, to obtain improved conditions of acid production, the catalyst formu-lated with platinum, palladium and bismuth was tested.
Oxidation of Glycerol with Platinum Catalyst
313 K and 333 K, under 1.0 bar. The reactant (glycerol, GLY) and the products (glyceric acid, GCA; tartronic acid, TTA; glycolic acid, GLYCA; oxalic acid, OXA; dihydroxyacetone, DHA) were analyzed by HPLC with satisfactory separation resolutions. The influence of the temperature of reaction was analyzed. The re-sults of the operation at 333 K are shown in Figure 2.
The platinum catalyst Pt(3.0 wt.%)/C presented a high activity for the oxidation process, reaching 99.1% of glycerol conversion at 4 hr of reaction time, at 333 K. The main products were glyceric and tartronic acids, while other compounds were ob-tained in low concentration and could be considered as by-products. The reaction operations performed at 313 K, under the same conditions, presented results that were comparable in terms of conversion (XGLY =
100x(CGLY0 – CGLY)(CGLY0)-1) and selectivity (Si =
100x Ci(CGLY0 – CGLY)-1; i = acids, DHA) with those
obtained at 333 K (Table 2).
It was observed that the catalyst containing plati-num provided a high conversion, but low selectivi-ties in acids. Fordham et al. (1995) indicated the use of other metals acting as promoters to increase the selectivity in acids. Thus, the catalyst formulated as Pd(4.0 wt.%)-Pt(1.0 wt.%)-Bi(5.0 wt.%)/C, supplied by Evonik, USA, was tested. Figure 3 presents the
evolution of the concentrations of the components of the oxidation processed at 333 K with the commer-cial trimetallic catalyst. The glycerol was pratically all converted (98%) after 4 hr (Figure 3), and a significant production of glyceric acid was obatined, higher than that obtained with the monometallic catalyst Pt(3.0 wt.%)/C.
The conversions of glycerol and the product se-lectivities at the temperatures 333 K and 313 K ob-tained with the catalyst Pd(4.0 Pt(1.0 wt.%)-Bi(5.0 wt.%)/C are compared in Table 3. It was ob-served that the temperature influenced directly the selectivity of glyceric acid, which decreased from 62.7% at 313 K to 46.3% at 333 K.
Considering the activity obtained with the catalyst provided by Evonik (USA), the evaluation of the catalyst formulated as Pd(0.2 wt.%.) - Pt(1.0 wt.%) – Bi(2.0 wt.%)/C was performed. In this case, oxygen was supplied by atmospheric air. The results in terms of the concentrations of the reactant and products are shown in Figure 4.
The formulated catalyst presented high conver-sion and selectivity (Table 4), similar to those of the catalyst produced by Evonik. However, it was more selective for the oxidation of the primary OH group, producing mainly the glyceric acid.
0 1 2 3 4
0.0 0.2 0.4 0.6 0.8 1.0 1.2
C
onc
ent
rat
ion (mo
l/L)
Time (h)
Glycerol Glycolic acid Tartronic acid Glyceric acid Dihydroxyacetone Oxalic acid
Figure 2: Concentration profiles of reactant and products of oxidation of glycerol. Reaction
conditions: catalyst Pt(3.0 wt.%)/C, 10 g, initial concentration 1.08 M, molar feed ratio [NaOH]/[glycerol] = 1.5, 333 K,
2
O
P = 1.0 bar, 500 rpm.
Table 2: Conversion of glycerol and selectivity of acids. Effect of temperature. Reaction conditions: catalyst Pt(3.0 wt.%)/C, 10 g, initial concentration 1.08 M, molar feed ratio
[NaOH]/[glycerol] = 1.5, PO2 = 1.0 bar, 500 rpm, reaction time 4 hr.
Temperature(K) SOXA(%) STTA(%) SGCA(%) SGLYCA(%) SDHA(%) XGLY(%)
313 6.2 29.8 30.1 19.7 14.3 98.8
0 1 2 3 4 0.0
0.2 0.4 0.6 0.8 1.0 1.2
C
on
c
en
tr
at
io
n (
m
o
l/
L)
Time (h)
Glycerol Glycolic acid Tartronic acid Glyceric acid Dihydroxyacetone Oxalic acid
Figure 3: Concentration profiles of reactant and products of oxidation of glycerol. Reaction
conditions: catalyst Pd(4.0 wt.%)-Pt(1.0 wt.%)-Bi(5.0 wt.%)/C-Evonik, 10 g, initial concentration 1.08 M, molar feed ratio [NaOH]/[glycerol] = 1.5, 333 K,
2 O
P = 1.0 bar, 500 rpm.
Table 3: Conversion of glycerol and selectivity of acids. Effect of temperature. Reaction conditions: catalyst Pd(4.0 wt.%)-Pt(1.0 wt.%)-Bi(5.0 wt.%)/C (Evonik, USA), 10 g, initial concentration 1.08 M glycerol, molar [NaOH]/[glycerol] = 1.5,
2
O
P = 1.0 bar, 500 rpm, reaction
time 4 hr.
Temperature(K) SOXA(%) STTA(%) SGCA(%) SGLYCA(%) SDHA(%) XGLY(%)
313 6.3 19.1 62.7 10.9 < 1.0 92.2
333 13.9 20.9 46.3 16.9 2.0 98.0
0 1 2 3 4
0.0 0.2 0.4 0.6 0.8 1.0 1.2
C
on
c
en
tr
at
io
n (
m
o
l/
L)
Time (h)
Glycerol Tartronic acid Glyceric acid Dihydroxyacetone Oxalic acid
Figure 4: Concentration profiles of reactant and products of oxidation of glycerol. Reaction
conditions: catalyst Pd(0.2 wt.%)-Pt(1.0 wt.%)- Bi(2.0 wt.%)/C, 5.0 g, initial concentration 1.08 M, molar feed ratio [NaOH]/[glycerol] = 1.5, 333 K, PAir= 1.0 bar, 500 rpm.
Table 4: Conversion of glycerol and selectivity of acids. Effect of temperature. Reaction conditions: catalyst Pd(0.2 wt.%)-Pt(1.0 wt.%)- Bi(2.0 wt.%)/C, 5.0 g, initial concentration
1.08 M glycerol, molar [NaOH]/[glycerol] = 1.5, PAir= 1.0 bar, 500 rpm, reaction time 4 hr.
Temperature(K) SOXA(%) STTA(%) SGCA(%) SGLYCA(%) SDHA(%) XGLY(%)
313 3.2 7.1 80.1 < 1.0 8.5 83.5
Kinetic Modeling
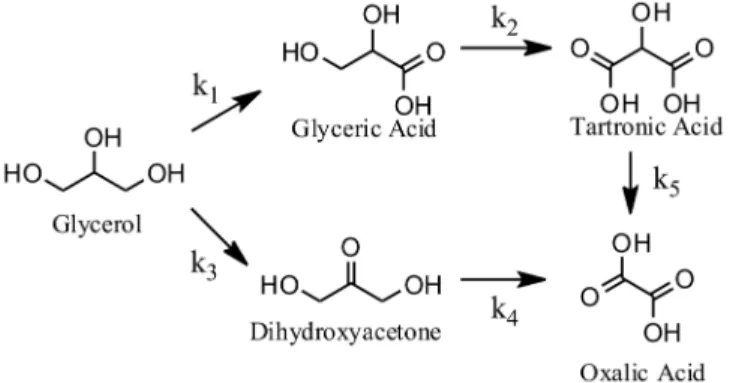
Based on the experimental evidence obtained with Pt(3.0 wt.%)/C and Pd(4.0 wt.%)-Pt(1.0 wt.%)- Bi(5.0 wt.%)/C catalysts, and the indications made by Worz et al. (2009), a reaction network was as-sumed (Scheme 1). According to the proposal, the oxidation of the primary OH group of glycerol (GLY) leads mainly to glyceric acid (GLYA), followed by tartronic acid (TTA). Through the oxidation of the secondary OH group of glycerol, dihydroxyacetone (DHA) was obtained, and then converted into oxalic acid (OXA).
The reaction network assumed allowed the for-mulation of a simplified network (Scheme 2). The simplified mechanism considers only the chemisorp-tion of oxygen and adsorpchemisorp-tion of glycerol and acid products formed by oxidation. Intermediates whose yields were very small are neglected.
Based on the Langmuir-Hinshelwood approach, the kinetic model was formulated considering the glycerol oxidation network (Scheme 1). It was con-sidered that glycerol and acids compete with each other for the same metallic sites, while molecular oxygen was adsorbed on the acid sites of the support. It was assumed that the adsorption of the products was weaker than that of glycerol, which was ad-sorbed with moderate intensity.
The detailed reaction steps are indicated in Table 5, with the corresponding reaction rate expressions.
In these expressions, ri and ki (i = reaction steps) are the reaction rates and the constant reaction rates, respectively. Θj are the fractions of the occupied sites, where j = glycerol, acids.
2 2
2 2
(1 )(1 )
=
+ +
∑
P P +P i j O j O i
GLY GLY j j O O j
k K K C C
r
K C K C K C (1)
j
C are the concentrations of the reaction compo-nents and Kj the corresponding adsorption equilib-rium constants. Considering that product adsorption should be weaker than that of glycerol, it was assumed that:
∑
P P<< +1 ;P
j j GLY GLY j
K C K C jp = products.
The experiments were carried out with oxygen in
excess, so that kij' ( 2 2 2 2
'
(1 )
= +
i j O O ij
O O
k K K C k
K C ) can be
iden-tified as pseudo-kinetic constants. Thus, the reaction rates can be written as:
1
= +
' ij j i
GLY GLY
k C r
( K C ) (2)
Under the operating conditions, in order to con-firm the rate-controlling regime in the catalytic reaction steps, the mass transfer limitations through the Weisz criterion, Ф′GLY (Φ′GLY = rGLYexp(dp/ 6)2
(
)
1,
−
eGLY GLY
D C and the external mass transfer re-sistance fraction feGLY (feGLY =rGLYexp(dp/ 6)
1
(kGLYmCGLY)− were quantified (Villermaux, 1993). The estimated values Ф′GLY =2.34 10x −2 → 0;
3
1.73 10 0.05−
= <<
eGLY
f x show that the process was
rate-controlling, indicating that there were no mass transfer limitations.
Scheme 2: Simplified reaction network for the catalytic oxidation of glycerol in alkaline medium.
Table 5: Glycerol oxidation steps.
Adsorption Step Reaction step Reaction rate Adsorption equilibrium constant 1, 1, . ad d k k
GLY A GLY A
−
⎯⎯⎯→
+ ←⎯⎯⎯ - - 1,
1, ad G d k K k− = 2, 2,
2 2.
ad
d
k
k
O AC O AC
−
∗⎯⎯⎯→ ∗
+ ←⎯⎯⎯
1
2
. . k .
GLY A O AC+ ∗⎯⎯→GCA A
3
2
. . k .
GLY A O AC+ ∗⎯⎯→DHA A
2
1 1 GLY O r= Θk Θ
2
3 3 GLY O r = Θk Θ
2 2, 2, ad O d k K k− = 3, 3, . ad d k k
GCA A GCA A
−
⎯⎯⎯→ +
←⎯⎯⎯ 2
2
. . k .
GCA A O AC+ ∗⎯⎯→TTA A r2= Θk2 GCAΘO2
3, 3, ad GCA d k K k− = 5, 5, . ad d k k
TTA A TTA A
−
⎯⎯⎯→ +
←⎯⎯⎯ 5
2
. . k .
TTA A O AC+ ∗⎯⎯→OXA A r5= Θ Θk5 TTA O2
4, 4, ad TTA d k K k− = 5, 5, . ad d k k
DHA A DHA A
−
⎯⎯⎯→ +
←⎯⎯⎯ 4
2
. . k .
DHA A O AC+ ∗⎯⎯→OXA A r4= Θk4 DHAΘO2
5, 5, ad DHA d k K k− = 6, 6, . ad d k k
OXA A OXA A
−
∗
⎯⎯⎯→ +
←⎯⎯⎯ - - 6,
6, ad OXA d k K k− = 7, 7, . ad d k k
OXA A OXA A
−
∗∗
⎯⎯⎯→ +
←⎯⎯⎯ - - 7,
7, ad OXA d k K k− =
* OXA from DHA; ** OXA from TTA; A metal site; AC∗ support site.
The mass balance equations of the reaction com-ponents of the liquid phase are presented in Table 6.
The solution of the mass balance equations was obtained by the fourth-order Runge-Kutta method (MATLAB.ode45s subroutine) and the subroutine hybrid fractional error function (HYBRID) was used to obtain the best-fit between the calculated (Ccalj )
and the experimental data (CExpj ). The initializing values of the reaction rate constants and adsorption coefficients employed in the optimization procedure were obtained by a differential method and the indi-cations of Hu et al. (2011). The optimization proce-dure was performed with the data of each isothermal operation and the values of the kinetic parameters (Table 7) and adsorption equilibrium constants were
estimated at 313 K, 323 K and 333 K. To confirm the results, the same procedure was applied for the set of experimental data obtained at the three tem-peratures. Then, Arrhenius and van’t Hoff laws were introduced and the parameters Eact and ∆Hads were
optimized (Table 8). The activation energy and heat of adsorption values obtained are of the same order as those found byHu et al. (2011).
An objective function was defined as: fOj=
2
( – )
∑ Exp Cal j j
C C , for the data of each component of the process. The experimental data were well pre-dicted by the model, with agreement with the objec-tive function between 10-3 and 10-2.
Table 6: Mass balance equations of the reaction components. w=mcat/VL.
Component Mass balance equation
GLY 1 3
1dCGLY r r w dt = −
' '
1 3
1 ( )
(1 )
GLY GLY GLY GLY
GLY GLY
dC k k C
w dt K C
+ = −
+
GCA 1 2
1dCGCA r r w dt = −
1 2
1
(1 )
' '
GCA GLY GCA GCA GCA
GLY GLY
dC k C k C
w dt K C
− =
+
DHA 3 4
1dCDHA r r
w dt = − 3 4
1
(1 )
' '
DHA GLY DHA DHA DHA
GLY GLY
dC k C k C
w dt K C
− =
+
TTA 2 5
1dCTTA r r w dt = −
2 5
1
(1 )
' '
TTA GCA GCA TTA TTA
GLY GLY
dC k C k C
w dt K C
− =
+
OXA 4 5
1dCOXA r r w dt = +
4 5
1
(1 )
' '
OXA DHA DHA TTA TTA
GLY GLY
dC k C k C
w dt K C
+ =
+
Table 7: Reaction rate constants. Conditions: catalyst Pt(1.0 wt.%)-Pd(0.2 wt.%)-Bi(2.0
wt.%)/C, molar feed ratio [NaOH]/[glycerol] = 1.5, PO2= 1.0 bar, 500 rpm.
Reaction rate constant, kj (mol/dm3.min)
Reaction step
313 K 323 K 333 K
1
2
. . k .
GLY A O AC+ ∗⎯⎯→GCA A 1.67x10⁻² 2.64x10⁻² 4.06x10⁻²
2
2
. . k .
GCA A O AC+ ∗⎯⎯→TTA A 1.22x10⁻³ 1.67x10⁻³ 2.25x10⁻³
3
2
. . k .
GLY A O AC+ ∗⎯⎯→DHA A 2.01x10⁻³ 4.07x10⁻³ 7.92 x10⁻²
4
2
. . k .
DHA A O AC+ ∗⎯⎯→OXA A 1.53x10⁻³ 4.06x10⁻³ 1.01x10⁻²
5
2
. . k .
TTA A O AC+ ∗⎯⎯→OXA A 1.34 x10⁻² 1.59x10⁻² 1.88x10⁻²
Table 8: Activation energies and heats of adsorption Conditions: catalyst Pd(0.2
wt.%)-Pt(1.0 wt.%)- Bi(2.0 wt.%)/C, molar feed ratio [NaOH]/[glycerol] = 1.5, 313 - 333 K, PAir=
1.0 bar, 500 rpm, reaction time 4 hr.
Reaction step Eaj (kJ/mol) Component -ΔHj(kJ/mol)
Glycerol → Glyceric acid 38.5 Glycerol 7.24
Glyceric acid →Tartronic acid 26.3 Glyceric acid 99.3
Glycerol → Dihydroxyacetone 59.6 Tartronic acid 39.7
Dihydroxyacetone → Oxalic acid 81.9 Dihydroxyacetone 59.6
Tartronic acid → Oxalic acid 14.6
0.0 0.5 1.0 1.5 2.0 2.5 3.0 3.5 4.0 0.0
0.2 0.4 0.6 0.8 1.0
Glycerol Tartronic acid Glyceric acid Dihydroxyacetone Oxalic acid Model
C
o
nce
n
tr
at
io
n (m
ol/
L
)
Time (h)
Figure 5: Experimental and predicted concentration profiles of reactant and products of
0.0 0.5 1.0 1.5 2.0 2.5 3.0 3.5 0.0
0.2 0.4 0.6 0.8 1.0
Glycerol Tartronic acid Glyceric acid Dihydroxyacetone Oxalic acid Model
C
o
nc
ent
rati
on
(mo
l/
L
)
Time (h)
Figure 6: Experimental and predicted concentration profiles of reactant and products of
oxida-tion of glycerol. Condioxida-tions: catalyst Pd(0.2 wt.%)-Pt(1.0 wt.%)- Bi(2.0 wt.%)/C, 5.0 g, initial concentration 1.08 M, molar feed ratio [NaOH]/ [glycerol] = 1.5, 323 K, PAir= 1.0 bar, 500 rpm.
0.0 0.5 1.0 1.5 2.0 2.5 3.0 3.5 4.0 0.0
0.2 0.4 0.6 0.8 1.0
Glycerol Tartronic acid Glyceric acid Dihydroxyacetone Oxalic acid Model
C
o
n
c
ent
ra
tio
n
(mol
/L)
Time (h)
Figure 7: Experimental and predicted concentration profiles of reactant and products of
oxida-tion of glycerol. Condioxida-tions: catalyst Pd(0.2 wt.%)-Pt(1.0 wt.%)- Bi(2.0 wt.%)/C, 5.0 g, initial concentration 1.08 M, molar feed ratio [NaOH]/[glycerol] = 1.5, 333 K, PAir= 1.0 bar, 500 rpm.
The values of the rate constants for the steps of production of glyceric acid and dihydroxyacetone were slightly higher for this acid production step. The predominance of this step was confirmed by the magnitude of their activation energies. The produc-tion of dihydroxyacetone occurred with an activaproduc-tion energy about 1.5 times higher than that of the pro-duction of glyceric acid.
Considering the consecutive reaction steps (Scheme 2) and their activation energies, it was indi-cated that the production of oxalic acid occurred mainly via tartronic acid.
Adsorption equilibrium constants for glycerol were in the range of 5.77 x10⁻⁴ – 4.88x10⁻⁴ dm3/mol, while for the products (glyceric and tartronic acids, dihydroxyacetone) the orders of magnitude were from 1.30x10⁻¹⁸ to 9.71x10⁻¹⁰ dm3/mol.
These results would appear to confirm the hy-potheses considered in the formulation of the model,
including moderate adsorption of glycerol and weak adsorption of the products.
CONCLUSIONS
Glycerol oxidation was performed in this work using monometallic and trimetallic catalysts in a MASR reactor, presenting as products glyceric acid, tartronic acid, glycolic acid, oxalic acid and dihy-droxyacetone. The selectivity for glyceric acid in this process was greatly improved by use of the trimetallic catalyst Pd(0.2 wt.%)-Pt(1.0 wt.%)-Bi(2.0 wt.%)/C to enhance the oxidation of the primary OH group, reaching higher selectivity than with the cata-lyst containing only platinum on the support.
proposed based on the Langmuir-Hinshelwood mecha-nism. This simplified network was investigated and the kinetic and adsorption equilibrium parameters were obtained and related to the tendency for selective for-mation of acid glyceric, which presented the lowest value of activation energy (38.5 kJ/mol) for its pro-duction step and the highest adsorption equilibrium constant for the reactant glycerol (10-4 dm3/mol).
ACKNOWLEDGMENTS
The financial support from MCT/ANP (PRH-28) and FINEP/MCT/CNPq (Co-Produtos na Rede Bra-sileira de Tecnologia de Biodiesel RBTB) is ac-knowledged.
NOMENCLATURE
A active site on the surface of the catalyst
AC activated carbon
j
C concentrations of the reaction components
mol/dm3 Cal
j
C calculated concentration of
each component
mol/dm3
CExp – experimental concentration of each component
mol/dm3
GLY
C concentration of glycerol mol/dm3 0
GLY
C initial concentration of glycerol
mol/dm3 DHA dihydroxyacetone
p
d particle diameter m
eGLY
D diffusivity m2/s
a
E activation energy kJ/mol
eGLY
f external mass transfer fraction
GCA glyceric acid GLA glyceraldehyde GLY glycerol
GLYCA glycolic acid GOX glyoxalic acid HPA hydroxypyruvic acid
p
j products
GLYm
k mass transfer coefficient of glycerol
m/s
j
K equilibrium constant of adsorption/desorption on active sites
atm−1for oxygen and dm3/mol for other species
k rate constant mol/dm3.min
OXA oxalic acid
Air
P air pressure atm
2
O
P oxygen pressure atm
r reaction rate mol/dm3.min
exp
GLY
r experimental reaction rate of glycerol
mol/dm3.s S selectivity
TTA tartronic acid
w catalyst weight g
X conversion
Φ Thiele’s module
Θ fractions of the occupied sites
,
ΔHad j enthalpy of adsorption kJ/mol [ ] concentration of component mol/dm3 Subscripts
i step
j glycerol, acids
REFERENCES
Alardin, F., Ruiz, P., Delmonb, B. and Devillers, M., Bismuth-promoted palladium catalysts for the selective oxidation of glyoxal into glyoxalic acid. Appl. Catal. A: General, 215, 125-136 (2001). Behr, A., Eilting, J., Irawaldi, K., Leschinski, J. and
Lindner, F., Improved utilization of renewable resources: New important derivatives of glycerol. Green Chem., 10, 13 (2008).
Boehm, H. P., Some aspects of the surface chemistry of carbon blacks on other carbons. Carbon, 32, 759-769 (1994).
Boehm, H. P., Surface oxides on carbon and their analysis: A critical assessment. Carbon, 40, 145-149 (2002).
Carrettin, S., McMorn, P., Johnston, P. Griffin, K., Kiely, C. J. and Hutchings, G. J., Oxidation of glycerol using supported Pt, Pd and Au catalysts. Phys. Chem. Chem. Phys., 5, 1329-1336 (2003). Corma, A., Iborra, S. and Velty, A., Chemical routes
for the transformation of biomass into chemicals. Chem. Rev., 107, 2411-2502 (2007).
Demirel-Gülen, S., Lucas, M. and Claus, P., Liquid phase oxidation of glycerol over carbon support gold catalysts. Catal. Today, 102-103,166-172 (2005).
Ferretti, C. A., Soldano, A., Apesteguía, C. R. and Cosimo, J. I. Di, Monoglyceride synthesis by glyc-erolysis of methyl oleate on solid acid-base. Chem. Eng. J., 161, 346-354 (2010).
Fordham, P., Besson, M. and Gallezot, P., Selective catalytic oxidation of glyceric acid to tartronic and hydroxypyruvic acids. Appl. Catal. A: Gen-eral, 133,179-184 (1995).
Gallezot, P., Selective oxidation with air on metal catalysts. Catal. Today, 37, 405-418 (1997). Guo, L., Zhou, J., Mao, J., Guo, X. and Zhang, S.,
Supported Cu catalysts for the selective hydro-genolysis of glycerol to propanediols. Appl. Catal. A: Chem., 367, 93-98 (2009).
Hu, W., Lowry, B. and Varma, A., Kinetic Study of Glycerol Oxidation Network over Pt-Bi/C Cata-lyst. Appl. Catal. B: Environmental, 106, 123-132 (2011).
Ketchie, W. C., Murayama, M. and Davis, R. J., Pro-motional effect of hydroxyl on the aqueous phase oxidation of carbon monoxide and glycerol over supported Au catalysts. Top. Catal., 44, 307-317 (2007a).
Ketchie, W. C., Murayama, M. and Davis, R. J., Se-lective oxidation of glycerol over carbon-sup-ported AuPd catalysts. J. of Catalysis, 250, 264-273 (2007b).
Kimura, H., Tsuto, K., Wakisaka, T., Kazumi, Y. and Inaya, Y., Selective oxidation of glycerol on a platinum-bismuth catalyst. Appl. Catal. A: Gen., 96, 217-228 (1993).
Kimura, H., Selective oxidation of glycerol on a platinum-bismuth catalyst by using a fixed bed reactor. Appl. Catal. A: Gen., 105, 147-158 (1993). Lehr, V., Sarlea, M., Ott, L. and Vogel, H., Catalytic
dehydration of biomass-derived polyols in sub- and supercritical water. Catal. Today, 121, 121-129 (2007).
Luo, N., Fu, X., Cao, F., Xiao, T. and Edwards, P. P., Luo, N., Fu, X., Cao, F., Xiao, T. and Edwards, P. P., Glycerol aqueous phase reforming for hydro-gen hydro-generation over Pt catalyst – Effect of cata-lyst composition and reaction conditions. Fuel, 87, 3483-3489 (2008).
Mallat, T. and Baiker, A., Catalyst potential: A key for controlling alcohol oxidation. Catal. Today, 24, 143-150 (1995).
McCoy, M., Glicerin surplus. Chem. Eng. News, 84, 7 (2006).
Tullo, A. H., A living plant. Chem. Eng. News, 85, 53 (2007).
Verde, Y., Alonso, G., Zhang, R. V. H., Jacobson, A. J. and Keer, A., Pt/C obtained from carbon with different treatments and (NH4)2PtCl6 as a Pt
precur-sor. Appl. Catal. A: Gen., 277, 201-207 (2004). Villermaux, J., Génie de la réaction chimique
con-ception et fonctionnement des réacteurs. Tech-nique et Documentation Lavoisier, Paris (1993). (In French).
![Figure 2: Concentration profiles of reactant and products of oxidation of glycerol. Reaction conditions: catalyst Pt(3.0 wt.%)/C, 10 g, initial concentration 1.08 M, molar feed ratio [NaOH]/[glycerol] = 1.5, 333 K,](https://thumb-eu.123doks.com/thumbv2/123dok_br/18896135.426415/4.918.329.652.623.846/concentration-profiles-reactant-products-oxidation-reaction-conditions-concentration.webp)
![Table 3: Conversion of glycerol and selectivity of acids. Effect of temperature. Reaction conditions: catalyst Pd(4.0 wt.%)-Pt(1.0 wt.%)-Bi(5.0 wt.%)/C (Evonik, USA), 10 g, initial concentration 1.08 M glycerol, molar [NaOH]/[glycerol] = 1.5,](https://thumb-eu.123doks.com/thumbv2/123dok_br/18896135.426415/5.918.159.763.528.846/conversion-glycerol-selectivity-temperature-reaction-conditions-catalyst-concentration.webp)
![Table 8: Activation energies and heats of adsorption Conditions: catalyst Pd(0.2 wt.%)- wt.%)-Pt(1.0 wt.%)- Bi(2.0 wt.%)/C, molar feed ratio [NaOH]/[glycerol] = 1.5, 313 - 333 K, P Air = 1.0 bar, 500 rpm, reaction time 4 hr](https://thumb-eu.123doks.com/thumbv2/123dok_br/18896135.426415/8.918.171.764.650.1005/table-activation-energies-adsorption-conditions-catalyst-glycerol-reaction.webp)

