BASIC RESEARCH
Abdominal adiposity, insulin and bone quality in
young male rats fed a high-fat diet containing
soybean or canola oil
Carlos Alberto Soares da Costa,I Aluana Santana Carlos,IAline de Sousa dos Santos,IAlexandra Maria Vieira Monteiro,II Egberto Gaspar de Moura,ICelly Cristina Alves Nascimento-SabaI
IInstituto de Biologia Roberto Alcaˆntara Gomes, Universidade do Estado do Rio de Janeiro, Rio de Janeiro, Brasil.IIHospital Universita´rio Pedro Ernesto, Universidade do Estado do Rio de Janeiro, Rio de Janeiro, Brasil.
OBJECTIVES: A low ratio of omega-6/omega-3 polyunsaturated fatty acids is associated with healthy bone properties. However, fatty diets can induce obesity. Our objective was to evaluate intra-abdominal adiposity, insulin, and bone growth in rats fed a high-fat diet containing low ratios of omega-6/omega-3 provided in canola oil.
METHODS:After weaning, rats were grouped and fed either a control diet (7S), a high-fat diet containing soybean oil (19S) or a high-fat diet of canola oil (19C) until they were 60 days old. Differences were considered to be significant ifp,0.05.
RESULTS: After 60 days, the 19S and 19C groups showed more energy intake, body density growth and intra-abdominal fat mass. However, the 19S group had a higher area (200%) and a lower number (44%) of adipocytes, while the 7S and 19C groups did not differ. The serum concentrations of glucose and insulin and the insulin resistance index were significantly increased in the 19C group (15%, 56%, and 78%, respectively) compared to the 7S group. Bone measurements of the 19S and 19C groups showed a higher femur mass (25%) and a higher lumbar vertebrae mass (11%) and length (5%). Computed tomography analysis revealed more radiodensity in the proximal femoral epiphysis and lumbar vertebrae of 19C group compared to the 7S and 19S groups.
CONCLUSIONS:Our results suggest that the amount and source of fat used in the diet after weaning increase body growth and fat depots and affect insulin resistance and, consequently, bone health.
KEYWORDS: Canola oil; Soybean oil; Bone; Computed tomography; Rat.
Costa CAS, Carlos AS, Santos AS, Monteiro AMV, Moura EG, Nascimento-Saba CCA. Abdominal adiposity, insulin and bone quality in young male rats fed a high-fat diet containing soybean or canola oil. Clinics. 2011;66(10):1811-1816.
Received for publication onMay 5, 2011;First review completed onMay 30, 2011;Accepted for publication onJuly 5, 2011 E-mail: [email protected] / [email protected]
Tel.: 55 21 25876134
INTRODUCTION
Obesity, a worldwide public health problem, usually begins early in life, persists into adulthood and significantly increases the risk for morbidity from dyslipidemia, type-2 diabetes mellitus, and coronary heart disease.1-3 These endocrine-metabolic disturbances can also interfere with bone remodeling.4Although genetic composition is a major contributor to peak bone mass, lifestyle factors (such as diet) also contribute to the attainment of peak bone mass.5,6
Despite the metabolic repercussions of obesity, extensive epidemiological data have shown that a high body weight or
body mass index (BMI) is associated with increases in bone mass and a reduced risk for fractures.7-9This event occurs directly via mechanical loading and indirectly via hormonal production by adipocytes or insulin.10,11 In contrast, inves-tigators have suggested that fat mass may or may not be associated with bone mass.12,13Given these discrepancies, the
effect of fat tissue on bone health is far from clear.
Adipocytes and osteoblasts share the same mesenchymal precursor; studying adipocyte/osteoblast balance represents a challenge to treating adipose tissue and bone disorders.14In
recent years, a growing body of evidence has supported the notion that dietary long-chain polyunsaturated fatty acids (PUFAs) with a chain length longer than 18C are beneficial for bone health.15In addition, a higher ratio of omega-6 (linoleic
acid, 1852n-6) to omega-3 (alpha linolenic acid, 1853n-3) fatty
acids is associated with detrimental bone health effects, and a lower ratio is associated with healthy bone properties.16These PUFAs can induce obesity by acting directly on preadipocytes, mainly increasing the rate of replication and/or differentiation17 Copyrightß2011CLINICS– This is an Open Access article distributed under
the terms of the Creative Commons Attribution Non-Commercial License (http:// creativecommons.org/licenses/by-nc/3.0/) which permits unrestricted non-commercial use, distribution, and reproduction in any medium, provided the original work is properly cited.
in the early stages of adipose tissue development.18Although
the role of a high-fat diet in obesity development have been extensively studied, the role of dietary fats on bone development has only recently emerged as an interesting area of research.5,6,17-20
Previously, we reported the effects of a normocaloric diet containing canola oil on adiposity and bone growth in young rats.21Canola oil (7%) seems to beneficially decrease
both abdominal adiposity and insulin resistance. However, it reduces bone density compared to 7% soybean oil. However, to the best of our knowledge, there have been no studies with an experimental model of bone metabolism in young rats fed a high-fat diet containing canola oil. In Brazil, the population consumption of soybean oil, which is rich in polyunsaturated fatty acids (ratio omega-6/omega-3 = 6.75), represents 82% of the calories originating from fat sources, while canola oil (ratio omega-6/omega-3 = 1.90) represents less than 4%.22,23
The aim of this study was to evaluate the body growth and bone health of young adult animals fed a high-fat diet containing soybean or canola oil after weaning.
MATERIALS AND METHODS
The protocol to use and handle the experimental animals was approved by the Ethics Committee of the Biology Institute of the State University of Rio de Janeiro, based on the principles adopted and promulgated by Brazilian law concerning the rearing and use of animals in teaching and research activities in Brazil.24
Wistar rats were kept in a room under a controlled temperature (25¡1˚C) and an artificial dark-light cycle
(lights on from 07:00 to 19:00 hours). Virgin female rats (three months old) were caged with male rats, and, after mating, each female was placed in an individual cage with free access to water and food until delivery.
Within 24 h of birth (day 0), any excess pups were removed, such that only six male pups were kept per dam. This procedure has been shown to maximize lactation performance.25During the 21 days of lactation, the rat dams were continued on anad libitumdiet of standard laboratory food (AgroceresH, Sa˜o Paulo).
Male Wistar rats from six different litters were rando-mized and grouped on postnatal day 21 to receive either a control diet containing 7 ml of soybean oil and 54 g of cornstarch/100 g (7S group; n = 12) or a high-fat diet containing either 19 ml of soybean (19S group; n = 12) or canola oil (19C group; n = 12) along with 42 g of cornstarch/ 100 g. The 7S and high-fat diet groups received the same amounts of vitamins and minerals per gram of diet (Table 1). The diets were manufactured once a week and stored as pellets at 4˚C in agreement with American Institute of Nutrition (AIN-93G) recommendations.26,27 The energy intake (kcal/day) and body density (body mass [g] divided by the length [cm, measured as the distance from tip of the nose to the tip of the tail])28were evaluated in all pups every
three days. All groups had free access to diet and water during the course of experimental period.
At 59 days of age, the rats were deprived of food overnight, and, the next morning (at 60 days), the fasting rats were anesthetized with a lethal dose of pentobarbital. Blood was obtained by cardiac puncture. The abdominal fat mass, right femur and lumbar spine were excised. The blood samples were centrifuged to obtain the serum, which was
stored at -20˚C for a posterior analysis of glucose, calcium, and phosphorus by the colorimetric method (Bioclin, Belo Horizonte, MG, Brazil). The serum insulin concentration was analyzed using an RIA kit in only one assay (Linco Research, Inc., St. Charles, MO, USA). To determine the insulin sensitivity of the animals, we used the insulin resistance index (IRI), defined as the fasting insulin (mUI/ ml)6the fasting glucose (mmol/l).
The abdominal fat depots were dissected and weighed, and the values were expressed in grams (g). The samples of retroperitoneal fat were collected and fixed in buffered formaldehyde. The tissues were embedded in paraffin, cut into 5mm sections and stained with hematoxylin-eosin. For the morphometric analyses, profiles with at least 100 adipocytes were randomly selected and captured for each animal. The cross-sectional area (mm2) and number (per 100mm2) of adipocytes were determined from the digital images acquired (TIFF format, 36 bit color, 136061024
pixels) with an Optronics CCD video camera system and an Olympus BX40 microscope and analyzed with Image-Pro Plus version 5.0 software (Media Cybernetics, Silver Spring, MD, USA).21Two different observers independently eval-uated the images and obtained similar results.
The right femur and lumbar vertebrae (LV1-LV6) were cleaned to remove any soft tissue. The distance between the epiphysis29 and the LV1-LV65 and the medial-point
dia-physis width (mm for both measurements) were measured using calipers (0.01-mm readability) and stored in saline solution at -20˚C until analysis. After a single scan by computed tomography (CT, Helicoidally model HISPEED, GEH), the images were obtained from 5-mm-thick axial slices. The radiodensity (expressed as Hounsfield units, HU) of the proximal epiphysis and the diaphysis of the femur and the mean cross-sectional areas of the lumbar vertebrae were measured using computerized analysis software (DicomWorks v1?3?5, 2002) by manual selection of the region of interest.30 After the computed tomography analyses, the femur and LV1-LV6 were dried overnight at 95˚C and weighed (mg).31
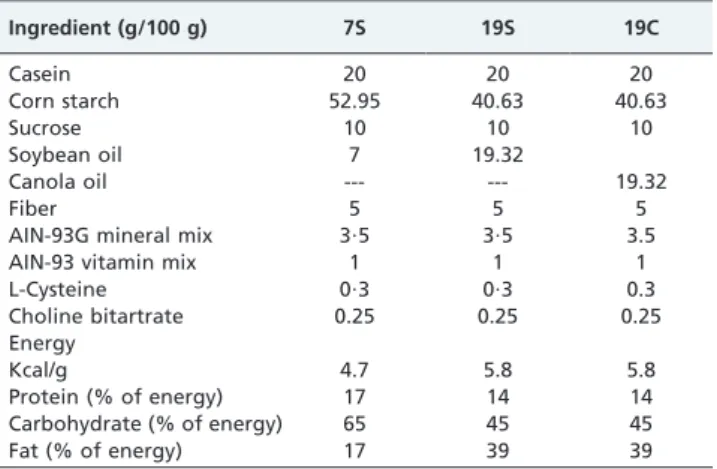
Table 1 -The compositions of the experimental diets.
Ingredient (g/100 g) 7S 19S 19C
Casein 20 20 20
Corn starch 52.95 40.63 40.63
Sucrose 10 10 10
Soybean oil 7 19.32
Canola oil --- --- 19.32
Fiber 5 5 5
AIN-93G mineral mix 3?5 3?5 3.5
AIN-93 vitamin mix 1 1 1
L-Cysteine 0?3 0?3 0.3
Choline bitartrate 0.25 0.25 0.25
Energy
Kcal/g 4.7 5.8 5.8
Protein (% of energy) 17 14 14
Carbohydrate (% of energy) 65 45 45
Fat (% of energy) 17 39 39
7S, the control group fed a diet containing 7 ml/100 g soybean oil; 19S and 19C, the experimental groups fed diets containing 19 ml/100 g soybean or canola oil, respectively.
casein; mineral and vitamin mix; L-cysteine; choline bitartrate:
Agroquı´micaH; corn starch: CargillH; fiber: Natural PharmaH; soybean and canola oil: Proquı´miosH; commercial sucrose: Unia˜oH.
Statistical analyses were performed using the GraphPad Prism statistical package (version 5.00, 2007, San Diego, CA, USA). The energy intake and body density were analyzed using two-way ANOVA followed by post hoc Bonferroni tests. The remaining results were analyzed using one-way ANOVA followed bypost hoc Newman-Keuls tests. All of the results are expressed as means¡SEM with a significance
level of 0.05.
RESULTS
After weaning, the 19S and 19C groups showed similar energy intake and body density growth, but these were significantly increased compared to the control group at 27 days of age (Figure 1).
The intra-abdominal fat mass did not differ between the 19S (12.0¡0.6 g) and 19C (11.4¡1.0 g) groups; however, it
was significantly higher (p,0.05) compared to the 7S group (7.2¡0.7 g). The morphometric analyses of the adipocytes
revealed larger cells in the 19S group (5048¡201.2mm2; p,0.0001) than in the 7S (2607¡186.3mm2) and 19C (2489¡322?7mm2) groups. However, the number of adipo-cytes in the 19S (20.17¡0.73) group was significantly less
than in the 7S (36.33¡2.59) and 19C (36.18¡3.52) groups
(Figure 2).
The serum analyses did not reveal any differences in the calcium and phosphorus concentrations. The 19C group showed significantly higher concentrations of glucose (+15%) and insulin (+56%) and an increased insulin resistance index (+78%) compared to the 7S group. The 19S group did not differ from 7S and 19C groups (Table 2). Differences in the femur mass between the 19S and 19C groups were not found. However, they were higher (+25%;
p,0.05) in these groups than in the C group. The femur measurements showed that the distance between the epiphyses was similar in all of the groups, and the width of the diaphysis was higher in the 19C group (+9%;p,0.05). The mass and the length of lumbar vertebrae did not differ between the 19S and 19C groups, but they were higher (+11% and+5%;p,0.05, respectively) in these groups than in the 7S group (Table 3).
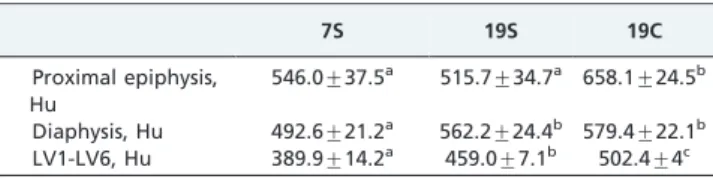
Evaluating the femur using computed tomography (CT) showed that the radiodensity of the proximal epiphysis in the 19C group was significantly higher than in the 19S and control groups (+20% and +27%, respectively). The radio-density of the diaphysis did not differ between the 19S and 19C groups, but these groups had significantly higher (+15%) diaphyseal radiodensities compared to the control
group. The lumbar vertebrae analysis of the 19S and 19C groups using CT showed an increased radiodensity (+17% and +29%; p,0.05, respectively). Simultaneously, the 19C group was greater lumbar radiodensity (+9%;p,0.05) than the 19S group when comparing the high-fat groups (Table 4).
DISCUSSION
Dietary fat is calorie-dense and extremely palatable. It is easily overconsumed because it can cause less satiety than carbohydrates and protein,17 causing ‘‘high-fat
hyperpha-gia.’’32However, we did not verify hyperphagia when the
rats were fed a high-fat diet containing soybean or canola oil after weaning.33Nevertheless, the increase in the diet lipids’ caloric percentile from 17% to 39% contributed to increased body density growth and larger intra-abdominal fat depots in the 19S and 19C groups, independent of the vegetable oil type and absence of hyperphagia.
Hyperlipidic diets affect cell morphology, hormone sensitivity, and gene expression within the preexisting adipocytes in a complex manner. These lead to the recruitment of adipocyte precursor cells, initiating differ-entiation and producing the infrastructure required to sustain the new tissue.34,35 In our experimental model,
despite the similar gains in body density and intra-abdominal fat mass, the 19S group showed an increase in the size and a decrease in the number of retroperitoneal adipocytes compared to the 19C group. Other authors studying models of obesity induced by a high-fat diet intake have observed that the development of body fat compart-ments and the adipocyte fatty acid composition are affected by the type of fat contained in the diet.36-39When a high-fat diet containing omega-6 is consumed, peroxisome prolif-erator-activated receptor gamma (PPARc) helps to convert unspecialized cells into adipocytes to store extra fat.40 Interestingly, high-fat diets containing omega-3 (PUFA) limit post-intake fat storage and adipocyte hypertrophy.41In contrast, canola oil (when compared to soybean oil) is characterized by very low levels of omega-6 (21%vs. 54%, respectively) and high levels of omega-3 (11% vs. 8%,
Figure 1 -Energy intake (A) and body density (B) post-weaning until 60 days-old. Control group, fed with diet containing 7ml of soybean oil /100g (
respectively).23Thus, these pathways help to explain the cell size distribution of the retroperitoneal adipocytes.
From the bone analysis, the increases in the body density and abdominal fat depots might be associated with the increases in the femur mass, the lumbar vertebrae mass and length, and the radiodensity of diaphysis and lumbar vertebrae in the groups fed a high-fat diet. Some human
and experimental studies have revealed a positive relation-ship between body weight or body mass index (BMI) and bone mass. This is mediated by mass mechanical stress,
Figure 2 -(A) Intra-abdominal fat mass. (B) Adipocyte size and (C) number of retroperitoneal adipocytes. Groups fed with control diet (7S, n = 12) or with high fat diet containing soybean (19S, n = 12) or canola oil (19C, n = 12), at 60 days.a,bValues with different superscripts are significantly different (one-way ANOVA;p,0.05). Photomicrographs of the adipose tissue staining with Hematoxylin-Eosin (original magnification 200X): (D) 7S, (E) 19S and (F) 19C groups.
Table 2 -Serum analyses after 60 days.
7S 19S 19C
Calcium, mg/dL 9.8¡0.2 9.3¡0.1 9.4¡0.2
Phosphorus, mg/dL 9.5¡0.4 10.4¡0.4 8.8¡0.3
Glucose, mg/dL 97.3¡3.5a 104.7
¡2.8a,b 112.0 ¡3.6b Insulin,mUI/ml 37.6¡4.3a 43.5¡2.5a,b 58.4¡7.3b Insulin Resistance Index (IRI) 203.3¡0.8a 252.0¡0.4a,b 363.0¡1.4b
The post-weaning groups were fed a control diet (7S; n = 12) or a high-fat diet containing either soybean (19S; n = 12) or canola oil (19C; n = 12) until they were 60 days old.
a,bMean values within a row with dissimilar superscript letters were significantly different (one-way ANOVA;p,0.05).
Table 3 -Femur and lumbar vertebrae (LV1-LV6) measurements after 60 days.
7S 19S 19C
Femur:
Mass, mg 355.1¡22a 444.8¡10.3b 444.2¡9.4b Distance between epiphysis,
mm
31.5¡0.6 31.9¡0.3 31.9¡0.3
Width of the diaphysis, mm 3.2¡0.1a 3.25¡0.1a,b 3.51¡0.1b Lumbar vertebrae:
Mass, mg 613.8¡24.8a 689.7¡11b 681.9¡17.4b Maximum length, mm 37.7¡0.4a 39.9
¡0.3b 39.5 ¡0.4b
The post-weaning groups were fed a control diet (7S; n = 12) or a high-fat diet containing soybean (19S; n = 12) or canola oil (19C; n = 12) until they were 60 days old.
which is important for remodeling bone architecture10,42-44 and providing stimuli for osteogenesis.6Our results agree with previous literature that reported positive effects of fat mass on bone density. Furthermore, adipose tissue might influence bone density by promoting bone-active hormone secretion from the pancreas (e.g., insulin).11
The serum analyses revealed high concentrations of insulin and glucose and, consequently, high insulin resis-tance in rats fed a high-fat diet containing canola oil. These results are surprising because omega-6 has been associated with the development of type-2 diabetes mellitus.39
However, human and animal studies have revealed that excessive fat intake might induce metabolic disturbances independent of the diet lipid composition.45-50Thus, a
high-fat diet containing 19% canola oil seems to promote insulin resistance. The fatty acid composition and the size and number of adipocytes are likely stronger contributors to insulin resistance than fat mass. Our data regarding fat cell morphology are based on retroperitoneal samples; there-fore, further studies using mesenteric, epididymal and subcutaneous fat are required to elucidate the mechanisms that explain the association between canola oil intake and insulin sensitivity. Furthermore, increased bone density has been associated with hyperinsulinemia in non-diabetic models.51,52 Insulin is a potent regulator of bone growth, acting directly on osteoblasts by stimulating their prolifera-tion and, consequently, inducing bone formaprolifera-tion.11,53
Although this study has no data to confirm osteoblast activity, we hypothesized that the hyperinsulinemia observed in the 19C group may have had a positive effect on the bones, increasing their radiodensities.
Bone density increases more predominantly at the trabecular site (i.e., the vertebral body) than at the cortical site (i.e., the proximal epiphysis), and bone remodeling explains these regional differences.53 When we evaluated
each bone individually, we found that high canola oil intake promotes similar trends in the proximal epiphysis and in the lumbar vertebrae, increasing bone radiodensity. These analyses indicate that the use of computed tomography for bone analysis enables the differentiation between the 19S and 19C groups that is impossible using other bone measurements.
The results suggest that the amount and source of fat in the diet after weaning have differential effects on adiposity and bone. When the canola oil diet is normocaloric, a lower intra-abdominal adiposity and lower bone density result.21
Thus, regardless of the source (soybean or canola oil), a high-fat diet ameliorates bone quality and induces adipos-ity. However, canola oil also causes hyperinsulinemia in this model. Thus, public policies to adopt various oils in the diet
of the population must consider the deleterious effects of higher fat contents.
ACKNOWLEDGEMENTS
The authors thank Mr. C. Roberto for providing animal care. This research was supported by the State of Rio de Janeiro Carlos Chagas Filho Research Foundation (FAPERJ) and the Coordination for the Enhancement of Higher Education Personnel (CAPES).
REFERENCES
1. Fagot-Campagna A. Emergence of type 2 diabetes in children: the epidemiological evidence. J Ped Endoc Metab. 2000;13:1394-402. 2. James PT, Leach R, Kalamara E, Shayeghi M. The Worldwide Obesity
Epidemic. Obes Res. 2001;9:228-33, doi: 10.1038/oby.2001.123. 3. Eknoyan G. A history of obesity, or how what was good became ugly
and then bad. Adv Chronic Kidney Dis. 2006;13:421-7, doi: 10.1053/j. ackd.2006.07.002.
4. Cobayashi F, Lopes LA, Taddei JAA. Bone mineral density in overweight and obese adolescents. J Pediatr (Rio J). 2005;81:337-42.
5. Sirois I, Cheung AM, Ward WE. Biomechanical bone strength and bone mass in young male and female rats fed a fish oil diet. Prostaglandins Leukot Essent Fatty Acids. 2003;68:415-21, doi: 10.1016/S0952-3278(03)00066-8.
6. Hsu Y-H, Venners SA, Terwedow HA, Feng Y, Niu T, Li Z, et al. Relation of body composition, fat mass, and serum lipids to osteoporotic fractures and bone mineral density in Chinese men and women. Am J Clin Nutr. 2006;83:146-54.
7. Rhie YJ, Lee KH, Chung SC, Kim HS, Kim DH. Effects of body composition, leptin, and adiponectina on bone mineral density in prepubertal girls. J Korean Med Sci. 2010;25:1187-1190, doi: 10.3346/ jkms.2010.25.8.1187.
8. Reddy GA, Kulkarni B, Shatrugna V, Reddy PTR, Nagalla B, Kumar PA, et al. Bone mass of overweight affluent indian youth and its sex-specific association with body composition. Arch Osteoporos. 2009;4:31-39, doi: 10.1007/s11657-009-0024-x.
9. Uusi-Rasi K, Kannus P, Pasanen M, Sievanen H. Is childhood obesity associated with bone density and strength in adulthood? doi: 10.4061/ 2010/904806.
10. Gilsanz V, Chalfant J, Mo AO, Lee DC, Dorey FJ, Mittelman SD. Reciprocal relations of subcutaneous and visceral fat to bone structure and strength. J Clin Endocrinol Metab. 2009;94:3387-3393, doi: 10.1210/jc. 2008-2422.
11. Zillikens MC, Uitterlinden AG, van Leeuwen JPTM, Berends AL, Henneman P, van Dijk KW, et al. The role of body mass index, insulin, and adiponectina in the relation between fat distribution and bone mineral density. Calcif Tissue Int. 2010;86:116-125, doi: 10.1007/s00223-009-9319-6.
12. Taes YEC, Lapauw B, Vanbillemont G, Bogaert V, Bacquer DD, Zmierczak H, et al. Fat mass is negatively associated with cortical bone size in young healthy male siblings. J Clin Endocrinol Metab. 2009;94:2325-2331, doi: 10.1210/jc.2008-2501.
13. Afghani A & Goran MI. The interrelationships between abdominal adiposity, leptin and bone mineral content in overweight latino children. Horm Res. 2010;72:82-87, doi: 10.1159/000232160.
14. Chiellini C, Cochet O, Negroni L, Samson M, Poggi M, Ailhaud G, et al. Characterization of human mesenchymal stem cell secretome at early steps of adipocyte and osteoblasts differentiation. BMC Molecular Biology. 2008;9:26, doi: 10.1186/1471-2199-9-26.
15. Kruger MC, Coetzee M, Haag M, Weiler H. Long-chain polyunsaturated fatty acids: selected mechanisms of action on bone. Prog Lipid Res. doi: 10.1016/j.plipres.2010.06.002
16. Weiss LA, Barret-Connor E, von Muhlen D. Ratio of n-6 to n-3 fatty acids and bone mineral density in older adults: the rancho bernardo study. Am J Clin Nutr. 2005;81:934-8.
17. Ghibaudi L, Cook J, Farley C, van Heek M, Hwa JJ. Fat intake affects adiposity, comorbidity factors, and energy metabolism of Sprague-Dawley rats. Obes Res. 2002;10: 956-63, doi: 10.1038/oby.2002.130. 18. Jo J, Gavrilova O, Pack S, Jou W, Mullen S, Summer AE, et al.
Hipertrophy and/or hyperplasia: Dynamics of adipose tissue growth. PLoS Comput Biol. 2009;5:1-11, doi: 10.1371/journal.pcbi.1000324. 19. Harrold JA, Widdowson PS, Clapham JC, Williams G. Individual
severity of dietary obesity in unselected Wistar rats: relationship with hyperphagia. Am J Physiol Endocrinol Metab. 2000;279:340-7. 20. Weiler HA & Fitzpatrick-Wong SC. Modulation of essential (n-6):(n-3)
fatty acid ratios alters fatty acid status but not bone mass in piglets. J Nutr. 2002;132:2667-72.
21. Costa CA, Carlos AS, Gonzalez GD, Reis RP, Ribeiro MD, Dos Santos AD, et al. Diet containing low n-6/n-3 polyunsaturated fatty acids ratio, provided by canola oil, alters body composition and bone quality in young rats. Eur J Nutr. Doi: 10.1007/s00394-011-0206-3.
Table 4 -Computed tomography analyses of the femur and lumbar vertebrae (LV1-LV6) after 60 days.
7S 19S 19C
Proximal epiphysis, Hu
546.0¡37.5a 515.7¡34.7a 658.1¡24.5b
Diaphysis, Hu 492.6¡21.2a 562.2¡24.4b 579.4¡22.1b
LV1-LV6, Hu 389.9¡14.2a 459.0
¡7.1b 502.4 ¡4c
The post-weaning groups were fed a control diet (7S; n = 12) or a high-fat diet containing soybean (19S; n = 12) or canola oil (19C, n = 12) until they were 60 days old.
a,b,cThe values within a row with dissimilar superscripts are significantly
22. Levy-Costa RB, Sichieri R, Pontes NS, Monteiro CA. Household food availability in Brazil: Distribution and trends (1974-2003). Cad Saude Publica. 2005;39:530-40.
23. McDonald BE. Canola oil: Nutritional properties. Canada: Canola Council of Canada. 2005. Available from: http://www.canola-council.org/pdf/ nutritionalprop.pdf.
24. Marques RG, Morales MM, Petroianu A. Brazilian law for scientific use of animals. Acta Cir Bras. 2009;24:69-74, doi: 10.1590/S0102-865020090001 00015.
25. Fishbeck KL & Rasmussen KM. Effect of repeated cycles on maternal nutritional status, lactational performance and litter growth in ad libitum-fed and chronically food-restricted rat. J Nutr. 1987;117:1967-75. 26. Reeves PG. Components of the AIN-93 diets as improvements in the
AIN-76A diet. J Nutr. 1997;127:838-41.
27. Reeves PG, Nielsen FH, Fahey GC. AIN-93 purified diets for laboratory rodents: final report of the American institute of nutrition ad hoc writing committee on the reformulation of the AIN-76 rodent diet. J Nutr. 1993;123:1939-51.
28. Duffy PH, Lewis SM, Mayhugh MA, McCraken A, Thorn BT, Reeves PG, et al. Effect of the AIN-93M purified diet and dietary restriction on survival in Sprague-dawley rats: implications for chronic studies. J Nutr. 2002;132:101-7.
29. Abe S, Watanabe H, Hirayama A, Shibuya E, Hashimoto M, Ide Y. Morphological study of the femur in osteopetrotic (op/op) mice using microcomputed tomography. Br J Radiol. 2000;73:1078-82.
30. Alippi RM, Meta MD, Olivera MI, Bozzini C, Schneider P, Meta IF, et al. Effect of protein-energy malnutrition in early life on the dimensions and bone quality of the adult rat mandible. Arch Oral Biol. 2002;47:47-53, doi: 10.1016/S0003-9969(01)00089-9.
31. Cao JJ, Gregoire BR, Gao H. High-fat diet decreases cancellous bone mass but has no effect on cortical bone mass in the tibia in mice. Bone. 2009;44: 1097-104, doi: 10.1016/j.bone.2009.02.017.
32. Prentice AM, Doppitt SD. Importance of energy density and macro-nutrients in the regulation of energy intake. Int J Obes. 1996;20:S18-S23. 33. Costa CAS, Alves EG, Gonzales GPL, Barbosa TBC, Carlos AS, Lima VD, et al. Evaluation of body development, fat mass and lipid profile in rats fed with high-PUFA and MUFA diets, after neonatal malnutrition. Br J Nutr. 2009;101:1639-44, doi: 10.1017/S0007114508123406.
34. Li J, Yu X, Pan W, Unger RH. Gene expression profile of rat adipose tissue at the onset of high-fat-diet obesity. Am J Physiol Endocrinol Metab. 2002;282:1334-41.
35. Kim YJ, Park T. Genes are differentially expressed in the epididymal fat of rats rendered obese by a high-fat diet. Nutrition Research. 2008;28:414-22, doi: 10.1016/j.nutres.2008.03.015.
36. Shillabeer G, Lau DCW. Regulation of new fat cell formation in rats: the role of dietary fats. J Lipid Res. 1994;35:592-600.
37. Dullo AG, Mensi N, Seydoux J, Girardier L. Differential effects of high-fat diets varying in high-fatty acid composition on the efficiency of lean and fat tissue deposition during weight recovery after low food intake. Metabolism. 1995;44:273-9, doi: 10.1016/0026-0495(95)90277-5. 38. Costa CAS, Alves EG, Gonzalez GPL, Barbosa TBC, Lima VD,
Nascimento R, et al. Computed tomography in the evaluation of abdominal fat distribution associated with a hyperlipidic diet in
previously undernourished rats. Radiol Bras. 2007;40:337-40, doi: 10. 1590/S0100-39842007000500011.
39. Heredia FP, Larque E, Portillo MPP, Canteras M, Zamora S, Garaulet M. Age-related changes in fatty acids from different adipose depots in rat and their association with adiposity and insulin. Nutrition. 2008;24:1013-22, doi: 10.1016/j.nut.2008.03.022.
40. Yin KB, Najimudin N, Muhammad TST. The PPARccoding region and
its role in visceral obesity. Biochem Biophys Res Comm. 2008;371:177-9, doi: 10.1016/j.bbrc.2008.04.013.
41. Raclot T & Groscolas R. Individual fish-oil n-3 polyunsaturated fatty acid deposition and mobilization rates for adipose tissue of rats in a nutritional steady state. Am J Clin Nutr. 1994;60:72-8.
42. Iwaniec UT, Dube MG, Boghossian S, Song H, Helferich WG, Turner RT, et al. Body mass influences cortical bone mass independent of leptin signaling. Bone. 2009;44:404-12, doi: 10.1016/j.bone.2008.10.058. 43. Ho-Pham LT, Nguyen ND, Lai TQ, Nguyen TV. Contributions of lean
mass and fat mass to bone mineral density: a study in postmenopausal women. BMC Musculoskeletal Disorders. 2010;11:59, doi: 10.1186/1471-2474-11-59.
44. Paula FJA, Rosen CJ. Obesity, diabetes mellitus and last but not least, osteoporosis. Arq Bras Endocrinol Metab. 2010;54:150-7, doi: 10.1590/ S0004-27302010000200010.
45. Baker PW, Gibbons GF. Effect of dietary fish oil on the sensitivity of hepatic lipid metabolism to regulation by insulin. J Lipid Res. 2000;41:719-26.
46. Adam Sk, Das S, Othman F, Jaarin K. Fresh soy oil protects against vascular changes in an estrogen-deficient rat model: an electron microscopy study. CLINICS. 2009;64:1113-9, doi: 10.1590/S1807-59322009001100012.
47. Gravena C, Mathias PC, Ashcroft SJH. Acute effects of fatty acids on insulin secretion from rat and human islets of langerhans. J Endocrinol. 2002;173:73-80, doi: 10.1677/joe.0.1730073.
48. Wiernsperger N, Geloen A, Rapin JR. Fructose and cardiometabolic disorders: the controversy will, and must, continue. CLINICS. 2010;65:729-38, doi: 10.1590/S1807-59322010000700013.
49. Lovejoy JC, Smith SR, Champagne CM, Most MM, Lefevre M, DeLany JP, et al. Effects of diets enriched in saturated (palmitic), monounsatu-rated (oleic), or trans (elaidic) fatty acids on insulin sensitivity and substrate oxidation in healthy adults. Diabetes Care. 2002;25:1283-8, doi: 10.2337/diacare.25.8.1283.
50. Winzell MS, Pacini G, Ahre´n B. Insulin secretion after dietary supplementation with conjugated linoleic acids and n-3 polyunsaturated fatty acids in normal and insulin-resistant mice. Am J Physiol Endocrinol Metab. 2006;290:347-54, doi: 10.1152/ajpendo.00163.2005.
51. Barrett-Connor E, Holbrook TL. Sex differences in osteoporosis in older adults with non-insulin-dependent diabetes mellitus. JAMA. 1992;268:3333-7, doi: 10.1001/jama.268.23.3333.
52. Abrahamsen B, Rohold A, Henriksen JE, Beck-Nielsen H. Correlations between insulin sensitivity and bone mineral density in non-diabetic men. Diabet Med. 2000;17:124-9, doi: 10.1046/j.1464-5491.2000.00234.x. 53. Reid R. Relationships between fat and bone. Osteoporos Int.