Alcohol consumption and gastric
cancer in Mexico
Consumo de bebidas alcoólicas
e câncer gástrico no México
1 Instituto Nacional de Salud Pública. Av. Universidad 655, Col. Sta. Ma. Ahuacatitlán Cuernavaca, Morelos, C.P. 62508, México.
Lizbeth López-Carrillo 1 Malaquías López-Cervantes 1 Armando Ramírez-Espitia 1 Celina Rueda 1
Cielo Fernández-Ortega 1 Sergio Orozco-Rivadeneyra 1
Abstract This paper presents an assessment of alcohol consumption, including the popular Mexican liquor tequila, in relation to the incidence of gastric cancer. We conducted a popula-tion-based case-control study in Mexico City, with 220 gastric cancer cases and 752 population-based controls. A food frequency questionnaire was used to measure consumption of alcohol and other dietary items. Grams of ethanol were estimated by the Food Intake Analysis System 3.0 soft-ware. After adjustment for known risk factors, wine consumption was positively associated with the risk of developing gastric cancer (OR = 2.93; CI 95% 1.27-6.75) in the highest category of wine consumption, corresponding to at least 10 glasses of wine per month, with a significant trend (p = 0.005). This association remained among intestinal (OR = 2.16; CI 95% 0.68-6.92, p-value for trend = 0.031) and diffuse (OR = 4.48; CI 95% 1.44-13.94, p-value for trend = 0.018) gastric cancer cases. A borderline significant trend between GC risk and total ethanol intake was ob-served (p = 0.068). Consumption of beer and distilled alcoholic beverages including brandy, rum, and tequila was not associated with GC risk. The results indicate the need to focus on the study of the potential effects of different types of wine, with emphasis on components other than ethanol regarding the incidence of gastric cancer, even among populations with moderate to low levels of alcohol consumption.
Key words Alcohol Drinking; Stomach Neoplasms; Case-Control Studies; Epidemiology
Resumo Para determinar o papel do consumo de bebidas alcoólicas, incluindo tequila, sobre incidência de câncer gástrico (CG), foi realizado um estudo caso-controle de base populacional na Cidade do México, com 220 casos de CG e 752 controles. Um questionário de freqüência ali-mentar foi empregado para medir o consumo de bebidas alcoólicas e outros itens da dieta. O consumo de etanol (gr) foi estimado usando-se o software Food Intake Analysis System 3.0.Após ajustamento por fatores de risco conhecidos, consumo de vinho esteve associado positivamente com o risco de desenvolver CG no estrato de maior consumo, ao menos dez copos de vinho men-sais (OR = 2,93; I.C. 95% 1,27-6,75), p<0,05. Essa associação persistiu tanto para os tumores de tipo intestinal (OR = 2,16; I.C. 95% 0,68-6,92, p de tendência 0,031), quanto para os de tipo difu-so (OR = 4,48; I.C. 95% 1,44-13,94, p de tendência 0,018). O consumo de cerveja e bebidas desti-ladas (conhaque, rum, tequila) não esteve associado com maior risco de CG.
Introduction
Heavy consumption of red wine (Hoey et al., 1981; Falcão et al., 1994) and the habit of drinking vodka ( Jedrychowski et al., 1986; Jedrychowski et al., 1993) have been shown to increase the risk for developing gastric cancer (GC) in case-control studies from France (Hoey et al., 1981), Portugal (Falcão et al., 1994), and Poland (Jedrychowski et al., 1986; Jedrychows-ki et al., 1993), respectively. In the United States, total ethanol consumption was associated with an increased risk of cancer in the gastric body, cardia, and fundus (Wu-Williams et al., 1990). In contrast, some prospective and other-case control studies performed in Europe and Asia did not find an association between total alco-hol consumption and GC (Kono & Hirohata, 1996).
Some studies focused on potential differ-ences regarding the anatomic site of GC, while the histological type of the tumor has scarcely been evaluated in relation to alcohol intake. Furthermore, no information has been pub-lished for Latin American countries, where GC is one of most frequent malignant neoplasms (WHO, 1970).
This paper presents the results of an assess-ment of alcohol consumption, including the popular liquor tequila (a Mexican spirit dis-tilled from the juice of a specific cactus), in re-lation to GC incidence and its histological types, using data from a population-based case-control study conducted in Mexico City.
Methods
Detailed information about the study has been published elsewhere (López-Carrillo et al., 1994). In short, our study population comprised 220 newly diagnosed and histologically con-firmed cases of adenocarcinoma of the stom-ach from fifteen large hospitals and 752 popu-lation-based controls from the Greater Mexico City Metropolitan Area. The cases represented some 80 percent of the stomach cancer cases reported to the Mexican National Cancer Reg-istry by hospitals in Greater Mexico City during the study period.
Sociodemographic characteristics and fre-quency and amount of consumption of 79 food items, including 5 alcoholic beverages, were recorded through structured personal inter-views. Direct interviews were performed in 78% of the cases; the remaining cases were se-riously ill, and the interview had to be done with the spouse, a daughter, or a son. To
bal-ance this situation, 7% of the controls were randomly selected for indirect interviews with equivalent surrogate responders. Cases were asked about their alcohol and food consump-tion over a 12-month period before the onset of symptoms, while controls were asked about the same habits in the 12-month period pre-ceding the interview. It is our assumption that alcohol and dietary habits during these periods reflected longer-term adult dietary habits.
Alcohol consumption and smoking
A semi-quantitative food frequency question-naire was used to evaluate the consumption of beer, wine, brandy, rum, and tequila. The ethanol content was estimated in grams, using the Food Intake Analysis System 3.0 software. To estimate ethanol intake, the following equiv-alencies were used: one drink (1 oz or 30 ml) of tequila = 14.03 g of ethanol; one drink (200 ml can/bottle) of beer = 12.96 g; one drink (60 ml) of wine = 9.58 g; and one drink of rum or brandy (30 ml) = 14.03 g of ethanol.
Smoking was measured as a score of lifetime exposure, multiplying the current and/or past average daily number of cigarettes smoked times years’ duration of the habit (cigarettes/ day x years of smoking).
Other risk factors for gastric cancer
Intake of foods potentially related to GC was measured as follows: for chili pepper, all sub-jects were asked to rate their own level of con-sumption as none, low, medium, or high. Infor-mation on frequency of consumption of 17 fruits was grouped as one single variable repre-senting daily consumption. The same proce-dure was used for 13 vegetables and 4 processed meats. Salt intake was measured as a dichoto-mous variable, whether or not the subject ha-bitually added salt to meals before tasting them. Socioeconomic status was determined as a function of having sewage disposal and/or running supply in the household.
Statistical analysis
The effects of known and potential risk factors for GC according to three categories of alcohol intake were assessed in our sample by means of t-tests and/or χ2statistics. Potential
(i.e., grams of alcohol intake times the particu-lar variable) in the logistic regression models for GC.
Adjusted odds ratios for the effects of total ethanol and individual intake of beer, wine, and distilled alcoholic drinks on GC risk were obtained by fitting unconditional multivariate logistic models to the data. These models were estimated for adenocarcinomas of the stomach and each histological type of GC (i.e. intestinal and diffuse) including known and potential risk factors for gastric cancer (age, sex, total calories, consumption of chili pepper, fruits, vegetables, salt, and processed meats, plus cig-arette smoking, socioeconomic status, and his-tory of peptic ulcer).
The existence of linear trends for particular types of alcoholic drinks and total ethanol (in grams) in relation to GC risk was assessed tak-ing each categorical alcoholic beverage at a time as a continuous variable in the multivari-ate logistic regression models.
All analyses were performed using the soft-ware STATA 5.0 (Stata Corporation, College Sta-tion, Texas).
Results
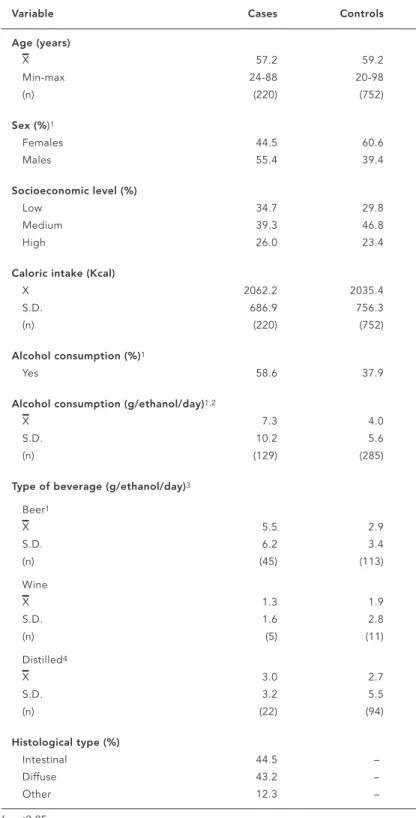
Table 1 shows the selected characteristics of the study population. As expected by design (age frequency matching), mean ages for cases and controls were almost identical, around 58 years. There was a significant excess of women in the control group (60.6% vs. 44.5%).
Average calorie intake was similar in the study population. In contrast, there was a sig-nificantly higher proportion of alcohol con-sumers among cases as compared to controls, with a significantly higher daily consumption of total ethanol (7.3 g among cases vs. 4.0 g among controls) and ethanol from beer (5.5 g among cases vs. 2.9 g among controls). Ethanol consumption from wine and distilled alcoholic beverages was not statistically different among cases and controls.
According to histological type, there were similar proportions of intestinal and diffuse tu-mors among the cases.
Table 2 shows the age-, sex-, and calorie-adjusted odds ratios for the effects of known and suspected GC factors, according to three categories of alcohol consumption. Among al-cohol abstainers, we found a protective effect of vegetable and fruit consumption, which was independent of alcohol consumption (i.e. this protective effect was evident for both teeto-talers and alcohol consumers). No interaction
Table 1
Selected characteristics of the study population.
Variable Cases Controls
Age (years)
X 57.2 59.2
Min-max 24-88 20-98
(n) (220) (752)
Sex (%)1
Females 44.5 60.6
Males 55.4 39.4
Socioeconomic level (%)
Low 34.7 29.8
Medium 39.3 46.8
High 26.0 23.4
Caloric intake (Kcal)
X 2062.2 2035.4
S.D. 686.9 756.3
(n) (220) (752)
Alcohol consumption (%)1
Yes 58.6 37.9
Alcohol consumption (g/ethanol/day)1,2
X 7.3 4.0
S.D. 10.2 5.6
(n) (129) (285)
Type of beverage (g/ethanol/day)3
Beer1
X 5.5 2.9
S.D. 6.2 3.4
(n) (45) (113)
Wine
X 1.3 1.9
S.D. 1.6 2.8
(n) (5) (11)
Distilled4
X 3.0 2.7
S.D. 3.2 5.5
(n) (22) (94)
Histological type (%)
Intestinal 44.5 –
Diffuse 43.2 –
Other 12.3 –
1 p<0.05
2 No alcohol consumers were excluded
3 Only the preferred alcoholic drink was considered; 124 subjects that did not have a preferred drink were excluded.
was found between alcohol consumption and vegetable or fruit consumption.
Likewise, an increased risk due to consump-tion of salt, processed meats, and chili pepper was detected among non-alcohol drinkers. In the presence of alcohol consumption, the effect of salt and chili pepper on GC risk was smaller, while the effect of processed meat intake re-mained similar to that observed for teetotalers. None of these three factors (salt, processed meats, and, chili pepper) showed a significant interaction with alcohol consumption in rela-tion to GC risk.
Smoking increased GC risk among both teetotalers and those who consumed less than
5g of alcohol per day, while the opposite effect was observed among individuals who con-sumed more than 5g of alcohol per day. The in-teraction term for smoking and alcohol intake did not reach statistical significance.
Multivariate models for the effect of ethanol and the preferred alcoholic beverages con-sumption on GC risk are shown in Table 3. To-tal ethanol consumption increased the risk of developing GC up to 1.93 times for those who consumed ≥5 g (95% CI 1.00-3.71) every
day, with a borderline significant test for trend (p = 0.068). Neither beer nor distilled bever-ages had a significant effect on GC. In contrast, wine consumption produced a significantly
in-Table 2
Age- and sex- adjusted odds ratios and 95% confidence intervals for the effect of known and suspected risk factors for gastric cancer by alcohol consumption.
Risk factor Alcohol consumption/day p-value for
None <5g =5g interaction
OR C.I.95% OR C.I.95% OR C.I.95%
Vegetables1
0.56-3.27 1.0 – 1.0 – 1.0 – 0.949
3.28-4.24 0.77 0.43, 1.39 0.54 0.28, 1.06 0.67 0.19, 2.36 4.25-5.60 0.60 0.31, 1.14 0.33 0.16, 0.68 0.49 0.16, 1.57 5.61-25.75 0.55 0.29, 1.06 0.43 0.21, 0.90 0.23 0.07, 0.75
Fruits1
0.07-1.62 1.0 – 1.0 – 1.0 – 0.353
1.63-2.86 0.75 0.41, 1.39 1.13 0.55, 2.36 0.44 0.13, 1.49 2.87-4.45 0.71 0.38, 1.32 0.96 0.46, 2.01 0.45 0.14, 1.37 4.46-19.15 0.51 0.26, 0.97 0.77 0.34, 1.75 0.32 0.11, 0.97
Salt2
No 1.0 – 1.0 – 1.0 – –
Yes 3.09 1.92, 4.97 1.87 1.11, 3.16 1.2 0.53, 2.73
Processed meats1
0.0-0.13 1.0 – 1.0 – 1.0 – 0.753
0.14-0.27 0.64 0.31, 1.36 1.29 0.50, 3.31 2.45 0.64, 9.30 0.28-0.63 1.79 0.94, 3.27 2.34 1.02, 5.33 1.43 0.42, 4.88 0.64-6.00 1.45 0.77, 2.75 1.73 0.73, 4.10 1.98 0.56, 6.84
Chili pepper
No 1.0 – 1.0 – I.O.3 –
Yes 4.5 1.92, 10.71 2.9 0.84, 9.96
Cigarette smoking4
None 1.0 – 1.0 – 1.0 – 0.080
Moderate 1.16 0.62, 2.16 1.04 0.52, 2.10 0.62 0.21, 1.84
High 1.64 0.93, 2.90 1.99 1.03, 3.85 0.72 0.27, 1.92
1 Portions/day.
2 Adding salt to the meals before tasting them.
creased risk of GC (OR ≥1 drink of wine per day vs. non-wine consumers = 2.93 95% CI 1.27-6.75) independently of known factors for this malignant tumor and other alcoholic bever-ages (beer and distilled).
The increased risk of GC due to wine con-sumption held for both histological types (in-testinal: OR = 2.16, CI 95% 0.68-6.92, p-value for trend = 0.031; and diffuse: OR = 4.48, CI 95% 1.44-13.94, p-value for trend = 0.018). No sig-nificant increase in GC risk was observed for total ethanol or any other alcoholic beverage consumption among GC cases by histological type (Table 4).
Discussion
The results of this study show that wine con-sumption is positively associated with the risk of developing gastric cancer (OR = 2.93; CI 95% 1.27-6.75), and this association remained among intestinal (OR = 2.16; CI 95% 0.68-6.92, p-value for trend = 0.031) and diffuse (OR = 4.48; CI 95% 1.44-13.94, p-value for trend = 0.018) gastric cancer cases. This effect was
in-dependent of other known risk factors for this neoplasm with a statistically significant mo-notonic trend, suggesting that risk increases along with wine consumption. Consumption of beer and distilled alcoholic beverages in-cluding brandy, rum, and tequila was not asso-ciated with GC risk and, and a borderline signif-icant trend between GC risk and total ethanol intake was observed.
Our results are in line with the findings of two published studies from France (Hoey et al., 1981) and Portugal (Falcão et al., 1994). In the former country an odds ratio of 6.9 (CI 95% 3.3-14.3), was estimated for the effect of 568 grams of alcohol (i.e., ethanol) consumption or more per week on the GC risk, with an apparent dose response relationship; the authors mention that alcohol consumption in their study popu-lation was mainly wine intake. Likewise, the study from Portugal reported an odds ratio of 2.61 (CI 95% 1.01-6.78) for subjects with a weekly intake of more than 559g of red wine and a significant trend in regard to increasing amounts of red wine intake.
Two studies from Poland also found a posi-tive association between alcohol consumption,
Table 3
Effect of consumption of ethanol and preferred alcohol beverage on gastric cancer risk.
Total ethanol and Cases Controls OR C.I. 95% p-value trend
preferred beverage
Ethanol (g/day)1
Abstainers 91 467 1.0 – 0.068
<1.5 23 72 1.01 0.52, 1.96
1.5-4.9 59 154 1.27 0.76, 2.11
=5.0 47 59 1.93 1.00, 3.71
Beer2
Non-beer consumers 105 512 1.0 – 0.115
<1 drink 60 140 1.06 0.64, 1.73
=1 drink 54 98 1.04 0.55, 1.94
Wine3
Non-wine consumers 133 612 1.0 – 0.005
<1 drink 54 104 2.08 1.26, 3.44
=1 drink 32 33 2.93 1.27, 6.75
Distilled4
Non-distilled consumers 114 546 1.0 – 0.175
<1 drink 17 78 0.78 0.38, 1.61
=1 drink 89 128 1.83 1.07, 3.10
1 Model 1, adjusted by: age (20-24, 25... 85 y +), sex, total calorie intake, chili pepper, history of peptic ulcer, socioeconomic status, cigarette smoking, fruit, vegetables, salt, processed meats.
specifically that vodka, with GC (Jedrychowski et al., 1986; Jedrychowski et al., 1993). The au-thors reported a three-fold increase in GC risk for those drinking vodka at least once a weak ( Jedrychowski et al., 1993), as well as for sub-jects drinking alcohol on an empty stomach, that is, before breakfast.
Some methodological features must be tak-en into account whtak-en interpreting the results of our study. The assessment of ethanol and each specific alcoholic beverage in regard to histo-logical type of tumor was limited by the sample size. Hence, the lack of a statistically significant trend among intestinal and diffuse gastric can-cer cases in relation to their consumption of to-tal ethanol, wine, and distilled beverages might be the result of an insufficient number of cases. Differential recall from cases and controls cannot be entirely ruled out, because the pos-sibility does exist that the cases could have an-swered in a different fashion than controls, perhaps attributing their illness to alcohol con-sumption. It also possible that there was some degree of underreporting of alcohol consump-tion on the side of the controls, but the latter
situation is unlikely given that both interview-ers and interviewees unaware of the hypothe-sis being tested.
We can not entirely rule out differential re-porting; nonetheless, had this problem been present (specifically among the cases) we should have obtained similar patterns for red wine consumption and other beverages such as brandy or tequila, which are much more commonly consumed in Mexico. Moreover, when consumption of other dietary items like vegetables, processed meats, and salt was be-ing assessed, the patterns of results were al-ways in the expected direction; hence, it seems unlikely that either cases or controls could have influenced the results, for a particular fac-tor, in a specific direction.
The method of control selection favored the recruitment of women and persons who tended to stay at home. Selection bias would have occurred if alcohol consumption were as-sociated with gender and/or the fact of staying at home. However, the models were adjusted by sex, and inclusion of occupation (house-wife, retired, and unemployed vs. all other
oc-Table 4
Effect of ethanol and alcohol beverage consumption on intestinal and diffuse gastric cancer risk.
Beverages/day Intestinal Diffuse
Cases Controls OR C.I. 95% p-value Cases Controls OR C.I. 95% p-value
trend trend
Ethanol (g/day)1
Abstainers 36 467 1.0 – 0.283 49 467 1.0 – 0.407
<1.5 9 72 1.09 0.45, 2.64 10 72 0.74 0.28, 1.94
1.5-4.9 29 154 1.18 0.58, 2.41 16 154 0.82 0.39, 1.75
=5.0 4 59 1.73 0.71, 4.18 20 59 2.06 0.84, 5.04
Beer2
Non-beer consumers 45 512 1.0 – 0.887 51 512 1.0 – 0.929
<1 drink 25 140 0.73 0.35, 1.50 24 140 1.09 0.55, 2.17
=1 drink 27 98 1.03 0.45, 2.38 20 98 0.91 0.37, 2.24
Wine3
No wine consumers 56 612 1.0 – 0.031 65 612 1.0 – 0.018
<1 drink 28 104 2.11 1.1, 4.07 15 104 1.40 0.64, 3.07
=1 drink 14 33 2.16 0.68, 6.92 14 33 4.48 1.44, 13.94
Distilled4
Non-distilled consumers 43 546 1.0 – 0.153 61 546 1.0 – 0.850
<1 drink 10 78 1.08 0.42, 2.78 5 78 0.42 0.13, 1.36
=1 drink 45 128 1.70 0.84, 3.46 29 128 1.00 0.46, 2.20
1 Model 1, adjusted by: age (20-24, 25... 85 y +), sex, total calorie intake, chili pepper, history of peptic ulcer, socioeconomic status, cigarette smoking, fruit, vegetables, salt, processed meats.
Acknowledgments
The authors wish to acknowledge Ms. Reina Collado for typing the manuscript and the participation of the following hospitals: from the Ministry of Health, In-stituto Nacional de Cancerologia, InIn-stituto Gea-Gon-zalez, Hospital General de Mexico, and Instituto Na-cional de la Nutrición; from the Social Security Sys-tem, the hospitals PEMEX-Picacho, Adolfo Lopez Ma-teos, 20 de Noviembre, Ignacio Zaragoza, Especiali-dades del Centro Médico La Raza, EspecialiEspeciali-dades y Oncología del Centro Médico Nacional; and finally, private hospitals Angeles del Pedregal, Clínica Lon-dres, Español, and Metropolitano.
This study was supported by grants from the Mexican Secretariat of Health, the American Institute for Cancer Research, and Glaxo Laboratories.
cupations) in the multivariate models did not change the results.
On the other hand, the control group was accrued by visiting households selected from a sampling frame specifically devised for the Na-tional Health Survey of 1987; the latter means that our control group was a random sample of the subjects living in Mexico City at the time of the study. Therefore, overall prevalence of alco-hol consumption among controls (37.9%) was similar to that reported a year later by the Na-tional Addictions Survey (31.2%)(DGE, 1990) and lower than the prevalence expected for subjects attending the health services. Use of a population-based control group helps explain why even at a low level of wine consumption we were able to detect an association, in trast to the much higher levels of wine con-sumption observed for both cases and controls in the European studies. Another important difference with those studies was that our ref-erent category comprised only total abstainers, while they combined the latter subjects report-ing a low level of wine consumption.
Currently, there are at least two plausible mechanisms regarding the carcinogenic poten-tial of alcohol. One is that ethanol induces
di-rect damage to the cell membrane; therefore, epithelia that come into contact with alcohol more frequently should be more likely to dis-play such an effect. This hypothesis has been cited as an explanation for the associations between alcohol consumption and cancer of the mouth, oropharynx, larynx, and stomach (Rothman, 1995).
The second causal pathway implies that, besides ethanol, alcoholic beverages contain other compounds which in turn are responsible for the carcinogenic effect. Such is the case for nitrosamine precursors found in apple brandy and cider (Walker et al., 1979). It is worth men-tioning that the content of non-ethanol com-pounds varies among the different types of al-coholic beverages as well as among countries, and these facts could partly explain the differ-ences observed in the studies published so far. On the other hand, a limitation of our study was the inability to distinguish among differ-ent kinds of wine.
References
DGE (DIRECCION GENERAL DE EPIDEMIOLOGIA) 1990. Encuesta Nacional de Adicciones. Ciudad de México: Sistema Nacional de Encuestas de Salud, Secretaría de Salud.
FALCÃO, J. M.; DIAS, J. A.; MIRANDA, A. C.; LEITÃO, C. N.; LACERDA, M. M. & CAYOLLA-DA-MOTTA, L., 1994. Red wine consumption and gastric can-cer in Portugal: a case-control study. European Journal of Cancer Prevention, 3:269-276.
HOEY, J.; MONTVERNAY, C. & LAMBERT, R., 1981. Wine and tobacco: risk factors for gastric cancer in France. American Journal of Epidemiology, 113:668-674.
JEDRYCHOWSKI, W.; WAHRENDORF, J.; POPIELA, T. & RACHTAN, J., 1986. A case-control study of di-etary factors and stomach cancer risk in Poland.
International Journal of Cancer, 37:837-842. JEDRYCHOWSKI, W.; BOEING, H.; WAHRENDORF, J.;
POPIELA, T.; TOBIASZ-ADAMCZYK & KULIG, J., 1993. Vodka consumption, tobacco smoking and risk of gastric cancer in Poland. International Journal of Epidemiology, 22:606-613
KONO, S. & HIROHATA, T., 1996. Nutrition and stom-ach cancer. Cancer Causes and Control,7:41-55. LOPEZ-CARRILLO, L.; HERNANDEZ-AVILA, M. &
DUBROW, R., 1994. Chili pepper consumption and gastric cancer in Mexico: a case-control study.
American Journal of Epidemiology, 139:263-271. ROTHMAN, K. J., 1995. Research and prevention
pri-orities for alcohol carcinogenesis. Environmental Health Perspectives, 103:161-163.
WALKER, E.; CASTEGNARO, M.; GARREN, L.; TOUS-SAIN, G. & KOWALSKI, B., 1979. Intake of volatile nitrosamines from consumption of alcohols. Jour-nal of the NatioJour-nal Cancer Institute, 63:947-951. WHO (WORLD HEALTH ORGANIZATION), 1970.
World Health Statistics Annual. Geneva: WHO. WU-WILLIAMS, A. H.; YU, M. C. & MACK, T. M., 1990.