PHENOLOGICAL, PLANT ARCHITECTURE, AND GRAIN YIELD TRAITS ON
COMMON BEAN LINES SELECTION
1NERINÉIA DALFOLLO RIBEIRO2*, GUILHERME GODOY DOS SANTOS2, SANDRA MARIA MAZIERO3,
SKARLET DE MARCO STECKLING2
ABSTRACT - The development of common bean cultivars with early cycle, upright plant architecture, and high grain yield represents marketing advantages to bean farmers. This study aimed to evaluate whether common bean inbred lines differ for phenological, plant architecture, and grain yield traits; analyze the correlations between these traits; and select early and upright common bean lines with high grain yield. To this end, 14 common bean inbred lines were evaluated in two growing seasons in Santa Maria – RS, Brazil. Common bean inbred lines showed significant differences for all traits, except for insertion of the first pod and length of the fourth and fifth internodes. The four superior common bean lines selected by the multiplicative index were CNFP 10794, CNFC 10762, DF 06-09, and BRS Valente. CNFP 10794 presents earliness (flowering and cycle), upright plant architecture (lower values of general adaptation score, lodging, and stay-green phenotype) and high grain yield (higher values of number of pods per plant, number of grains per plant, mass of 100 grains, and grain yield). Mass of 100 grains showed a positive correlation with grain yield (r= 0.68). The indirect selection using mass of 100 grains is of intermediate efficiency to increase grain yield in common bean. CNFP 10794 presents earliness, upright plant architecture, and high grain yield and will be selected for the breeding program.
Keywords: Phaseolus vulgaris L.. Combined selection. Indirect selection. Pearson’s correlation.
CARACTERES FENOLÓGICOS, DA ARQUITETURA DE PLANTA E DA PRODUTIVIDADE NA SELEÇÃO DE LINHAGENS DE FEIJÃO
RESUMO - O desenvolvimento de cultivares de feijão de ciclo precoce, de arquitetura ereta e de alta produtividade de grãos representa vantagens mercadológicas para os produtores. Os objetivos deste trabalho foram avaliar se as linhagens de feijão diferem quanto aos caracteres fenológicos, da arquitetura de planta e da produção, estudar as correlações entre esses caracteres e selecionar linhagens precoces, de arquitetura ereta e com alta produtividade de grãos. Para tanto, 14 linhagens de feijão foram avaliadas em duas épocas de cultivo em Santa Maria – RS, Brasil. Diferenças significativas entre as linhagens de feijão foram observadas para todos os caracteres avaliados, exceto para a altura de inserção da primeira vagem, o comprimento do quarto e do quinto entrenó. As quatro melhores linhagens selecionadas pelo índice multiplicativo foram CNFP 10794, CNFC 10762, DF 06-09 e BRS Valente. A linhagem CNFP 10794 apresenta precocidade (floração e ciclo), arquitetura de planta ereta (menores escores de nota geral de adaptação, acamamento e fenótipo stay green) e alta produtividade de grãos (maiores valores de número de vagens por planta, número de grãos por planta, massa de 100 grãos e produtividade de grãos). A massa de 100 grãos apresentou correlação positiva com a produtividade de grãos (r= 0,68). A seleção indireta pela maior massa de 100 grãos é de moderada eficiência para aumentar a produtividade de grãos em feijão. A linhagem CNFP 10794 apresenta precocidade, arquitetura de planta ereta e maior produtividade de grãos e será selecionada pelo programa de melhoramento.
Palavras-chave: Phaseolus vulgaris L.. Seleção combinada. Seleção indireta. Correlação de Pearson.
____________________ *Corresponding author
1Received for publication in 11/30/2016; accepted in 10/13/2017. Paper extracted from the master dissertation of the second author.
2Department of Plant Science, Universidade Federal de Santa Maria, Santa Maria, RS, Brazil; [email protected] – ORCID: 0000-0002
-5539-0160, [email protected] – ORCID: 0000-0001-9224-4499, [email protected] – ORCID: 0000-0003-3999 -2089.
3Associação Sulina de Crédito e Assistência Rural, Boa Vista do Cadeado, RS, Brazil; [email protected] – ORCID: 0000-0003
Rev. Caatinga
INTRODUCTION
Common bean (Phaseolus vulgaris L.) is the primary source of protein in human diets in several East African and Latin American countries, accounting for 65% of total protein intake and 32% of energy provision (BROUGHTON et al., 2003; BLAIR et al., 2010). In this scenario, increasing grain yield of common bean cultivars is crucial to ensure greater availability of this food and incorporate higher nutritional value to diets predominantly based on vegetable protein.
In Brazil, common bean breeding programs have obtained annual genetic gains from 0.72% to 1.10% for grain yield (RIBEIRO et al., 2008; FARIA et al., 2013; FARIA et al., 2014). The increase in grain yield of common bean is coupled with changes in phenological, plant architecture, and grain yield traits. New common bean cultivars present earliness for flowering and cycle (RIBEIRO et al., 2008), are more lodging-resistant, have an upright plant architecture (FARIA et al., 2013; FARIA et al., 2014), and show higher mass of 100 grains (RIBEIRO et al., 2008; FARIA et al., 2014).
The use of early common bean cultivars is important for a better planning of sowing and harvest times, besides facilitating crop rotations and management practices of the area (BURATTO et al., 2007). Earliness in common bean has been characterized by early flowering and early cycle (COIMBRA et al., 2006; RIBEIRO et al., 2008; PÉREZ-VEGA et al., 2010; MOURA et al., 2013). Conversely, plant architecture in this species has been assessed by means of several traits, such as stay-green phenotype (AGUIAR; RAMALHO; MARQUES JÚNIOR, 2000; CARMO et al., 2007); general adaptation score (RIBEIRO et al., 2010); plant height (MOURA et al., 2013; SILVA et al., 2013); insertion of the first pod (COELHO et al., 2007; MOURA et al., 2013; SILVA et al., 2013); and branch thickness, insertion angle of branches, number of branches, number of internodes, internodes distance, and architecture score (MOURA et al. 2013). The evaluation of most of these traits is time-consuming, and the determination of some of them is not accurate, especially those that use score scales.
Grain yield traits (number of pods per plant,
number of grains per plant, number of grains per pod, mass of 100 grains, and grain yield) have been widely investigated by common bean breeding programs. Studies have revealed an increase in grain yield by increasing some traits, such as number of pods per plant (COIMBRA et al., 2006; BARILI et al., 2011; CABRAL et al., 2011; RIBEIRO; DOMINGUES; ZEMOLIN, 2014); number of grains per pod (MOURA et al., 2013; RIBEIRO; DOMINGUES; ZEMOLIN, 2014); and mass of 100 grains (COELHO et al., 2007; BARILI et al., 2011).
The development of common bean cultivars with higher grain yield is still one of the major goals of current breeding programs. If added with early cycle and upright plant architecture, these cultivars will represent marketing advantages to common bean farmers. Thus, investigating the correlation between these traits is paramount. No studies have addressed the correlation involving a great number of traits that confer earliness, upright plant architecture, and high grain yield in common bean lines. Moura et al. (2013) performed an in-depth study in this regard; however, they used a limited number of score scales to characterize the plant architecture and phenological data to determine earliness. Thus, this study aimed to evaluate whether common bean lines differ for the phenological, plant architecture, and grain yield traits; analyze the correlations between these traits; and select early and upright common bean lines with high grain yield.
MATERIAL AND METHODS
The experiments were conducted in the experimental area of the Bean Breeding Program of the Federal University of Santa Maria (latitude 29°42’S, longitude 53°49’W, and 95 m above sea level), located in the municipality of Santa Maria, state of Rio Grande do Sul (RS), Brazil. Seeds were sown on November 7, 2012 (rainy season) and February 28, 2013 (dry season), which correspond to the traditional bean growing seasons in the state of RS. The main differences between sowing dates were related to the average minimum and maximum temperatures, to the rainfall distribution, and to the relative humidity (Table 1).
Variable ---- Rainy season 2012---- ----Dry season 2013----
Nov Dec Jan Feb Mar Apr May Jun
Minimum temperature (°C) 17.5 19.9 18.2 19.1 16.4 14.4 11.0 9.5
Maximum temperature (°C) 30.4 31.1 30.3 29.9 26.6 26.4 21.4 18.9
Rainfall (mm) 72.8 293.0 145.3 97.7 188.6 147.4 71.6 81.6
Relative humidity (%) 70.5 77.8 75.8 80.9 83.8 83.5 87.2 89.7
Table 1. Meteorological data collected in the 8th Meteorology District, in Santa Maria Meteorological Station, belonging to
the Federal University of Santa Maria Federal (29o42’S lat, 53o49’W long, 95 m asl), in the state of Rio Grande do Sul,
The experiment consisted of a randomized blocks design with three replications. Treatments consisted of 14 common bean lines, of which ten
were inbred lines from different breeders, namely: CNFC 10762, CNFP 10794, LP 09-192, LP 09-40, DF 06-09, DF 06-17, GEN C4-7-8-1-2, GEN C4-7-7-2-2, CHC 98-42, and CHP 01-238; and
four were control cultivars (BRS Valente, Guapo Brilhante, Pérola, and Carioca). The common bean inbred lines and cultivars evaluated in this study represent the most consumed types of beans in Brazil, the black and Carioca beans (beige seed coat with brown streaks), belonging to the Middle American gene pool. These beans were developed by different breeders and indicate the technological advances of common bean breeding programs in southern Brazil. The experimental plot consisted of four 4 m rows, spaced at 0.5 m. The two central rows of each plot were harvested, totaling a useful area of 4 m2.
The soil is classified as typical alitic Argisol, Hapludalf, and was conventionally prepared. Fertilizers were applied based on the soil chemical analysis, as follows: 195 kg ha-1 of the 5-20-20 formulation at furrow sowing, and 20 kg ha-1 of urea at the first trifoliate leaf growth stage (V3). Cultural
practices followed the technical guidelines for common bean culture in southern Brazil (CTSBF, 2012). Disease control was not performed.
The following phenological traits were evaluated: flowering, considering the number of days from seedling emergence (V1) to the first flower
opening (R6); reproductive period, considering the
number of days from pre-flowering (R5) to maturity
(R9); and cycle, considering the number of days from
seedling emergence (V1) to maturity (R9). These
traits were determined in the plot useful area, using the scale developed by Fernández, Gepts and Lopez (1986).
Plant architecture traits (general adaptation score, lodging, stay-green phenotype, insertion of the first pod, insertion of the last pod, plant height, number of branches, number of internodes in the main branch, length of the first internode, length of the second internode, length of the third internode, length of the fourth internode, and length of the fifth internode) were determined at the R9 stage. The
following traits were determined using a score scale: (1) general adaptation score, where score 1 was assigned to upright plants, with greater number of pods per plant and no disease symptoms in the pod; and score 9 was assigned to prostrate plants, with long internodes, fewer pods per plant, highly severe disease symptoms in the pods (RIBEIRO et al., 2010); (2) lodging, where score 1 was assigned to upright plants, and score 9 was assigned to prostrated plants, touching the ground (CIAT, 1987); and (3) stay-green phenotype, where score 1 referred to plants with more than 80% of green branch with fully dry, mature pods, and score 5 referred to plants
with up to 20% of green branch, i.e., without the stay-green phenotype (AGUIAR; RAMALHO; MARQUES JÚNIOR, 2000).
Afterward, ten plants were randomly collected at the R9 stagein the useful area to
determine the insertion of the first pod, insertion of the last pod, plant height, number of branches, number of internodes in the main branch, and lengths of the first, second, third, fourth, and fifth internodes in the main branch, from the cotyledonal node. The length of the first internode corresponded to the distance from the cotyledonal node to the first internode; the length of the second internode indicated the distance from the cotyledonal node to the second internode; and so on, until the fifth internode.
Grain yield traits (number of pods per plant, number of grains per plant, number of grains per pod, and mass of 100 grains) were evaluated at the R9 stage, using ten plants randomly collected in the
useful area. Grain yield was calculated by the weight of the product obtained in all the experimental unit per hectare, at 13% of average humidity.
The data were subjected to individual and joint analysis of variance, based on a randomized blocks design. The F-test (p-value< 0.05) was used to test the hypotheses of the main effects (inbred line and growing season) and the effect of inbred line x growing season interaction (L x S). Effects of inbred line (L) and growing season (S) were considered as fixed, and the others (block and L x S interaction) were considered as random. The homogeneity of residual variances was determined by the Hartley’s F max test (CRUZ; REGAZZI, 1997). The Scott-Knott’s test (p-value= 0.05) was used to
compare the means of common bean inbred lines. Pearson’s correlation coefficients were estimated by using the phenotypic correlation matrix. The coefficients’ significance was determined by the Student’s t-test (p-value< 0.05). The multiplicative index (SUBANDI; COMPTON; EMPIG, 1973) was used to obtain estimates of genetic gain in selection. The four superior lines were selected based on the methodology described by Maziero, Ribeiro and Storck (2015). Statistical analyses were performed using the Genes software (CRUZ, 2013).
RESULTS AND DISCUSSION
The variance of experimental error was
homogeneous for both growing seasons (p-value> 0.05), which enabled the joint analysis of
Rev. Caatinga
fifth internodes. A significant cultivar x environment interaction has been described for number of pods per plant, number of grains per plant, number of grains per pod, mass of 100 grains, grain yield (RIBEIRO; DOMINGUES; ZEMOLIN, 2014), flowering (MOURA et al., 2013), and cycle (RIBEIRO et al., 2014) in experiments evaluating the performance of common bean cultivars. For these traits, the performance of common bean lines varied in function of the growing environment. In the present study, the dissimilarity in the performance of common bean lines can be explained by the different minimum and maximum air temperature, rainfall distribution, and air relative humidity recorded in each growing season (Table 1).
The values of the coefficient of variation ranged from 4.00 (cycle) to 22.83% (insertion of the first pod) (Table 2), which is similar result to that obtained for morphological and grain yield traits in common bean cultivars experiments (CARMO et al., 2007; MOURA et al., 2013; RIBEIRO; DOMINGUES; ZEMOLIN, 2014). Such wide variation classifies these coefficients into low and intermediate, based on the classification of Oliveira et al. (2009) for common bean experiments, conferring intermediate to high experimental precision to phenological, plant architecture, and grain yield traits assessed in the present study.
The common bean inbred lines varied regarding the phenological traits assessed in the different growing seasons. However, the inbred lines CHP 01-238, CNFP 10794, and DF 06-17 had early flowering in both growing seasons, which is not significantly different from cultivar Guapo Brilhante (Table 2). Some inbred lines presented
longer reproductive period in the dry season, as also observed for Pérola cultivar, such as DF 09-40,
CHC 98-42, CNFC 10762, GEN C4-7-7-2-2, GEN C4-7-8-1-2, LP 09-192, and CNFP 10794. The
Scott-Knott’s test did not enable the stratification among inbred lines regarding the reproductive period in the rainy season. Conversely, the cycle
ranged from 78.20 (CNFP 10794, rainy season) to 117.33 days (GEN C4-7-8-1-2, dry season),
characterizing all the inbred lines evaluated in this study as of intermediate cycle, according to Zimmermann and Teixeira (1996). The environment affects the beginning and duration of the phenological stages in common bean lines, and the common bean lines showed a wide variation regarding flowering, reproductive period, and cycle (ZILIO et al., 2013; RIBEIRO et al., 2014). For this reason, the characterization of these phenological stages and the identification of common bean lines with early or intermediate cycle are imperative, regardless of the growing environment.
The general adaptation score and lodging
scores were high for most of the inbred lines (Table 2), which indicates predominance of semi-upright and prostrate plants (RIBEIRO et al., 2010) and a higher rate of fallen plants or of plants touching the ground (CIAT, 1987). An explanation of this fact is that the heavy rainfalls recorded in both growing seasons (Table 1) might have contributed to the higher lodging rate of bean plants. In the rainy season, four lines (DF 06-09, CHP 01-238, LP 09-192, and CNFP 10794) presented a lodging
score lower than those of the control cultivars. However, the lower lodging scores of these lines have not been confirmed in the dry season. This fact is justified for the lodging scores vary according to the genotype and growing environment, as stated by Mendes, Ramalho and Abreu (2009).
The Scott-Knott’s test applied to the stay-green phenotype formed two groups of
genotypes in the dry season (Table 2): Group 1 was formed by genotypes LP 09-192, CNFP 10794, DF 06-17, BRS Valente, and Guapo Brilhante; and Group 2 was composed of the other genotypes. No inbred line was assigned with score 1 (plants with more than 80% of green branch and fully mature, dry pods) (AGUIAR; RAMALHO; MARQUES JÚNIOR, 2000). The identification of common bean lines with stay-green phenotype, i.e., with late branch senescence is essential, as it characterizes upright plants (CARMO et al., 2007). Similar to the lodging score, the stay-green low score for a given inbred line was not the same in both growing seasons due to the differences in weather conditions (Table 1), which is in agreement with the findings of Carmo et al. (2007).
*Means of common bean lines followed by the same letter in the column do not differ by the Scott-Knott’s test
(p-value= 0.05).
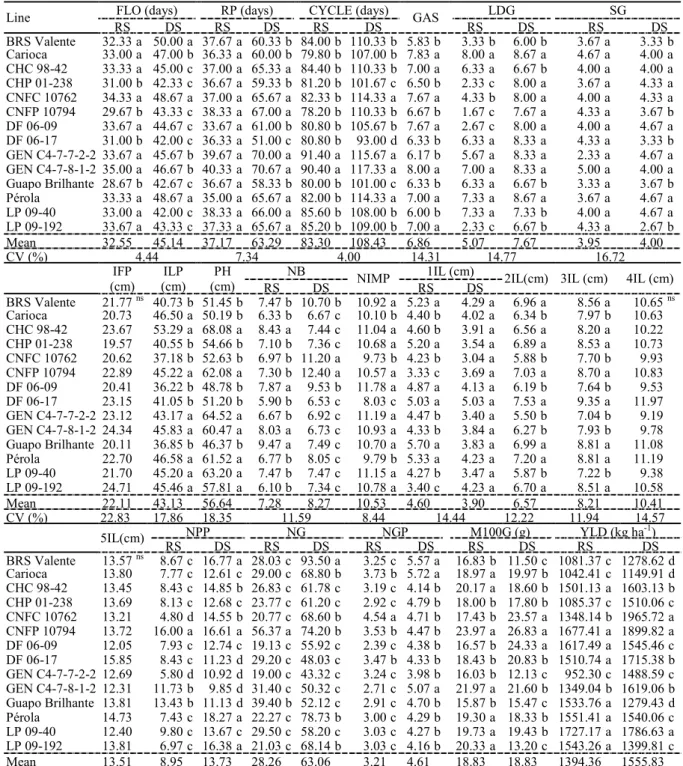
Table 2. Means* of the following traits: flowering (FLO), reproductive period (RP), cycle, general adaptation score (GAS),
lodging (LDG), stay-green phenotype (SG), insertion of the first pod (IFP), insertion of the last pod (ILP); plant height
(PH), number of branches (NB), number of internodes in the main branch (NIMB), lengths of the first (1IL), second (2IL), third (3IL), fourth (4IL) and fifth (5IL) internodes, number of pods per plant (NPP), number of grains per plant (NG), number of grains per pod (NGP), mass of 100 grains (M100G), and grain yield (YLD) of common bean lines assessed in the 2012 rainy season (RS) and 2013 dry season (DS).
Line FLO (days) RP (days) CYCLE (days) GAS LDG SG
RS DS RS DS RS DS RS DS RS DS
BRS Valente 32.33 a 50.00 a 37.67 a 60.33 b 84.00 b 110.33 b 5.83 b 3.33 b 6.00 b 3.67 a 3.33 b
Carioca 33.00 a 47.00 b 36.33 a 60.00 b 79.80 b 107.00 b 7.83 a 8.00 a 8.67 a 4.67 a 4.00 a
CHC 98-42 33.33 a 45.00 c 37.00 a 65.33 a 84.40 b 110.33 b 7.00 a 6.33 a 6.67 b 4.00 a 4.00 a
CHP 01-238 31.00 b 42.33 c 36.67 a 59.33 b 81.20 b 101.67 c 6.50 b 2.33 c 8.00 a 3.67 a 4.33 a
CNFC 10762 CNFP 10794
34.33 a 48.67 a 37.00 a 65.67 a 82.33 b 114.33 a 7.67 a 4.33 b 8.00 a 4.00 a 4.33 a
CNFP 10794 29.67 b 43.33 c 38.33 a 67.00 a 78.20 b 110.33 b 6.67 b 1.67 c 7.67 a 4.33 a 3.67 b
DF 06-09 33.67 a 44.67 c 33.67 a 61.00 b 80.80 b 105.67 b 7.67 a 2.67 c 8.00 a 4.00 a 4.67 a
DF 06-17 31.00 b 42.00 c 36.33 a 51.00 c 80.80 b 93.00 d 6.33 b 6.33 a 8.33 a 4.33 a 3.33 b
GEN C4-7-7-2-2 33.67 a 45.67 b 39.67 a 70.00 a 91.40 a 115.67 a 6.17 b 5.67 a 8.33 a 2.33 a 4.67 a
GEN C4-7-8-1-2 35.00 a 46.67 b 40.33 a 70.67 a 90.40 a 117.33 a 8.00 a 7.00 a 8.33 a 5.00 a 4.00 a
Guapo Brilhante 28.67 b 42.67 c 36.67 a 58.33 b 80.00 b 101.00 c 6.33 b 6.33 a 6.67 b 3.33 a 3.67 b
Pérola 33.33 a 48.67 a 35.00 a 65.67 a 82.00 b 114.33 a 7.00 a 7.33 a 8.67 a 3.67 a 4.67 a
LP 09-40 33.00 a 42.00 c 38.33 a 66.00 a 85.60 b 108.00 b 6.00 b 7.33 a 7.33 b 4.00 a 4.67 a
LP 09-192 33.67 a 43.33 c 37.33 a 65.67 a 85.20 b 109.00 b 7.00 a 2.33 c 6.67 b 4.33 a 2.67 b
Mean 32.55 45.14 37.17 63.29 83.30 108.43 6.86 5.07 7.67 3.95 4.00
CV (%) 4.44 7.34 4.00 14.31 14.77 16.72
IFP (cm)
ILP (cm)
PH (cm)
NB
NIMP 1IL (cm) 2IL(cm) 3IL (cm) 4IL (cm)
RS DS RS DS
BRS Valente 21.77 ns 40.73 b 51.45 b 7.47 b 10.70 b 10.92 a 5.23 a 4.29 a 6.96 a 8.56 a 10.65 ns
Carioca 20.73 46.50 a 50.19 b 6.33 b 6.67 c 10.10 b 4.40 b 4.02 a 6.34 b 7.97 b 10.63
CHC 98-42 23.67 53.29 a 68.08 a 8.43 a 7.44 c 11.04 a 4.60 b 3.91 a 6.56 a 8.20 a 10.22
CHP 01-238 19.57 40.55 b 54.66 b 7.10 b 7.36 c 10.68 a 5.20 a 3.54 a 6.89 a 8.53 a 10.73
CNFC 10762 CNFP 10794
20.62 37.18 b 52.63 b 6.97 b 11.20 a 9.73 b 4.23 b 3.04 a 5.88 b 7.70 b 9.93
CNFP 10794 22.89 45.22 a 62.08 a 7.30 b 12.40 a 10.57 a 3.33 c 3.69 a 7.03 a 8.70 a 10.83
DF 06-09 20.41 36.22 b 48.78 b 7.87 a 9.53 b 11.78 a 4.87 a 4.13 a 6.19 b 7.64 b 9.53
DF 06-17 23.15 41.05 b 51.20 b 5.90 b 6.53 c 8.03 c 5.03 a 5.03 a 7.53 a 9.35 a 11.97
GEN C4-7-7-2-2 23.12 43.17 a 64.52 a 6.67 b 6.92 c 11.19 a 4.47 b 3.40 a 5.50 b 7.04 b 9.19
GEN C4-7-8-1-2 24.34 45.83 a 60.47 a 8.03 a 6.73 c 10.93 a 4.33 b 3.84 a 6.27 b 7.93 b 9.78
Guapo Brilhante 20.11 36.85 b 46.37 b 9.47 a 7.49 c 10.70 a 5.70 a 3.83 a 6.99 a 8.81 a 11.08
Pérola 22.70 46.58 a 61.52 a 6.77 b 8.05 c 9.79 b 5.33 a 4.23 a 7.20 a 8.81 a 11.19
LP 09-40 21.70 45.20 a 63.20 a 7.47 b 7.47 c 11.15 a 4.27 b 3.47 a 5.87 b 7.22 b 9.38
LP 09-192 24.71 45.46 a 57.81 a 6.10 b 7.34 c 10.78 a 3.40 c 4.23 a 6.70 a 8.51 a 10.58
Mean 22.11 43.13 56.64 7.28 8.27 10.53 4.60 3.90 6.57 8.21 10.41
CV (%) 22.83 17.86 18.35 11.59 8.44 14.44 12.22 11.94 14.57
5IL(cm) NPP NG NGP M100G (g) YLD (kg ha
-1 )
RS DS RS DS RS DS RS DS RS DS
BRS Valente 13.57 ns 8.67 c 16.77 a 28.03 c 93.50 a 3.25 c 5.57 a 16.83 b 11.50 c 1081.37 c 1278.62 d
Carioca 13.80 7.77 c 12.61 c 29.00 c 68.80 b 3.73 b 5.72 a 18.97 a 19.97 b 1042.41 c 1149.91 d
CHC 98-42 13.45 8.43 c 14.85 b 26.83 c 61.78 c 3.19 c 4.14 b 20.17 a 18.60 b 1501.13 a 1603.13 b
CHP 01-238 13.69 8.13 c 12.68 c 23.77 c 61.20 c 2.92 c 4.79 b 18.00 b 17.80 b 1085.37 c 1510.06 c
CNFC 10762 CNFP 10794
13.21 4.80 d 14.55 b 20.77 c 68.60 b 4.54 a 4.71 b 17.43 b 23.57 a 1348.14 b 1965.72 a
CNFP 10794 13.72 16.00 a 16.61 a 56.37 a 74.20 b 3.53 b 4.47 b 23.97 a 26.83 a 1677.41 a 1899.82 a
DF 06-09 12.05 7.93 c 12.74 c 19.13 c 55.92 c 2.39 c 4.38 b 16.57 b 24.33 a 1617.49 a 1545.46 c
DF 06-17 15.85 8.43 c 11.23 d 29.20 c 48.03 c 3.47 b 4.33 b 18.43 b 20.83 b 1510.74 a 1715.38 b
GEN C4-7-7-2-2 12.69 5.80 d 10.92 d 19.00 c 43.32 c 3.24 c 3.98 b 16.03 b 12.13 c 952.30 c 1488.59 c
GEN C4-7-8-1-2 12.31 11.73 b 9.85 d 31.40 c 50.32 c 2.71 c 5.07 a 21.97 a 21.60 b 1349.04 b 1619.06 b
Guapo Brilhante 13.81 13.43 b 11.13 d 39.40 b 52.12 c 2.91 c 4.70 b 15.87 b 15.47 c 1533.76 a 1279.43 d
Pérola 14.73 7.43 c 18.27 a 22.27 c 78.73 b 3.00 c 4.29 b 19.30 a 18.33 b 1551.41 a 1540.06 c
LP 09-40 12.40 9.80 c 13.67 c 29.50 c 58.20 c 3.03 c 4.27 b 19.73 a 19.43 b 1727.17 a 1786.63 a
LP 09-192 13.81 6.97 c 16.38 a 21.03 c 68.14 b 3.03 c 4.16 b 20.33 a 13.20 c 1543.26 a 1399.81 c
Mean 13.51 8.95 13.73 28.26 63.06 3.21 4.61 18.83 18.83 1394.36 1555.83
Rev. Caatinga
Number of branches varied from 5.90 (DF 06-17, rainy season) to 12.40 (CNFP 10794, dry
season) (Table 2). These values were higher than the mean of 4.4 branches per plant reported in previous common bean lines experiments (COELHO et al., 2007; MOURA et al., 2013). Inbred lines and cultivars presented no significant differences for number of internodes in the main branch, except for DF 06-17, which had the lowest value for this trait (8.03). Common bean lines presented significant differences for the length of the first,
second, and third internodes. The inbred lines LP 09-40, GEN C4-7-7-2-2, and GEN C4-7-8-1-2
had the lowest length of the first, second, and third internodes. These same inbred lines also presented the greatest number of internodes in the main branch. According to Moura et al. (2013), greater number of internodes in the main branch and shorter internodes characterize upright plant architecture.
CNFP 10794 stood out from the other inbred lines for its greater number of pods per plant, mass of 100 grains, and grain yield, in both growing seasons, and for its greater number of grains per plant in the rainy season (Table 2). Ribeiro et al. (2008) estimated genetic gains in common beans in the state of Rio Grande do Sul and reported values of low magnitude for number of pods per plant, number of grains per plant, and mass of 100 grains, indicating that the changes performed on other phenological or morphological traits contributed more to the increased grain yield in common bean.
Number of grains per pod ranged from 2.39 (DF 06-09, rainy season) to 5.72 (Carioca, dry season) (Table 2), considered as low for Phaseolus vulgaris, which typically presents four to ten grains per pod (ZIMMERMANN; TEIXEIRA, 1996). The high average air temperature and heavy rainfall (Table 1), registered especially at flowering and pods filling stages, might have contributed to the lower fixation of flowers and pods, which would explain the low mean number of grains per pod reported in this study (3.91).
The following inbred lines had the best grain yield in the 2012 rainy season: LP 09-40, DF 06-09,
CHC 98-42, LP 09-192, CNFC 10794, and DF 06-17, not significantly differing from cultivars
Guapo Brilhante and Pérola (Table 2). In the 2013 dry season, the inbred lines LP 09-40, CNFC 10762, and CNFC 10794 had higher grain yield than all the other lines and cultivars. In this study, the grain yield values obtained for the common bean inbred lines were similar to those previously described by Ribeiro, Domingues and Zemolin (2014) in common bean cultivars competition experiments carried out under similar weather conditions. However, common bean lines evaluated in different regions of Brazil have presented higher grain yields (ZILIO et
al., 2011; FARIA et al., 2013; MINGOTTE et al., 2013; FARIA et al., 2014). This can be justified by the difference in the average minimum and maximum temperatures, rainfall distribution, relative humidity, biotic factors, soil chemical and physical composition, and management practices used in the experiments.
Grain yield in common bean varies according to the genotype (G), environment (E), and G x E interaction (ZILIO et al., 2011; FARIA et al., 2013; FARIA et al., 2014; RIBEIRO; DOMINGUES; ZEMOLIN, 2014). This study identified two lines (LP 09-40 and CNFP 10794) with high grain yield in both growing seasons. The line CNFP 10794 also stood out for its early flowering, longer reproductive period, and high values of other grain yield traits (number of pods per plant, number of grains per
plant, number of grains per pod, and mass of 100 grains). For these reasons, it will be selected for
the breeding program.
Positive and high magnitude correlation estimates were obtained between flowering and cycle (r= 0.70) and between reproductive period and cycle (r= 0.90) (Table 3), indicating that the beginning and duration of the phenological stages in common bean plants were highly correlated, as previously observed by Cabral et al. (2011) and Pérez-Vega et al. (2010). Plant height was highly correlated to reproductive period (r= 0.72) and insertion of the last pod (r= 0.78). In this case, the longer the duration of the reproductive period and/or the higher the insertion of the last pod, the higher were the common bean plants. Nonetheless, negative correlation was observed between reproductive period and lengths of the first internode (r= -0.72), second internode (r= -0.60), and third internode (r= -0.58). Thus, common bean plants with longer reproductive period showed higher value for plant height, but lower values for lengths of the first, second, and third internodes, i.e., these plants present prostate plant architecture.
Table 3. Pearson’s correlation coefficients between the following traits: flowering (FLO), reproductive period (RP), cycle,
general adaptation score (GAS), lodging (LDG), stay-green phenotype (SG), insertion of the first pod (IFP), insertion of the
last pod (ILP), and plant height (PH), number of branches (NB), number of internodes in the main branch (NIMB), lengths of the first (1IL), second (2IL), third (3IL), fourth (4IL), and fifth (5IL) internodes, number of pods per plant (NPP), number of grains per plant (NG), number of grains per pod (NGP), mass of 100 grains (M100G), and grain yield (YLD) of common bean lines assessed in the 2012 rainy season and 2013 dry season.
**,*: Significant at 1% and 5% probability level by the t-test.
A significant correlation was not observed between the other phenological, plant architecture, and grain yield traits (Table 3). This result can be explained by the fact that the selection of traits that confer upright plant architecture has not always been associated with high grain yield, as reported by Carmo et al. (2007), Cabral et al. (2011), Moura et al. (2013) and Silva et al. (2013). However, an upright plant architecture facilitates management practices and harvest in low- and high-technology
cultivation, usually resulting in better seeds quality. Thus, this trait should be assessed for the breeding program.
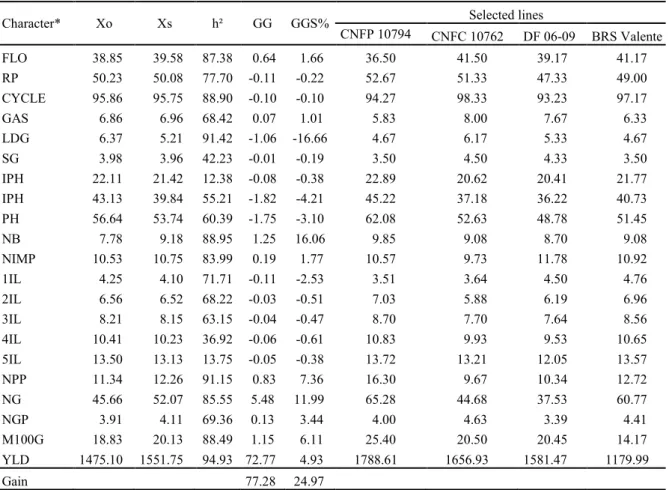
The predicted gain with selection was 24.97%, based on the multiplicative index (Table 4). According to Maziero, Ribeiro and Storck (2015), the multiplicative index is the best strategy for simultaneous selection to identify common bean lines of upright architecture, high grain yield, and nutritional quality.
RP CYCLE GAS LDG SG ILP PH NB NIMP
FLO 0.39 0.70 ** 0.59 * 0.22 0.23 0.15 0.13 0.05 0.11
RP 0.90 ** -0.20 0.04 -0.24 0.42 0.72 ** 0.13 0.50
CYCLE
0.07 0.14 -0.14 0.35 0.61 * 0.03 0.46
GAS
0.47 0.66 * -0.13 -0.26 -0.14 -0.27
LDG
0.54 * 0.03 0.13 -0.55 * -0.35
SG
-0.10 -0.25 -0.12 -0.27
ILP
0.78 ** -0.31 0.06
PH
-0.10 0.24
BN
0.33
1IL 2IL 3IL NPP NG NGP M100G YLD
FLO -0.10 -0.39 -0.38 -0.26 0.01 0.35 -0.11 -0.27
RP -0.72 ** -0.60 * -0.58 * 0.10 0.00 -0.11 0.13 0.11
CYCLE -0.48 -0.63 * -0.62 * -0.13 -0.13 -0.06 -0.11 -0.10
GAS 0.18 -0.24 -0.19 -0.51 -0.33 0.27 0.03 -0.15
LDG 0.22 -0.17 -0.18 -0.38 -0.36 0.10 0.06 -0.09
SG 0.06 -0.22 -0.20 -0.30 -0.28 0.14 0.30 0.34
ILP -0.23 0.01 -0.02 0.24 0.15 -0.11 0.20 0.04
PH -0.46 -0.27 -0.31 0.18 -0.02 -0.38 0.19 0.30
BN -0.23 0.02 0.01 0.59* 0.60 * 0.17 0.30 0.35
NIMP -0.34 -0.53 * -0.59 * 0.10 -0.04 -0.37 -0.16 -0.14
1IL 0.60 * 0.55 * -0.12 -0.09 -0.12 -0.40 -0.30
2IL 0.98 ** 0.51 0.47 -0.01 0.08 0.07
3IL 0.45 0.44 0.06 0.07 0.06
NPP 0.86 ** -0.03 0.40 0.39
NG 0.43 0.28 0.10
NGP 0.08 -0.33
Rev. Caatinga
Table 4. Mean of the original population (Xo), mean of selected lines (Xs), heritability (h²), genetic gain (GG), and percentage of genetic gain (GG%) with simultaneous selection by the multiplicative index for the four superior lines assessed in the 2012 rainy season and 2013 dry season.
Character* Xo Xs h² GG GGS% Selected lines
CNFP 10794 CNFC 10762 DF 06-09 BRS Valente
FLO 38.85 39.58 87.38 0.64 1.66 36.50 41.50 39.17 41.17
RP 50.23 50.08 77.70 -0.11 -0.22 52.67 51.33 47.33 49.00
CYCLE 95.86 95.75 88.90 -0.10 -0.10 94.27 98.33 93.23 97.17
GAS 6.86 6.96 68.42 0.07 1.01 5.83 8.00 7.67 6.33
LDG 6.37 5.21 91.42 -1.06 -16.66 4.67 6.17 5.33 4.67
SG 3.98 3.96 42.23 -0.01 -0.19 3.50 4.50 4.33 3.50
IPH 22.11 21.42 12.38 -0.08 -0.38 22.89 20.62 20.41 21.77
IPH 43.13 39.84 55.21 -1.82 -4.21 45.22 37.18 36.22 40.73
PH 56.64 53.74 60.39 -1.75 -3.10 62.08 52.63 48.78 51.45
NB 7.78 9.18 88.95 1.25 16.06 9.85 9.08 8.70 9.08
NIMP 10.53 10.75 83.99 0.19 1.77 10.57 9.73 11.78 10.92
1IL 4.25 4.10 71.71 -0.11 -2.53 3.51 3.64 4.50 4.76
2IL 6.56 6.52 68.22 -0.03 -0.51 7.03 5.88 6.19 6.96
3IL 8.21 8.15 63.15 -0.04 -0.47 8.70 7.70 7.64 8.56
4IL 10.41 10.23 36.92 -0.06 -0.61 10.83 9.93 9.53 10.65
5IL 13.50 13.13 13.75 -0.05 -0.38 13.72 13.21 12.05 13.57
NPP 11.34 12.26 91.15 0.83 7.36 16.30 9.67 10.34 12.72
NG 45.66 52.07 85.55 5.48 11.99 65.28 44.68 37.53 60.77
NGP 3.91 4.11 69.36 0.13 3.44 4.00 4.63 3.39 4.41
M100G 18.83 20.13 88.49 1.15 6.11 25.40 20.50 20.45 14.17
YLD 1475.10 1551.75 94.93 72.77 4.93 1788.61 1656.93 1581.47 1179.99
Gain 77.28 24.97
*trait: FLO: flowering, days; RP: reproductive period, days; cycle, days; GAS: general adaptation score; LDG: lodging;
SG: stay-green phenotype; IFP: insertion of the first pod, cm; ILP: insertion of the last pod, cm; PH: plant height, cm;
NB: number of branches; NIMB: number of internodes in the main branch; internode length (cm): 1IL: first, 2IL: second, 3IL: third, 4IL: fourth, and 5IL: fifth; NPP: number of pods per plant; NG: number of grains per plant; NGP: number of
grains per pod; M100G: mass of 100 grains, g; YLD: grain yield, kg ha-1.
In the present study, the four superior lines assessed in the 2012 rainy season and 2013 dry season were: CNFP 10794, CNFC 10762, DF 06-09, and BRS Valente (Table 4). CNFP 10794 presents earliness (lower number of days to flowering and shorter cycle), upright plant architecture (lower values of general adaptation score, lodging, and stay-green phenotype), and high grain yield (higher values of number of pods per plant, number of grains per plant, mass of 100 grains, and grain yield). For these reasons, CNFP 10794 will be selected for the breeding program.
CONCLUSIONS
Common bean lines differ for flowering, reproductive period, cycle, general adaptation score, lodging, stay-green phenotype, insertion of the last pod, plant height, number of branches, number of internodes in the main branch, lengths of the first,
second, and third internodes, number of pods per plant, number of grains per plant, number of grains per pod, mass of 100 grains, and grain yield.
The indirect selection for mass of 100 grains is of intermediate efficiency to increase grain yield in common bean.
CNFP 10794 is the superior common bean line selected by the multiplicative index; this line presents earliness, upright plant architecture, and high grain yield. For these reasons, it will be selected for the breeding program.
ACKNOWLEDGEMENTS
REFERENCES
AGUIAR, A. M.; RAMALHO, M. A. P.; MARQUES JÚNIOR, O. G. Controle genético do “stay-green” no feijoeiro (Phaseolus vulgaris L.). Revista Ceres, Viçosa, v. 47, n. 270, p. 155-167, 2000.
BARILI, L. D. et al. Correlação fenotípica entre componentes do rendimento de grãos de feijão comum (Phaseolus vulgaris L.). Semina: Ciências Agrárias, Londrina, v. 32, n. 4, p. 263-1274, 2011.
BLAIR, M. W. et al. Genetic diversity, inter-gene pool introgression and nutritional quality of common beans (Phaseolus vulgaris L.) from Central Africa. Theoretical and Applied Genetics, New York, v. 121, n. 2, p. 237-248, 2010.
BROUGHTON, W. et al. Beans (Phaseolus spp.): model food legumes. Plant Soil, Dordrecht, v. 252, n. 1, p. 55-128, 2003.
BURATTO, J. S. et al. Adaptabilidade e estabilidade produtiva em genótipos precoces de feijão no Estado do Paraná. Semina: Ciências Agrárias, Londrina, v. 28, n. 3, p. 373-380, 2007.
CABRAL, P. D. S. et al. A. Análise de trilha do rendimento de grãos de feijoeiro (Phaseolus vulgaris L.) e seus componentes. Revista Ciência Agronômica, Fortaleza, v. 42, n. 1, p. 132-138, 2011.
CARBONELL, S. A. M. et al. Tamanho de grão comercial em cultivares de feijoeiro. Ciência Rural, Santa Maria, v. 40, n. 10, p. 2067-2073, 2010.
CARMO, S. L. M. et al. Avaliação do 'stay green' em famílias segregantes de feijão (Phaseolus vulgaris L.). Ciência e Agrotecnologia, Lavras, v. 31, n. 4, p. 953-957, 2007.
CENTER INTERNACIONAL CENTER FOR TROPICAL AGRICULTURE - CIAT. Standard system for the evaluation of bean germplasm. Cali: CIAT, 1987. 54 p.
COELHO, C. M. M. et al. Diversidade genética em acessos de feijão (Phaseolus vulgaris L.). Ciência Rural, Santa Maria, v. 37, n. 5, p. 1241-1247, 2007.
COIMBRA, J. L. et al. Análise de causa e efeito sobre os componentes do rendimento em genótipos de feijão. Magistra, Cruz das Almas, v. 18, n. 2, p. 102-109, 2006.
COMISSÃO TÉCNICA SUL BRASILEIRA DE FEIJÃO – CTSBF. Informações técnicas para o cultivo de feijão na Região Sul brasileira 2012. 2.
ed. Florianópolis, SC: EPAGRI, 2012. 157 p.
CRUZ, C. D. Genes - a software package for analysis in experimental statistics and quantitative genetics. Acta Scientiarum Agronomy, Maringá, v. 35, n. 3, p. 271-276, 2013.
CRUZ, C. D.; REGAZZI, A. J. Modelos biométricos aplicados ao melhoramento genético. 2. ed. Viçosa, MG: Universidade Federal de Viçosa - UFV, 1997. 390 p.
FARIA, L. C. et al. Genetic progress during 22 years of improvement of carioca-type common bean in Brazil. Field Crops Research, Amsterdam, v. 142, n. 1, p. 68-74, 2013.
FARIA, L. C. et al. Genetic progress during 22 years of black bean improvement. Euphytica, Wageningen, v. 199, n. 1, p. 261-272, 2014.
FERNÁNDEZ, F.; GEPTS, P.; LOPEZ, M. Etapas de desarrollo della planta de frijol común (Phaseolus vulgaris L.). Cali: CIAT, 1986. 34 p.
MAZIERO, S. M.; RIBEIRO, N. D.; STORCK, L. Simultaneous selection in beans for architecture, grain yield and minerals concentration. Euphytica, Wageningen, v. 205, n. 2, p. 369-380, 2015.
MENDES, F. F.; RAMALHO, M. A. P.; ABREU, A. F. B. Índice de seleção para escolha de populações segregantes de feijoeiro-comum. Pesquisa Agropecuária Brasileira, Brasília, v. 44, n. 10, p. 1312-1318, 2009.
MINGOTTE, F. L. C. et al. Desempenho produtivo e qualidade pós-colheita de genótipos de feijão do grupo comercial carioca cultivados na época de inverno-primavera. Bioscience Journal, Uberlândia, v. 29, n. 5, p. 1101-1110, 2013.
MOURA, M. M. et al. Potencial de caracteres na avaliação da arquitetura de plantas de feijão. Pesquisa Agropecuária Brasileira, Brasília, v. 48, n. 4, p. 417-425, 2013.
OLIVEIRA, R. L. et al. Precisão experimental em ensaios com a cultura do feijão. Ciência e Agrotecnologia, Lavras, v. 33, n. 1, p. 113-119, 2009.
PÉREZ-VEGA, E. et al. Mapping of QTLs for morpho-agronomic and seed quality traits in a RIL population of common bean (Phaseolus vulgaris L.). Theoretical and Applied Genetics, New York, v. 120, n. 7, p. 1367-1380, 2010.
Rev. Caatinga
produtividade de grãos em feijão de grãos especiais. Científica, Jaboticabal, v. 42, n. 2, p. 178-186, 2014.
RIBEIRO, N. D. et al. Genetic progress in traits of yield, phenology and morphology of common bean. Crop Breeding and Applied Biotechnology, Viçosa, v. 8, n. 3, p. 232-238, 2008.
RIBEIRO, N. D. et al. Critério de seleção indireta para a produtividade de grãos em feijão. Ciência Rural, Santa Maria, v. 40, n. 4, p. 986-989, 2010.
RIBEIRO, N. D. et al. Desempenho agronômico e qualidade de cozimento de linhagens de feijão do grupo especiais. Ciência Agronômica, Fortaleza, v. 45, n. 1, p. 92-100, 2014.
SILVA, V. M. P. et al. Genetic potential of common bean parents for plant architecture improvement. Scientia Agricola, Piracicaba, v. 70, n. 3, p. 167-175, 2013.
SUBANDI, W.; COMPTON, A.; EMPIG, L. T. Comparison of the efficiencies of selection indices for three traits in two variety crosses of corn. Crop Science, Madison, v. 13, n. 2, p. 184-186, 1973.
ZILIO, M. et al. Contribuição dos componentes de rendimento na produtividade de genótipos crioulos de feijão (Phaseolus vulgaris L.). Revista Ciência Agronômica, Fortaleza, v. 42, n. 2, p. 429-438, 2011.
ZILIO, M. et al. Cycle, canopy architecture and yield of common bean genotypes (Phaseolus vulgaris) in Santa Catarina State. Acta Scientiarum Agronomy, Maringá, v. 35, n. 1, p. 21-30, 2013.
ZIMMERMANN, M. J. O.; TEIXEIRA, M. G. Origem e evolução. In: ARAÚJO, R. S. et al. (Eds.). Cultura do feijoeiro comum no Brasil. Piracicaba: Potafós, 1996, v. 1. cap. 2, p. 57-70.