www.bjorl.org
Brazilian
Journal
of
OTORHINOLARYNGOLOGY
ORIGINAL
ARTICLE
Encoding
of
speech
sounds
at
auditory
brainstem
level
in
good
and
poor
hearing
aid
performers
夽
Hemanth
Narayan
Shetty
∗,
Manjula
Puttabasappa
AllIndiaInstituteofSpeechandHearing,DepartmentofAudiology,Mysuru,Karnataka,India
Received5February2016;accepted20June2016 Availableonline14July2016
KEYWORDS
Frequencyfollowing response;
Acceptablenoise level;
Hearingaid performer
Abstract
Introduction:Hearingaidsareprescribedtoalleviatelossofaudibility.Ithasbeenreported thatabout31%ofhearingaidusersrejecttheirownhearingaidbecauseofannoyancetowards backgroundnoise.Thereasonfordissatisfactioncanbelocatedanywherefromthehearingaid microphonetilltheintegrityofneuronsalongtheauditorypathway.
Objectives:To measure spectra from theoutput ofhearing aid at theear canal leveland frequencyfollowingresponserecordedattheauditorybrainstemfromindividualswithhearing impairment.
Methods:Atotalofsixtyparticipantshavingmoderatesensorineuralhearingimpairmentwith agerangefrom15to65yearswereinvolved.EachparticipantwasclassifiedaseitherGoodor PoorHearingaidPerformersbasedonacceptablenoiselevelmeasure.Stimuli/da/and/si/ werepresentedthroughloudspeakerat65dBSPL.Attheearcanal,thespectraweremeasured intheunaidedandaidedconditions.Atauditorybrainstem,frequencyfollowingresponsewere recordedtothesamestimulifromtheparticipants.
Results:Spectrummeasuredineachconditionatearcanalwassameingoodhearingaid per-formersandpoorhearing aidperformers.Atbrainstemlevel,betterF0encoding;F0andF1
energiesweresignificantlyhigheringoodhearingaidperformersthaninpoorhearingaid per-formers.Thoughthehearingaidspectrawerealmostsamebetweengoodhearingaidperformers andpoorhearingaidperformers,subtlephysiologicalvariationsexistattheauditorybrainstem. Conclusion:Theresultofthepresentstudysuggeststhatneuralencodingofspeechsoundat thebrainstemlevelmightbemediateddistinctlyingoodhearingaidperformersfromthatof poorhearing aid performers.Thus,itcanbe inferredthatsubtlephysiological changesare evidentattheauditorybrainsteminapersonwhoiswillingtoacceptnoisefromthosewhoare notwillingtoacceptnoise.
© 2016 Associac¸˜ao Brasileira de Otorrinolaringologia e Cirurgia C´ervico-Facial. Published by Elsevier Editora Ltda. This is an open access article under the CC BY license (http:// creativecommons.org/licenses/by/4.0/).
夽 Pleasecitethisarticleas:ShettyHN,PuttabasappaM.Encodingofspeechsoundsatauditorybrainstemlevelingoodandpoorhearing aidperformers.BrazJOtorhinolaryngol.2017;83:512---22.
∗Correspondingauthor.
E-mail:[email protected](H.N.Shetty).
PeerReviewundertheresponsibilityofAssociac¸ãoBrasileiradeOtorrinolaringologiaeCirurgiaCérvico-Facial.
http://dx.doi.org/10.1016/j.bjorl.2016.06.004
PALAVRAS-CHAVE
Frequênciaseguida deresposta; Nívelderuído aceitável;
Usuáriodeaparelho auditivo
Codificac¸ãodossonsdafalanoníveldotroncoencefálicoauditivoembonsemaus usuáriosdeaparelhosauditivos
Resumo
Introduc¸ão: Osaparelhosauditivos sãoprescritospara aliviar aperdade audibilidade.Tem sidorelatadoquecercade31%dosusuáriosrejeitamseupróprioaparelhoauditivodevidoao desconfortocomoruídodefundo.Arazãoparaainsatisfac¸ãopodeestarsituadaemqualquer localdesdeomicrofonedoaparelhoauditivoatéaintegridadedeneurôniosaolongodavia auditiva.
Objetivos: Medirespectrosdesdeasaídadoaparelhoauditivononíveldocanalauditivoexterno efrequênciaderesposta(FFR)registradanotroncoencefálicodeindivíduoscomdeficiência auditiva.
Método: Umtotaldesessentaparticipantescomdeficiênciaauditivaneurossensorial moder-ada, comfaixa etáriade 15 a65 anosforam envolvidos. Cadaparticipante foi classificado comousuáriobomoumaudepróteseauditiva(GHPouPHP)combasenamedidadenívelde ruídoaceitável(ANL).Estímulos/da/e/si/foramapresentadosemalto-falantea65dBSPL. Nomeato acústicoexterno,osespectros forammedidosnascondic¸ões semaparelhoecom aparelho.Notroncoencefálicoauditivo,FFRforamregistradasparaosmesmosestímulosdos participantes.
Resultados: Osespectros medidosemcadacondic¸ãonocanalauditivoforamosmesmosem GHP ePHP.Nonível do troncocerebral,melhor codificac¸ãoF0; energiasde F0 eF1 foram significativamente maioresemGHP doqueem PHP.Emboraosespectros doaparelho audi-tivofossemquaseosmesmosentreGHPePHP,existemvariac¸õesfisiológicassutisnotronco encefálicoauditivo.
Conclusão:Oresultadodopresenteestudosugerequeacodificac¸ãoneuraldosomdafalano níveldotroncoencefálicopodesermediadadistintamenteemGHPemcomparac¸ãocomPHP. Assim,pode-seinferirquemudanc¸asfisiológicassutissãoevidentesnotroncoencefálicoem uma pessoaque estádispostaaaceitaroruídoem comparac¸ãocomaquelesquenão estão dispostosaaceitaroruído.
© 2016 Associac¸˜ao Brasileira de Otorrinolaringologia e Cirurgia C´ervico-Facial. Publicado por Elsevier Editora Ltda. Este ´e um artigo Open Access sob uma licenc¸a CC BY (http:// creativecommons.org/licenses/by/4.0/).
Introduction
Hearing aidis oneofthecommonrehabilitativemeasures
forindividualswithpermanenthearingimpairment.Insome
casesofhearinglosses,hearingaidscanbeusedtransitory.
However,hearing aid users often complainof background
noise resulting in rejection of hearing AID.1 Kochkin2 has
reportedthatabout31%ofthehearingaidusersrejecttheir
hearingaidbecauseofbackground noise.Variousoutcome
measures areavailable that considerbackground noise as
oneofthefactorstohaveaneffectonsatisfactionwiththe
hearingaid.Unfortunately,theseoutcomemeasuresareto
beadministeredafteraperiodofexperiencewithhearing
aid. Besides measures suchas speechin noise test, quick
speechinnoisetest, competingnoisetest,andhearingin
noisetestarebeingusedtopredictthehearingaidbenefit.3
Thoughthesetestsaresensitivetomeasurespeech
perfor-manceinnoiseandareadministeredatthetimeoffitting
hearingaid; theyfailtopredict real-worldbenefitand/or
satisfactionfromhearingAids.4Thisissueisaddressedpartly
by acceptable noise level (ANL) measure introduced by
Nabeleket al.,5 in which the client rates annoyance due
tobackgroundnoiseinthepresenceofspeech.
Nabeleketal.6demonstratedthatvalueofANLspredict
goodand poor hearingaid performerswith85% accuracy.
TheANLis notaffectedbythetypeofbackgroundnoise,5
preferenceofbackgroundsounds,7primarylanguageofthe
listener,8 speechpresentation levels,7 age, hearing
sensi-tivityand language9 contentof speechsignal andspeaker
gender.10Harkrider,11 studiedthephysiologicalcorrelateof
ANL involved at higher auditory centresutilizing
electro-physiological measurement. In individuals with low ANLs
(i.e.,greaterbackgroundnoiseacceptance),amplitudesof
waveV of auditory brainstem response (ABR), all
compo-nentsof middle latency response (MLR), andlate latency
response (LLR) were noted to be significantly prolonged
when compared to individuals who obtained high ANLs
(lowerbackgroundnoiseacceptance).Thisisduetostronger
efferent mechanism, such that sensory inputs are
sup-pressedand/orcentralafferentmechanismislessactive.12
Thus,ANLproved tobephysiologically sensitivemeasure.
However,itisinterestingtoknowthewayinwhich
ampli-fiedspeechisrepresentedphysiologicallyingoodandpoor
hearingaidperformers.
Despite advancement in hearing aid technology, some
individualsaccepthearingaidandothersmayrejectinspite
of fact that they have a similar hearing loss in terms of
degree,type,andconfiguration.Thevariabilityin
satisfac-tionfromrehabilitativedevicemightprobablybeduetothe
processingparametersofhearingaid,and/oratinteraction
betweenoutputofhearingaidanditsacousticparameters
presentstudy,outputof hearingaid isinvestigatedat ear
canalandatauditorybrainstem.
Over the decades, researchers have used probe tube
microphone(PTM)systemtomeasuretheeffectofhearing
aid processingon acousticsof speech. The PTM
measure-ment reflects the acoustic effect of the factors such as
pinna, ear canal, head and torso.14 Primarily, the PTM is
usedtooptimize/verifythehearingaidgaintomatchwith
thetargetgainatdifferentfrequenciesasprescribedbythe
fittingformula.15 Itiswellestablishedthatoutputof
hear-ingaid at theearcanal willalter amplitudes offormants
leadingtomisperception.Anexperimentwasconductedby
Stelmachowiczetal.16 whorecordedoutputofthehearing
aidattheearcanalusinglinearandnon-linearhearingaids
onthreelistenerswithmild-moderatesensorineuralhearing
loss.They carriedoutspectralanalysisontheserecorded
stimuli. The results revealed a precipitous roll-off in the
high frequency response, thus limiting the informationof
a consonant cues. On similar line, Souza and Tremblay17
conductedastudytocorrelateconsonanterrorsto
acous-tic analysis of amplified speech in subjects with mild to
moderate sensorineural hearing loss. They observed that
/da/stimuluswasconsistentlymisperceivedas/ga/.This
wasattributed to the amplitude of aided burst spectrum
of/da/whichwasfoundtobesimilartotheunprocessed
burstspectrumamplitudeof/ga/.Kewley-Port18 reported
that identification of stop consonants in the initial
posi-tion requires the spectrum of burst as the primary cue
for speechrecognition. Thus,after amplificationthe stop
consonants are more likely to have place error.17
How-ever,amplifiedconsonant-vowelcombinationoffricativeor
affricativetendstoshowmannererrors,asconsistent
mis-perception of /i/ for /di/ speech sounds19 was noted.
When theacousticoutput of hearingaid wasanalyzed, it
wasrevealedthatamplitudespectrumoffricative/i/was
similartotheunprocessed affricativespectrumamplitude
of /di/.Hence, performingspectral analysisof the
out-putof hearing aid recorded at the earcanal throwslight
on the processing parameters of hearing aid. There are
instancesinwhichacousticcuesaredistortedbutalistener
stillrecognizescorrectly.Thiscouldbeduetoredundancyor
fromthecontextualcuesofspeech.Insomeotherinstances
acousticcuesarepreservedbutalistenerfailstorecognize
speechsound.Thismaypossiblybebecauseofinsufficient
sensitivityincochleaand/orconcomitantchangesat
differ-entlevelsofauditorypathway.Hence,anevokedpotential
recordedtospeechstimulishouldbeusedtovalidate
per-ceptionregisteredatdifferentlevelsofauditorypathway.
Inthepresentstudy,evokedresponseatthelevelof
audi-torybrainstemofgoodandpoorhearingaidperformersis
investigated.
Thefrequencyfollowingresponses(FFR)hasbeen
exten-sively studied to understand the physiological processing
of speech at the auditory brainstem level. The FFR is a
phase-lockedresponsetoperiodicaspectsofstimuli,
includ-ingspeech, up to1000Hz20,21 from the neural population
of inferior colliculus of rostral brainstem.22 The FFR has
beenreliablyrecordedtoconsonant-vowelsounds/da/.23---26
Further, FFR to /da/ stimulus has been investigated in
monaural27 and binaural28 conditions; in the presence of
backgroundnoise;27 andstimulationof eitherright or left
ear.29 TheFFRwassuccessfullyrecordedusingloudspeaker
asatransducertodeliverthestimuli/da/and/si/.30From
this,it isclear thatFFRis astimuluscontingent response
thatismostrobustformid-andlow-frequencies.Thoughthe
frequencyresponseofhearingaidisupto6500Hz,theFFR
isasensitivetooltoanychangeinprocessingintheauditory
brainstem,suchthatitanswersthequestiononhow
ampli-fiedspeechsoundsareencodedinmid-andlow-frequencies
fromgoodandpoorhearingaidperformers.
Fromtheexistingliterature,itcanbeinferredthat
spec-tralanalysesofhearingaidoutputobtainedusingthePTM
giveinformationonhearingaidprocessingattheearcanal
level.Further,stimulusfromtheearcanalisrelayedtothe
auditory brainstem level and is measured using FFR. The
FFRwillhelpininferringtheneuralencodingoftheongoing
speech.Thesemeasuresgiveinsightintothewayinwhich
the speechis neurallyencoded at thebrainstem level, in
individualswithsensorineuralhearingimpairmentwhoare
classified asgoodand poorhearing aid performershaving
comparabletype,degreeandconfigurationofhearingloss.
Therefore,thepresentstudyintendstoinvestigatehearing
aid output at theearcanal todetermine extent of
alter-ationcausedbythehearingaidonthespectralparameters.
Inaddition,wayinwhichamplifiedspeechisrepresentedat
thebrainstemlevelingoodandpoorhearingaidperformers
alsoisbeinginvestigated.Theobjectivesformulatedforthe
studyweretocompare:(1)spectralchangesbetweenGHP
andPHPin unaidedandaided conditionsat theearcanal
usingthePTM;and(2)neuralencodingofspeechsoundsat
auditorybrainstemlevelinGHPandPHP.
Methods
Participants
A total of 60 participants who had bilateral moderate
sensorineural hearing loss with a flat configuration were
involved inthestudy.Flat configurationwasoperationally
defined as the difference between least and highest
air-conductionthresholdsbeinglessthan20dBintherangefrom
0.25to8kHz.31Theagerangeoftheparticipantswasfrom
15to65years.Theyhadspeechidentificationscores(SIS)
thatwasgreaterthanorequalto75%at40dBSL(re:speech
receptionthreshold,SRT).Thetestearhadnormalmiddle
earstatusasindicatedby‘A’typetympanogramwithmiddle
earpeakpressurerangingfrom+50daPato−100daPa,and
admittance ranging from0.5mL to1.75mL. The auditory
brainstem response (ABR) wasrecorded at two repetition
ratesof11.1sand90.1sat90dBnHLtoensurethatthere
wasnoretrocochlearpathology.Thelatencydifferenceof
V peakof ABR wasfound tobeless than 0.8ms between
thetworepetitionrates. Allparticipantswerenaïve
hear-ingaidusersandtherewasnoself-reportedhistoryofother
otologicalandneurologicalproblems.Theparticipantswere
further classified into Good or Poor Hearing aid
Perform-ers(GHP or PHP)usingtheacceptable noise level(ANL).6
ThoseparticipantswhoobtainedanANL scoreof≤7were
considered asgoodhearingaid performersand ascore of
≥13wereconsideredaspoorhearingaidperformers.6The
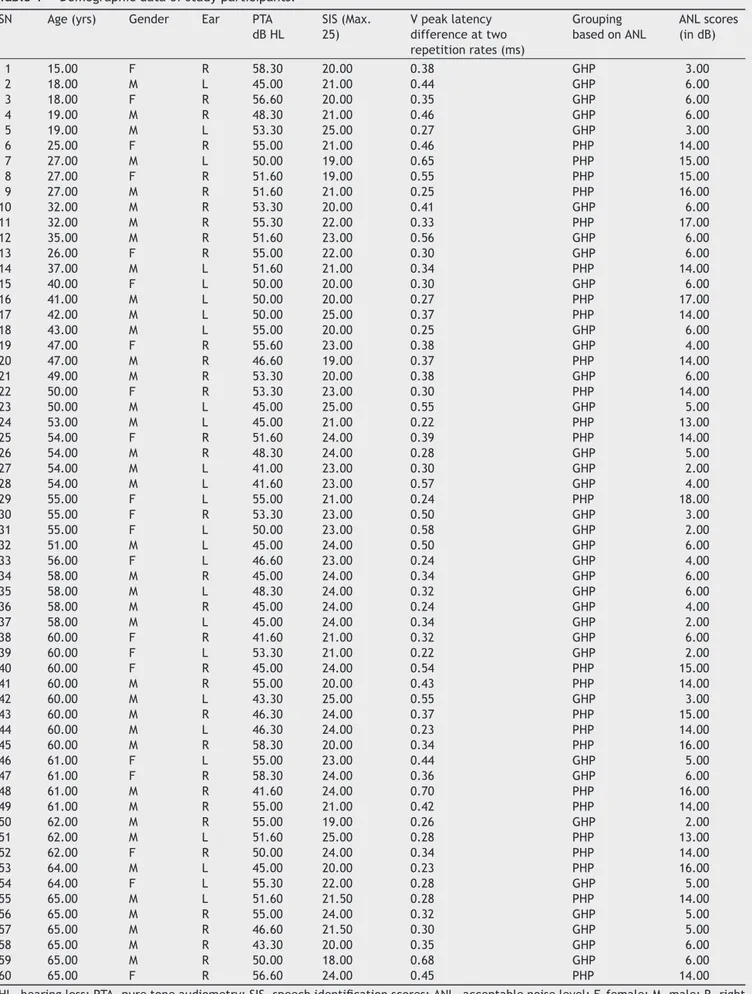
demographicdataofeach participantinclinicalgroupare
tabulatedinTable1.Thehearingthresholdsateach
Table1 Demographicdataofstudyparticipants.
SN Age(yrs) Gender Ear PTA dBHL
SIS(Max. 25)
Vpeaklatency differenceattwo repetitionrates(ms)
Grouping basedonANL
ANLscores (indB)
1 15.00 F R 58.30 20.00 0.38 GHP 3.00
2 18.00 M L 45.00 21.00 0.44 GHP 6.00
3 18.00 F R 56.60 20.00 0.35 GHP 6.00
4 19.00 M R 48.30 21.00 0.46 GHP 6.00
5 19.00 M L 53.30 25.00 0.27 GHP 3.00
6 25.00 F R 55.00 21.00 0.46 PHP 14.00
7 27.00 M L 50.00 19.00 0.65 PHP 15.00
8 27.00 F R 51.60 19.00 0.55 PHP 15.00
9 27.00 M R 51.60 21.00 0.25 PHP 16.00
10 32.00 M R 53.30 20.00 0.41 GHP 6.00
11 32.00 M R 55.30 22.00 0.33 PHP 17.00
12 35.00 M R 51.60 23.00 0.56 GHP 6.00
13 26.00 F R 55.00 22.00 0.30 GHP 6.00
14 37.00 M L 51.60 21.00 0.34 PHP 14.00
15 40.00 F L 50.00 20.00 0.30 GHP 6.00
16 41.00 M L 50.00 20.00 0.27 PHP 17.00
17 42.00 M L 50.00 25.00 0.37 PHP 14.00
18 43.00 M L 55.00 20.00 0.25 GHP 6.00
19 47.00 F R 55.60 23.00 0.38 GHP 4.00
20 47.00 M R 46.60 19.00 0.37 PHP 14.00
21 49.00 M R 53.30 20.00 0.38 GHP 6.00
22 50.00 F R 53.30 23.00 0.30 PHP 14.00
23 50.00 M L 45.00 25.00 0.55 GHP 5.00
24 53.00 M L 45.00 21.00 0.22 PHP 13.00
25 54.00 F R 51.60 24.00 0.39 PHP 14.00
26 54.00 M R 48.30 24.00 0.28 GHP 5.00
27 54.00 M L 41.00 23.00 0.30 GHP 2.00
28 54.00 M L 41.60 23.00 0.57 GHP 4.00
29 55.00 F L 55.00 21.00 0.24 PHP 18.00
30 55.00 F R 53.30 23.00 0.50 GHP 3.00
31 55.00 F L 50.00 23.00 0.58 GHP 2.00
32 51.00 M L 45.00 24.00 0.50 GHP 6.00
33 56.00 F L 46.60 23.00 0.24 GHP 4.00
34 58.00 M R 45.00 24.00 0.34 GHP 6.00
35 58.00 M L 48.30 24.00 0.32 GHP 6.00
36 58.00 M R 45.00 24.00 0.24 GHP 4.00
37 58.00 M L 45.00 24.00 0.34 GHP 2.00
38 60.00 F R 41.60 21.00 0.32 GHP 6.00
39 60.00 F L 53.30 21.00 0.22 GHP 2.00
40 60.00 F R 45.00 24.00 0.54 PHP 15.00
41 60.00 M R 55.00 20.00 0.43 PHP 14.00
42 60.00 M L 43.30 25.00 0.55 GHP 3.00
43 60.00 M R 46.30 24.00 0.37 PHP 15.00
44 60.00 M L 46.30 24.00 0.23 PHP 14.00
45 60.00 M R 58.30 20.00 0.34 PHP 16.00
46 61.00 F L 55.00 23.00 0.44 GHP 5.00
47 61.00 F R 58.30 24.00 0.36 GHP 6.00
48 61.00 M R 41.60 24.00 0.70 PHP 16.00
49 61.00 M R 55.00 21.00 0.42 PHP 14.00
50 62.00 M R 55.00 19.00 0.26 GHP 2.00
51 62.00 M L 51.60 25.00 0.28 PHP 13.00
52 62.00 F R 50.00 24.00 0.34 PHP 14.00
53 64.00 M L 45.00 20.00 0.23 PHP 16.00
54 64.00 F L 55.30 22.00 0.28 GHP 5.00
55 65.00 M L 51.60 21.50 0.28 PHP 14.00
56 65.00 M R 55.00 24.00 0.32 GHP 5.00
57 65.00 M R 46.60 21.50 0.30 GHP 5.00
58 65.00 M R 43.30 20.00 0.35 GHP 6.00
59 65.00 M R 50.00 18.00 0.68 GHP 6.00
60 65.00 F R 56.60 24.00 0.45 PHP 14.00
GHP
0
20
40
60
Threshold (dB HL)
80
100
0.25 0.50 1
Frequency (kHz)
2 4 8
PHP
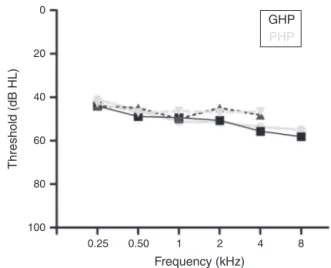
Figure1 Audiogramsofgoodandpoorhearingaid perform-ers.
hearingaidperformersaredepictedinFig.1.Thestudywas
approvedby theAllIndia Institute ofSpeech andHearing
EthicsCommitteeforResearchinHumans.Informedconsent
wasobtainedfromeachparticipant.
Stimuli
Naturallyproducedconsonantvowel(CV)tokenswere
uti-lizedastargetteststimuli.Anadultmalewithnormalvoice
wasused to record the CV tokens. The duration of /da/
and /si/ stimuli was 94ms and 301ms, respectively. For
/da/,thevoiceonsettimewas18ms,burstduration was
5ms,transitiondurationwas37ms,andvoweldurationwas
34ms.For/si/, thefricativedurationwas159.3ms,
tran-sition duration was 47.1ms and the vowel duration was
94.6ms. Both the stimuli were converted from ‘.wav’ to
‘.avg’formatusingwavtoavgm-fileofBrainstemtoolbox.
The‘.avg’formatofboththestimuliwerebandpassfiltered
from30to3000HzusingNeuroscan(Scan2-version4.4)to
knowthefunctionalrelationshipbetweentheacoustic
struc-tureofspeechandthebrainstemresponsetospeech.The
‘stimulus.avg’,waveformsandspectrogramsofthetwoCV
tokensaredepictedinFig.2.Table2summarizesthe
funda-mentalfrequency(F0)andthefirsttwoformantfrequencies
(F1andF2)ofthevowelcomponentof/da/and/si/stimuli.
TheonsettosteadystateF0,F1andF2withinthetransition
duration (37ms)of /da/stimulus, and frequency
compo-nentswithinthetransitionduration (42ms)of/i/ portion
of/si/stimulusweremeasuredusingPraat(version5.1.29)
software.
Further, Kannada passage developed by Sairam and
Manjula32 wasreadoutinnormalvocaleffortbyafemale
speakerwasrecordedusingAdobeAudition(version3)
soft-ware. This recorded passage was used to determine the
acceptablenoiselevel(ANL).Agoodnesstestwasperformed
inordertoverifythequalityoftherecordedKannada
pas-sage,inwhichtenlisteners withnormalhearingratedthe
passagefornaturalness.
Hearingaid
DigitalBehindTheEar(BTE)hearingaidwasusedtorecord
theoutputat theearcanalandattheauditory brainstem
responsefromeachparticipant.Accordingtothetechnical
specifications,frequencyrangeoftesthearingaidextended
from0.210to6.5kHz.Thepeakfull-ongainwas58dBand
high-frequency average full-on gain was49dB. The
func-tioningofthehearingaid wasensuredatthebeginningof
the data collectionandrepeated periodicallyduring data
collection.
Procedure
Eachparticipantwasclassifiedintogoodandpoorhearing
aidperformerusingthebehaviouralANLtest.Thetest
hear-ingaidwithcustomearmouldwasfittedtoeachparticipant
anditsgainwasoptimized.Tooptimizethehearingaidgain,
sixLing’ssyllables werepresented atacalibratedlevel of
65dBSPLthroughtheaudiometerinasoundfield.Thegain
andthefrequencyresponseofthehearingaidwere
manipu-latedfortheaudibilityofeachofsixLing’ssyllables,through
fine tuning option. To know the extent to which spectral
featurearepreservedbythehearingaid,theoutputofthe
hearingaidtoeachstimuluswasrecordedattheearcanal
usingtheprobetubemicrophonemeasure.Further,theFFR
at the brainstem level wasrecorded to each stimulus, in
bothunaidedandaidedconditions.
Acceptablenoiselevel
Acceptablenoiselevel(ANL)evaluatesthereactionofthe
listener to background noise while listening to speech.
For the measurement of ANL, the method given by
Nabelek et al.5 was adopted. Each study participant was
Table2 Fundamentalfrequencyandthetwoformantfrequencies(inHz)atthetransitiondurationoforiginalandfiltered versionof/a/and/si/stimuli.
Stimuli F0(Hz) F1(Hz) F2(Hz)
Onset Steadystate Onset Steadystate Onset Steadystate
Originalversion /a/ 135.7 131.2 519.8 556.3 1822.4 1677.7
/si/ 145.7 137.5 345.4 308.8 2268.5 2451.5
Filteredversion /a/ 135.7 131.2 519.8 556.3
/si/ 145.7 137.5 345.4 308.8
F0,fundamentalfrequency;F1andF2,firstandsecondformantfrequencies;F2,forfilteredversionisnotapplicablesincetheupper
/da/stimulus
Amplitude (
µ
V)
F
requency (Hz)
/si/stimulus
Brust/onset CV boundary
5 msec.
18 msec.
C
F
B
E
A
D
37 msec. 34 msec.
f5
f5
f4 f4
0 50 94 0 150 301
Time (msec)
f3 f3
f2 f2
f1
f1 159.3 msec.
94.6 msec. 47.1 msec.
Transition Steady state Transition
Steady state Fricative duration
VOT
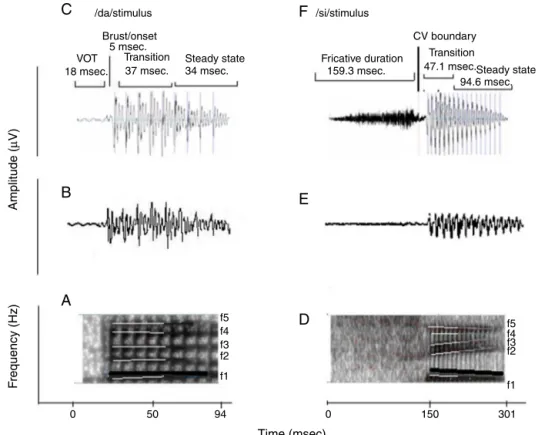
Figure2 (A)and(D)arethespectrogramsof/da/and/si/stimuli.ThedarkblacksolidlineinbothstimuliindicatestheF0,
whichhasafallingpattern.Theformantfrequenciesarerepresentedbywhitelines.TheF1andF2of/da/isflatinpattern.TheF1
of/si/stimulusisfallinginpatternandF2israisinginpattern.(C)and(F)arethewaveformsof/da/and/si/stimuli.Forsound
/da/,thevoiceonsettimewas18ms,theburstdurationwas5ms,thetransitiondurationwas37msandvoweldurationof34ms. Forthesound/si/,thefricativedurationwas159.3ms,transitiondurationwas47.1msandvoweldurationwas94.6ms.
made to sit comfortably on a chair in front of the loudspeaker of the audiometer that was located at 1m distanceand45◦ Azimuth.TocomputetheANL,most
com-fort level (MCL) and background noise level (BNL) were measured.
The recordedKannada passagewasroutedthroughthe auxiliaryinput totheloudspeakerof theaudiometer. The presentationlevelsetatthelevelofSRT.Gradually,thelevel wasadjustedin5dB-stepstoestablishthemostcomfortable level(MCL)andtheninsmallerstepssizeof+1and−2dB, untilthe MCL wasestablishedreliably.After theMCL was established,speechnoisewasintroducedat 30dBHL.The levelofthespeechnoisewasincreasedin5dB-stepsinitially, andthenin2dB-steps,toapointatwhichtheparticipant waswillingtoacceptthenoisewithout becomingtiredor fatiguedwhile listening toandfollowing thewords in the story.Themaximumlevelatwhichhe/shecouldacceptor putup withthespeechnoise withoutbecoming tiredwas consideredasthebackgroundnoiselevel(BNL).Thelevelof thespeechnoisewasadjusteduntilparticipantwasableto ‘put-up-with’thenoisewhilefollowingthestory.The resul-tantlevelwastheBNL.The ANLquantifiestheacceptable level of background noise andis calculated asthe differ-ence between MCL (dB HL) and BNL (dB HL).4 Based on
the ANLs,each participantwasclassified asgood (ANLof
≤7dB) or poor (ANL of ≥13dB) hearing aid performers.4
The procedure of ANL was repeated twice and the
average of thetwo valueswasconsidered asthe ANL for
eachparticipant.
Hearingaidgainoptimization
EachparticipantwasfittedwiththedigitalBTEtest
hear-ingaidusingacustommadesoftshellmould.Thehearing
aid was programmed using NAL-NL1prescriptive formula.
The real ear measurement was carried out tomatch the
gainofhearingaidwiththetargetgainobjectively.Further,
theLing’ssixspeechsoundswerepresentedat65dBSPLto
optimizethehearingaidgain.Throughfine tuningoption,
thegainandthefrequencyshapingofthehearingaidwere
optimizedfortheaudibilityofLing’ssixsounds.
Hearingaidprocessedspeechatearcanal
Theleveloftheeachsignal (storedinpersonalcomputer)
wasvariedintheaudiometersothattheintensitymeasured
was65dBSPLinsoundlevelmeter.LarsonDavis824sound
levelmeter(SLM)waspositionedatthetestearofthe
par-ticipant.TheSLMwassetatfastweightingfunction,andit
wasensuredthatthestimuli/da/and/si/werepresented
at65dBSPL,basedonpeakamplitudelevelreadontheSLM.
Afterthecalibrationofstimuluswasensured,output
microphonemeasurement,inbothunaidedandaided
con-ditions.Theprobetube microphoneintheearcanalpicks
upthespectralenergiesatapproximatelyhalf-octavebands
from0.25kHzto8kHzforeachspeechstimulus.Thelevels
asafunctionoffrequencyfrom0.25kHzto8kHz,inoctaves,
werenoteddownforeachstimulus,intheunaidedandaided
conditions.
Acquisitionofthefrequencyfollowingresponse
Each participant was seated comfortably in a reclining
chairwitharm.The electrodesites werecleaned upwith
skinpreparinggel.Disctypesilvercoatedelectrodeswere
placed using conduction gel at the test sites. The FFR
was recorded using vertical montage. The non-inverting
electrode (+) was placed onthe vertex (Cz), the ground
electrodewasonupperforehead (Fpz)andthe inverting
electrode(−)wasplacedonnose.Itwasensuredthatthe
electrodeimpedancewaslessthan5kforeachofthe
elec-trodesandthattheinter-electrodeimpedancewaslessthan
2k.
Prior to recording, calibration of stimuli was ensured
usingLarsonDavisSystem824SLM.TheSLMwaspositioned
atreferencepoint.Itisthepointwherethetestearofthe
participantwouldbepositionedatthetimeoftesting.The
SLMwassetatfastweightingfunctionforthemeasurement.
Itwas ensuredthat both stimuli/da/ and /si/ were
pre-sentedat65dBSPL,basedonpeakamplitudelevelreadon
theSLM.
TheloudspeakeroftheAuditoryEvokedPotential
equip-mentwasplacedat 45◦ Azimuthfromtheparticipanttest
ear,locatedat thecalibratedpositionof12inchdistance.
Theheightofloudspeakerwasadjustedtothelevelof
par-ticipanttestear. Theparticipantwasinstructed toignore
the stimulus and to watch a movie that was muted and
playedthroughabatteryoperatedlaptopcomputer.He/she
wasalsoaskedtominimizetheeyeandheadmovement.
ForrecordingtheunaidedandtheaidedFFR,thestimulus
/da/waspresentedthroughloudspeakeratthe
presenta-tionlevelof65dBSPLtothetestear.ThePC-basedevoked
potentialsystem, Neuroscan4.4(Stim2-version4.4),
con-trolledthe timing of stimulus presentation and delivered
anexternal trigger tothe evokedpotentialrecording
sys-tem,Neuroscan(Scan2-version4.4).Toallowforasufficient
refractory period within the stimulus sweep, while
mini-mizingthetotalrecordingtime,an inter-stimulusinterval
(ISI)of93ms.fromoffsettoonsetofthenextstimuluswas
includedforrecordingFFRto/da/stimulus.Asimilar
pro-cedurewasrepeatedtorecordtheunaidedandaidedFFR
for/si/stimulus.However,forrecordingunaidedandaided
FFRto/si/ stimulus,an ISIof113mswasused.The order
of stimuli while testing on each participant was counter
balanced. The FFR was recorded from 1500 sweeps each
in condensationand rarefaction polarities,delivered in a
homogenoustrainusingthestimuluspresentationsoftware
Neuroscan4.4(Stim2-version4.4).
The FFR recording was initiated once a stable
elec-troencephalogram (EEG) was obtained. The ongoing EEG
was converted from analogue-to-digital with the rate
of 20,000Hz. The continuous EEG was online band-pass
CV boundary
Transition
1
0
–1
–30 6 42 78 114 150 Latency (msec)
186 222 258 294 330
Stimulus
Response Auto corelation (F0)
Brainstem tool box (F0 and F1 energies)
Amplitude (
µ
V)
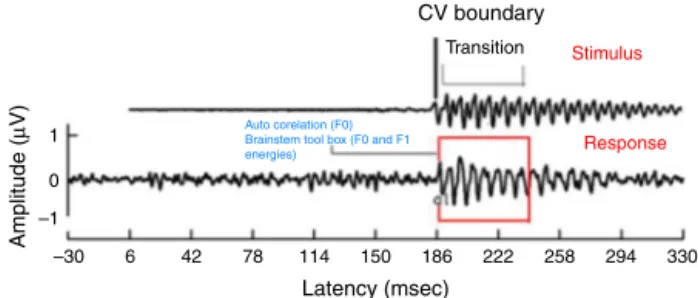
Figure3 TransitionresponseofFFRobtainedfrom/si/
stim-ulusinaidedcondition.
filteredfrom30to3000Hzwith12dB/octaveroll-off.This
wasstoredtodiscforofflineanalysis.
Dataanalyses
Theoutputofthehearingaidintheearcanalforeach
stim-ulusintheunaidedandaidedconditionswereanalyzedfor
spectra.Further,theFFRrecordedwasanalyzedforF0,F0
energyandF1energyobtainedforeachstimulus.The
con-tinuous EEGdata wereepoched over a window of 160ms
for /da/ stimulus (which included a 30ms pre-stimulus
periodanda130mspost-stimulustime).Theresponsefor
/si/stimuluswasepochedoverawindowof360ms(which
includedapre-stimulusperiodof30msandapost-stimulus
periodof330ms).Theepochedwaveformswerecorrected
for baseline. The responses were averaged and filtered
off-line from 0.030kHz (high-pass filter, 12dB/octave) to
3kHz(low-passfilter,12dB/octave).Allartefactsexceeding
±35Vwererejectedwhileaveragingtheresponseforeach
averagedresponse,inrarefactionandcondensation
polar-ity.Aminimumof1450 artefact-freeepochs wasensured.
The averagedwaveforms of rarefaction and condensation
polaritieswereadded.Further,theaddedwaveformswere
createdbyaveragingtwotrialsrecordedforeachstimulus,
inunaidedandaidedconditions.
For all the participants, the unaided responses were
absent for both the stimuli. FromFFR recorded for /da/
stimulus in aided condition, the latency of ‘V’ peak was
identifiedbyvisualinspection.ThedefaultMATLAB-codeof
autocorrelation wasutilized, inwhich arange forlatency
wasspecified toobtainF0 in theFFR i.e.,fromnoted‘V’
peaklatencytilltransitionduration.Whereas,thelatency
of‘a1’correspondingtoCVboundary30intheFFRwas
iden-tified for /si/ stimulus is shown in Fig.3. The latency of
‘a1’tilltransitiondurationwasspecifiedinautocorrelation
MATLAB codeto obtain F0 in the FFR. Further, F0 energy
andF1energyweredetermined,using‘BrainstemToolbox’
which utilizes the FFT technique (Fig. 4), from the
tran-sientresponse(‘V’peakfor/da/stimulus;and‘a1’for/si/
stimulus) tillspecified transition duration(37ms for /a/
stimulus;and47.1msfor/si/stimulus).33
Results
The spectral data obtained at the ear canal using probe
tube measurementand FFR at brainstem level were
ana-lyzedin goodandpoor hearingaid performers.Statistical
Burst/onset
A
B
VOT
1
0
–1
25
F0
F1
GHP PHP 20
15
10
Amplitude (Arbitr
ar
y unit)
5
0
500 1000 Frequency (Hz)
1500 –30 –14 2 18 34 50
Latency(ms)
66 82 98 114 130 Transition
Stimulus
Amplitude (
µ
V)
Auto-correlation-F0
Brainstem toolbox F0 energy and F1 energy
Figure4 (A)Responsecorrespondingtostimulusattransition
portionof/da/stimulus;(B)showinggrandaveragespectrum ofGHPandPHPsub-group.(B)Fundamentalfrequencyand fre-quencyoffirstformantinFFRfor/da/stimulus.
17)softwarewasusedtoperformthestatisticalanalyses.
The results obtained are discussed with respect to each
objective.
Hearingaidoutputattheearcanal
Spectral energy at frequencies from 0.25 to 8kHz (in
octaves)intheunaidedandaidedconditions,for boththe
stimuliwasanalyzed.It wasperformed todetermine
rep-resentationofenergyacrossfrequenciesat theearcanal,
in good and poor hearing aid performers. The data of
spectral energy met the assumption of normal
distribu-tion onKolmogorov---Smirnov normality test (p>0.05) and
homogeneity onLevene’s test (F<2). The spectralenergy
(0.5---8kHzinoctaves)forbothstimuliobtainedfromboth
groups,inunaidedandaidedconditions,wassubjectedto
MANOVA.The resultrevealedthattherewasnosignificant
differencebetweengroups in thespectralenergyat each
octavefrequency,inboththeunaidedandtheaided
condi-tions,for/a/and/si/stimuli.Thus,thedataofspectral
energywascombinedbetweengroups.Descriptiveanalysis
wascarriedoutseparatelyintheunaidedandaided
condi-tions.For/a/stimulus(Fig.5),atextremelowfrequency
(0.25kHz)andatextremehighfrequencies(4kHzand8kHz)
the energy in both unaided and aided conditions is
rela-tivelyminimalthanatotherfrequencies(0.5kHz,1kHzand
Unaided and aided spectra of /si/stimulus
120
100
80
60
Intensity (dB SPL)
Frequency (kHz)
40
0.25 0.50 1 2 4 8
Unaided
Aided
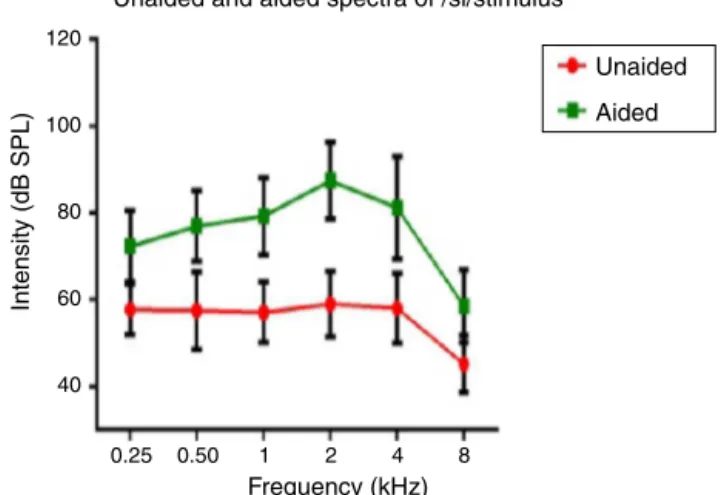
Figure5 Meanand standard deviationof intensity of/si/
stimulusasafunctionoffrequencyinunaidedandaided condi-tions.
2kHz).For/si/stimulus(Fig.6),atextremelowfrequencies
(0.25kHz)andatextremehighfrequency(8kHz)theenergy
inbothunaidedandaidedconditionsisrelatively minimal
comparedtootherfrequencies(1kHz,2kHzand4kHz).
ComparisonofFFRintermsofF0,F0energyand
F1energyingoodhearingaidperformersandpoor
hearingaidperformers
TheF0,F0energyandF1energyofFFRbetweenthegroups
foreachstimulusmettheassumptionofnormaldistribution
onKolmogorov---Smirnovnormalitytest(p>0.05)and
homo-geneityonLevene’stest(F<2)wasalsoperformed.Hence,
anindependentsamplest-testwasconductedoneachdata
ofFFRbetweenGHP(n=34)andPHP(n=24)groups.From
themeanvalueofF0ofFFR(Fig.7),itcanbeinferredthat
theF0wasrepresentedbetterinGHPthaninPHP,foreach
stimulus.Further,theF0ofFFRwascomparedbetweenGHP
andPHPusingindependentsamplestest.Theresultshowed
thattherewasasignificantbetterF0encodinginGHPthan
Unaided and aided spectra of /da/stimulus
120
100
80
60
Intensity (dB SPL)
Frequency (kHz)
40
0.25 0.50 1 2 4 8
Unaided
Aided
Figure6 Meanandstandarddeviationofintensityof/a/
P=.001
150
100
50
0
/da/stimulus /si/stimulus P=.006
GHP
Mean
±
SD of F0 of FFR
PHP
Figure7 Mean,standarddeviationandp-valueof
indepen-dentsamplest-testonF0ofFFRforeachstimulus,inGHPand
PHPgroups.
PHPfor/da/stimulus(t=3.41,p=0.001)and/si/stimulus
(t=2.84,p=0.006).
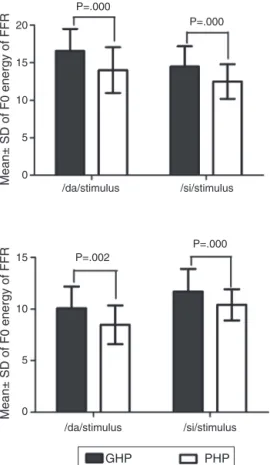
Inaddition,theF0energyandtheF1energyofFFRwas
comparedbetween GHPandPHPgroupstoeachstimulus.
FromFig.8,itwasnotedthatthemeanandstandard
devi-ationof F0 energyand F1 energy ofFFR toeach stimulus
werehigherinGHP thaninPHP.Further,toknow ifthere
wasanysignificantdifferencebetweenGHPandPHPinthe
mean the F0 energy and the F1 energy of FFR for each
stimulus,independentsamples t-testwasperformed. The
resultrevealedasignificanthigherF0energyinGHPthanin
P=.000
20
15
10
5
0
15
10
5
0
P=.000
P=.002
P=.000
Mean
±
SD of F0 energy of FFR
Mean
±
SD of F0 energy of FFR
/da/stimulus /si/stimulus
/da/stimulus
GHP PHP
/si/stimulus
Figure8 MeanandstandarddeviationofF0energy andF1
energyforeachstimulusinGHPandPHPgroups.
PHPfor/da/stimulus(t=6.80,p=0.000)and/si/stimulus
(t=6.20,p=0.000). Further,asignificant higherF1energy
wasobservedinGHPthanPHPfor/da/(t=3.11,p=0.002)
and/si/stimulus(t=5.20,p=0.000).
Discussion
Theaimofthestudywastoinvestigatetherepresentationof
amplifiedspeechattheearcanalandattheauditory
brain-stemfromthegoodandthepoorhearingaidperformers.
Effectofhearingaidprocessingonspectral parametersofspeechstimuli
Intheunaidedcondition for/da/and/si/stimuli,energy
measured at 2kHz was relatively larger than at other
frequencies (in octave). Further, there was a decline in
energyafter4kHzi.e.,anapproximately10dBperoctave
for /da/ stimulus and 12dB per octave for /si/
stimu-lus (Figs.5 and 6). This pattern of energyrepresentation
as a function of frequencies, for both the stimuli, could
be because of frequency response of microphone used in
recording the target test stimuli. In the aided condition
for /da/stimulusand /si/ stimulus,theenergymeasured
wasrelativelylessatthetwoextremecutofffrequencies,
whichisatlowfrequencybelow0.25kHzandhigh
frequen-ciesabove4kHz.Thus,atextreme frequencies,themean
energy inboth unaidedand aided conditionswas less. At
low frequency, reduced energy could be because of less
gain in that frequency region provided by the
prescrip-tive formula.34 Additionally, low energy noted in the low
frequency region of /da/ and /si/ stimulus couldalso be
becauseoffrequencyresponseofthehearingaid.Thelow
frequencycut-offofthefrequencyresponseofthetest
hear-ingaidwas0.21kHz.Athighfrequenciesi.e.,above4kHz,
theenergyreducedapproximatelyattherateof10dBper
octavefor/da/and14dBperoctavefor/si/stimulus.This
couldbethefrequencyresponseof/da/and/si/stimulus
hadenergytill4kHzasnotedfromunaidedcondition.Yet
anotherreasoncouldbethoughthefrequencyresponseof
hearingaid had0.216to6.5kHz,energyafter4kHz
grad-ually reduced per octave. Thus, remarkable energy was
notedinthefrequency rangefrom0.5kHzto4kHz.Itcan
beinferred thatthereis arelatively highamplification in
themid-frequencyregionofthehearingaidthanothertwo
extremecut-offfrequencies(lowandhigh).Informally,
par-ticipantswereinstructedtorepeatthesyllableswhichwere
randomlypresentedfor threetimes.Inunaidedcondition,
the participantswereunabletoidentify theCVtokens as
thepresentationlevelwas65dBSPL,whichfailedtoreach
audibilityrange.However,inaidedcondition,allthe
partic-ipantsconsistentlyidentifiedsyllables.Further,onspectral
analysis, it was noted that the amplitude of aided burst
spectrumof/da/wassimilartotheunprocessedburst
spec-trumamplitudeof/da/.Itwasalsoobservedthatamplitude
spectrum of fricative /si/ wassimilarto theunprocessed
fricative spectrum amplitude of /si/. This infers that
hearing aid preserves inherent speech cues at the ear
ComparisonofF0ofFFR,F0energyandF1energy
ingoodandpoorhearingaidperformers
TheFFRinbothunaidedandaidedconditionswereobtained
from all the participants. In the unaided condition, the
brainstemresponseswereabsent,asthestimuli(/da/and
/si/) were presented at 65dB SPL,which failedto reach
audibility.Intheaided condition,theF0 representationin
theFFRtoeach stimulus(/da/and/si/) remainedrobust
andsimilartothatoftheunprocessedfilteredrawstimulus.
This indicated thatpreserved spectralcontentfrom
hear-ingaidisrelayedtotheauditorybrainstemlevel.For/da/
stimulus,themeanF0ofFFRwashigherinGHP(133.46Hz)
than inPHP (128.84),such thatthe differencewasfound
tobesignificantlydifferent.ThiswastrueforF0ofFFRfor
/si/stimulusbetweenGHP(134.42Hz)andPHP(130.84Hz).
Further,theF0oftheaidedstimulusof/da/was134.95Hz
andthatfor/si/was144.74Hz.ThedifferenceinF0(inHz),
betweenencodingofF0atbrainstemlevelandF0ofaided
teststimuluswas1HzinGHPand6HzinPHPfor/da/
stim-ulus.Similarly,thedifferencenotedwas10HzinGHP and
14HzinPHPfor/si/stimulus.
The meandifferencebetween theGHP andPHPin the
encodingofF0was5Hzfor/da/and4Hzfor/si/stimulus.
ThoughthisdifferencewassignificantintheencodingofF0
betweenGHPandPHPforbothstimuli,thismaynotbring
achangeinspeakeridentity. Thisisbecause,accordingto
Iles35achangeofupto±25HzintheF
0willnotbringabout
achangeinspeakeridentity.Thefindingofthestudyisin
accordancewiththeresearchreportbyHorii36whoreported
thata differenceofgreater than25Hz inthe F0between
thesametwostimulidoes notcausedifferenceinspeaker
identity.Additionally,theintra-subjectvariabilityofF0ina
normalvocaleffortrangedbetween±9.6Hz.37Thus,itcan
beinferredthatthemeanF0ofFFRto/da/and/si/stimuli
wasneurally well represented in GHP than PHP, and that
boththegroupswereabletorecognizetheidentityofthe
speaker.
Further,itwasnotedthattheF0energyandtheF1energy
of FFR to each stimulus were significantly higher in GHP
thanPHP.ThehigherenergiesofF0andF1inGHPmightbe
duetostrongerefferentfibresthatinhibitotherharmonics
thatdonotcorrespondtofundamentalfrequency and
for-mantfrequencies.This isinaccordancewiththeresearch
reportsbyAshmore38andKnight.39Tobemorespecific,
cen-tralafferentmechanismisstrongerinthegroupofGHPsuch
thatneuronsatinferiorcolliculusfirepreciselytothe
har-monicscorrespondingtoF0andF1.Inaddition,theefferent
mechanismmightbestrongersuchthattheefferentfibres
inhibittheotherharmonicswhichdonotcorrespondtothe
fundamental frequency andformant frequencies, thereby
finetuningtheauditoryinput.Theexcitatoryandinhibitory
mechanismsofneuronsoftheunderlyingneuralgenerator
oftheinferiorcolliculusinGHPfire moreor lessprecisely
tothe correspondingF0 andF1 componentsof the
stimu-lus.Theinferenceofthepresentstudysupportsthefindings
reportedbyKrishnan.40Hedemonstratedthatefferent
audi-torypathwaysuppressesenergiesadjacenttotheharmonics
correspondingtothe F0 andthe F1 of FFR.Along withan
activeafferentpathway, theafferentauditory nerve
gen-eratestheelectricalactivity morepreciselycorresponding
to the F0 and the F1 of the stimulus. This involves the
release of neurotransmitter, thereby reducing the
trans-membranethresholdandincrease inneuralfiring. Inpoor
hearingaidperformers,thoughsimilarphysiologicalactivity
waspresent,probablyalackofprecisioninneuralactivity
dueto less sensitive afferent andweak efferent auditory
pathway,mighthavefailedtoprovidehigherenergyat
har-monicscorrespondingtoF0andF1ofeachstimulus.Thus,it
iscanbeinferredfromthepresentstudythatsubtle
physio-logicalvariationsmightbepresentattheinferiorcolliculus
oftheauditorypathwayinthepoorhearingaidperformers
withreferencetothatingoodhearingaidperformers.
Conclusion
Thoughthehearingaidpreserved inherentcuesin speech
syllables,an effectof annoyancetowardsnoise altersthe
neuralencodingat auditorybrainstemlevel. Itinfersthat
acoustic cues transferred by hearing aid are successfully
reliedat auditorybrainstem levelbut subtlephysiological
alterationswerepresentatauditorybrainsteminthose
indi-vidualswhoareannoyedfromthosewhoarenotbynoise.
Implication
Thestudypresentsanevidencetouseobjectiveapproaches
to validate the hearing aid output at ear canal and at
auditorybrainstem level. Utilization ofthe realear
mea-surementfor analyzing the hearing aid output in the ear
canalwill help in knowing the representationof inherent
speechcues.Studyingtheencodingofamplified speechin
individualswithhearing impairmentwiththeir annoyance
level demonstrates a critical role of stimulus contingent
response in the assessment of hearing aid algorithms. It
solvessome of the practical problems faced by the
audi-ologists regarding setting of amplification parameters in
providingthemaximumusableinformation.Findingsofthe
present study help the audiologist in counselling a
hear-ingaid userregarding extentof benefitderived withbest
hearingaidprescribed.
Conflicts
of
interest
Theauthorsdeclarenoconflictsofinterest.
Acknowledgements
TheauthorswouldliketothanktheDirectorandthe
HOD-Audiology, All India Institute of Speech and Hearing, for
granting permission to carry out the study. The authors
wouldalsothankalltheparticipantsofthestudyfortheir
co-operation.
References
1.Bentler RA, NiebuhrDP, Getta JP, Anderson CV.Longitudinal studyofhearingaideffectiveness.II:Subjectivemeasures.J SpeechHearRes.1993;36:820---31.
3.NemesJ.Despitebenefitsofoutcomesmeasures,advocatessay they’reunderused.HearJ.2003;56:19---25.
4.Nabelek AK.Acceptance ofbackgroundnoisemay bekey to successfulfittings.HearJ.2005;58:10---5.
5.NabelekAK,TuckerFM,LetowskiTR.Tolerationofbackground noises:relationshipwithpatternsofhearingaidusebyelderly persons.JSpeechHearRes.1991;34:679---85.
6.Nabelek AK, Freyaldenhoven MC, Tampas JW, Burchfiel SB, MuenchenRA.Acceptablenoiselevelasapredictorofhearing aiduse.JAmAcadAudiol.2006;17:626---39.
7.FreyaldenhovenMC,SmileyDF.Acceptanceofbackgroundnoise inchildrenwithnormalhearing.JEducAudiol.2006;13:27---31.
8.vonHapsburgD,BahngJ.Acceptanceofbackgroundnoise lev-elsin bilingual(Korean-English)listeners. JAmAcadAudiol. 2006;17:649---58.
9.BrannstromKJ,LantzJ,NielsenLH,OlsenSO.Acceptablenoise levelwithDanish,Swedish,andnon-semanticspeechmaterials. IntJAudiol.2012;51:146---56.
10.PlylerPN,AlworthLN,RossiniTP,MapesKE.Effectsofspeech signalcontentandspeaker genderonacceptanceofnoisein listenerswithnormalhearing.IntJAudiol.2011;50:243---8.
11.Harkrider AW, Tampas JW. Differences in responses from the cochleae and central nervous systems of females with low versus high acceptable noiselevels. JAm Acad Audiol. 2006;17:667---76.
12.Tampas JW, Harkrider AW, Hedrick MS. Neurophysiological indicesofspeechandnonspeechstimulusprocessing.JSpeech LangHearRes.2005;48:1147---64.
13.SouzaPE,TremblayKL.Newperspectivesonassessing amplifi-cationeffects.TrendsAmplif.2006;10:119---43.
14.MuellerHG.Probemicrophonemeasurement:unplugged.Hear Rev.2005;48:10---36.
15.Cunningham DR,Lao-DavilaRG, Eisenmenger BA,Lazich RW. StudyfindsuseofLiveSpeechMappingreducesfollow-upvisits andsavesmoney.JHear.2002;55:43---6.
16.StelmachowiczPG,KopunJ,MaceA,LewisDE,NittrouerS.The perceptionofamplifiedspeechbylistenerswithhearingloss: acousticcorrelates.JAcoustSocAm.1995;98:1388---99.
17.SouzaPE,TremblayKL.Combiningacoustic, electrophysiolog-icalandbehavioralmeasuresofhearingaids.Scottsdale,AZ: AmericanAuditorySociety;2005.
18.Kewley-Port D. Time-varying features as correlates of place of articulation in stop consonants. J Acoust Soc Am. 1983;73:322---35.
19.SouzaPE,TremblayKL,Davies-Venn E,KalsteinL. Explaining consonanterrorsusingshort-termaudibility.SaltLakeCity,UT: AmAcadAudiol;2004.
20.Kraus N, Nicol T. Brainstem origins for cortical ‘what’ and ‘where’ pathways in the auditory system. Trends Neurosci. 2005;28:176---81.
21.Young ED, Sachs MB. Representation of steady-state vowels in the temporal aspects of the discharge patterns of
populationsofauditory-nervefibers.JAcoustSocAm.1979;66: 1381---403.
22.WordenFG,MarshJT.Frequency-following(microphonic-like) neural responses evoked by sound. Electroencephalogr Clin Neurophysiol.1968;25:42---52.
23.RussoN,NicolT,MusacchiaG,KrausN.Brainstemresponsesto speechsyllables.ClinNeurophysiol.2004;115:2021---30.
24.RussoNM, NicolTG,ZeckerSG, HayesEA,KrausN.Auditory trainingimprovesneuraltiminginthehumanbrainstem.Behav BrainRes.2005;156:95---103.
25.Johnson KL, Nicol T, Zecker SG, Kraus N. Developmen-tal plasticity in the human auditory brainstem. J Neurosci. 2008;28:4000---7.
26.Chandrasekaran B, Kraus N. The scalp-recorded brainstem responsetospeech:neuraloriginsandplasticity. Psychophys-iology.2010;47:236---46.
27.CunninghamJ,NicolT,ZeckerSG,BradlowA,KrausN. Neuro-biologicresponsestospeechinnoiseinchildrenwithlearning problems:deficitsandstrategiesforimprovement.Clin Neuro-physiol.2001;112:758---67.
28.Parbery-ClarkA,SkoeE,LamC,KrausN.Musicianenhancement forspeech-in-noise.EarHear.2009;30:653---61.
29.HornickelJ,SkoeE,KrausN.Subcorticallateralityofspeech encoding.AudiolNeurootol.2009;14:198---207.
30.HemanthN,ManjulaP.Representationofspeechsyllablesat auditorybrainstem.JIndianSpeechHearAssoc.2012;26:1---13.
31.PittmanAL, Stelmachowicz PG. Hearing lossin childrenand adults:audiometricconfiguration,asymmetry,andprogression. EarHear.2003;24:198---205.
32.SairamVVS,ManjulaP.Longtermaveragespeechspectrumin Kannada.UniversityofMysore;2002.
33.SkoeE,NicolT,KrausN.Phasecoherenceandthehuman brain-stemresponsetoconsonant-vowelsounds.In:Associationfor researchinotolaryngologysymposium.2008.
34.DillonH,KatschR,ByrneD,ChingT,KeidserG,BrewerS.The NAL-NL1 prescription procedurefor non-linear hearing aids. National Acoustics Laboratories Research and Development, Sydney:NationalAcousticsLaboratories;1998.
35.IlesMW.Speakeridentificationasafunctionoffundamental fre-quencyandresonantfrequencies.UniversityofFlorida;1972.
36.HoriiY.Fundamentalfrequencyperturbationobservedin sus-tainedphonation.JSpeechHearRes.1979;22:5---19.
37.AbbertonE.Alaryngographicstudyofvoicequality.University ofLondon;1976.
38.Ashmore JF. Afast motileresponse in guinea-pigouter hair cells:the cellular basis of thecochlear amplifier.J Physiol. 1987;388:323---47.
39.KnightRT.Distributedcorticalnetworkforvisualattention.J CognNeurosci.1997;9:75---91.